

Review
doi: 10.1097/ALN.0000000000002731.
Driving Pressure and Transpulmonary Pressure: How Do We Guide Safe Mechanical Ventilation?
Affiliations
- PMID: 31094753
- PMCID: PMC6639048
- DOI: 10.1097/ALN.0000000000002731
Item in Clipboard
Review
Driving Pressure and Transpulmonary Pressure: How Do We Guide Safe Mechanical Ventilation?
Anesthesiology.
2019 Jul.
Abstract
The physiological concept, pathophysiological implications and clinical relevance and application of driving pressure and transpulmonary pressure to prevent ventilator-induced lung injury are discussed.
Conflict of interest statement
Figures
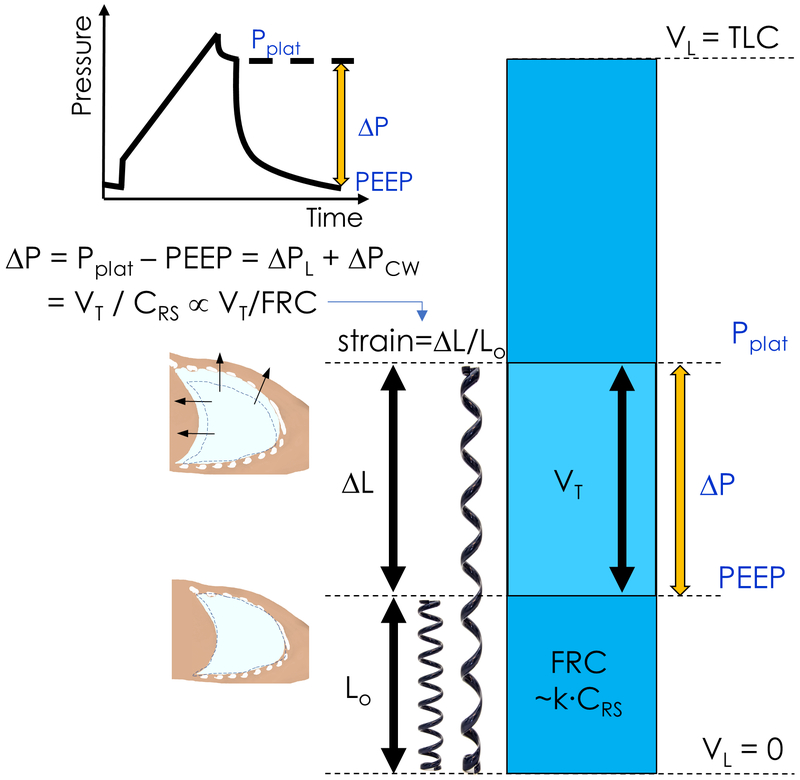
Driving pressure (ΔP) is calculated as the difference between plateau pressure (Pplat) and positive end-expiratory pressure (PEEP). Driving pressure is composed of two pressures: that distributed to the lung itself, the transpulmonary pressure (ΔPL), and that applied to the chest wall (ΔPcw). Rearrangement of the standard respiratory system compliance (CRS) equation leads to driving pressure as equal to the tidal volume (VT) divided by CRS. Strain is a measure of material deformation relative to its original state. For example, the linear displacement of a spring (ΔL) relative to its rest length (Lo), or equivalently the ratio of VT to residual functional capacity (FRC). As CRS changes in proportion to FCR, i.e FRC=k × CRS, VT/CRS is an approximation of tidal volume normalized to FRC, and ΔP is proportional to lung strain. TLC=Total lung capacity. VL = lung volume.
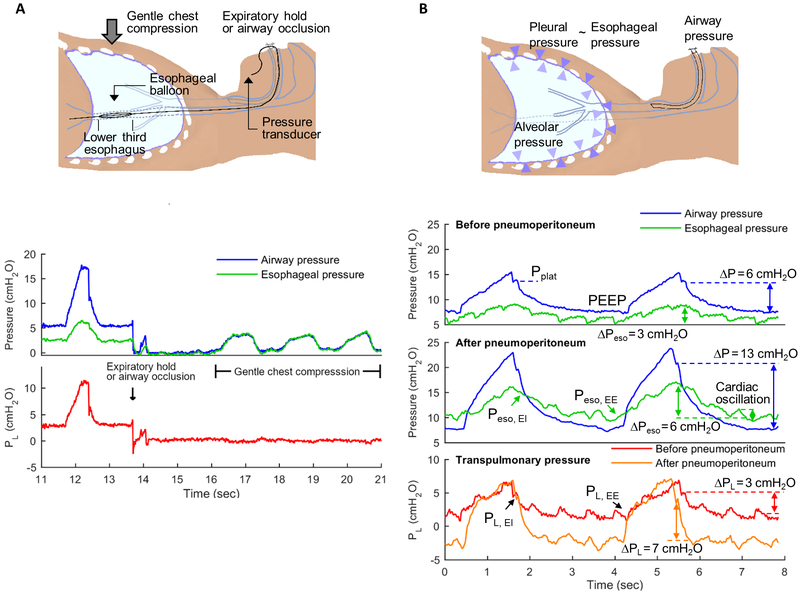
Airway opening, esophageal (Peso) and transpulmonary pressures (PL) measurements. PL is defined as the difference between airway opening pressure (blue lines) and pleural pressure. Pleural pressure is frequently estimated from esophageal balloon pressure measurements (Peso). Using a specific protocol, the esophageal balloon is placed in the lower third of the esophagus (2A). Cardiac oscillations in Peso (2B, green lines) indicate accurate placement of the balloon, which can be confirmed by observation of similar airway pressure and Peso measurements as gentle chest compressions are performed during expiratory pause or with occluded airway opening (2A). PL can be estimated as the difference between airway and esophageal pressures (red and orange lines). Interventions such as pneumoperitoneum (2B, mid panel) produce a marked change in driving pressures (ΔP = plateau pressure, PPlat, minus positive end-expiratory pressure, PEEP). In this example, ΔP increased by 7 cmH2O. Yet, delta PL (end-inspiratory PL, PL EI, minus end-expiratory PL, PL EE) does not increase to the same degree as ΔP and PPlat. The change in delta PL in this example was 4 cm H2O. This demonstrates that part of the increase in ΔP and PPlat are due to the chest wall component and not to pressures applied to the lung parenchyma. This contribution of the chest wall is evidenced by the increased end-inspiratory (EI) to end-expiratory (EE) oscillation in Peso after as compared to before pneumoperitoneum. In addition, the esophageal pressure at end-expiration (Peso EE, at ~4 seconds on time scale) is positive before pneumoperitoneum while it is negative after pneumoperitoneum. This implies mechanical conditions consistent with lung collapse after pneumoperitoneum. Indeed, while PL did not increase by the same magnitude as ΔP, it also increased, indicating loss of lung compliance. Such conditions could prompt use of higher PEEP to prevent lung derecruitment.
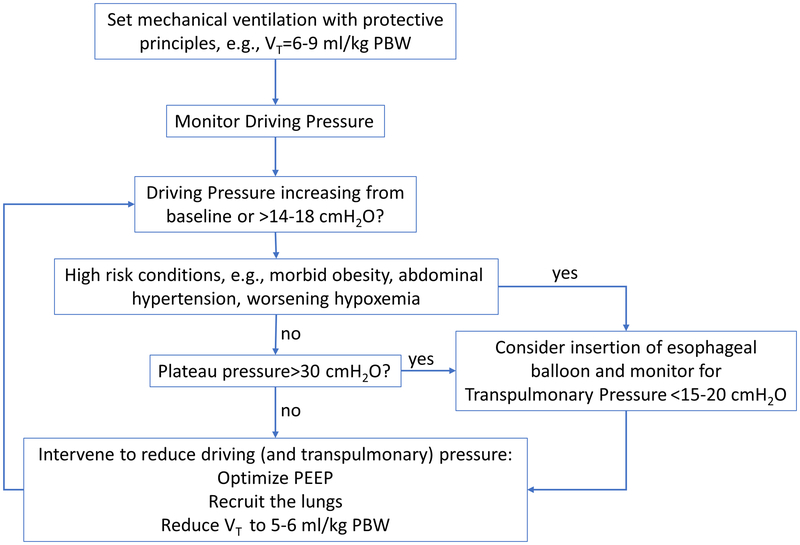
Approach for use of driving and transpulmonary pressures to guide mechanical ventilation during anesthesia. Limits presented are based on current experimental and clinical literature. Safety limits have not yet been defined in clinical trials.
References
-
- Ferrando C, Soro M, Unzueta C, Suarez-Sipmann F, Canet J, Librero J, Pozo N, Peiro S, Llombart A, Leon I, India I, Aldecoa C: Individualised perioperative open-lung approach versus standard protective ventilation in abdominal surgery (iPROVE): a randomised controlled trial. Lancet RespirMed 2018:Published Online January 19, 2018-Published Online January 19, 2018 - PubMed
-
- Futier E, Constantin JM, Paugam-Burtz C, Pascal J, Eurin M, Neuschwander A, Marret E, Beaussier M, Gutton C, Lefrant JY, Allaouchiche B, Verzilli D, Leone M, De Jong A, Bazin JE, Pereira B, Jaber S, IMPROVE Study Group: A trial of intraoperative low-tidal-volume ventilation in abdominal surgery. N Engl J Med 2013; 369:428–37 - PubMed
-
- PROVE Network Investigators for the Clinical Trial Network of the European Society of Anaesthesiology, Hemmes SN, Gama de Abreu M, Pelosi P, Schultz MJ: High versus low positive end-expiratory pressure during general anaesthesia for open abdominal surgery (PROVHILO trial): a multicentre randomised controlled trial. Lancet 2014; 384:495–503 - PMC - PubMed
-
- Acute Respiratory Distress Syndrome Network, Brower RG, Matthay MA, Morris A, Schoenfeld D, Thompson BT, Wheeler A: Ventilation with lower tidal volumes as compared with traditional tidal volumes for acute lung injury and the acute respiratory distress syndrome. N Engl J Med 2000; 342:1301–8 - PubMed
-
- Amato MB, Meade MO, Slutsky AS, Brochard L, Costa EL, Schoenfeld DA, Stewart TE, Briel M, Talmor D, Mercat A, Richard JC, Carvalho CR, Brower RG: Driving pressure and survival in the acute respiratory distress syndrome. N Engl J Med 2015; 372:747–55 - PubMed
Publication types
MeSH terms
Grants and funding
LinkOut - more resources
Full Text Sources
Medical
