. 2019 Jun;51(6):1270-1281.
doi: 10.1249/MSS.0000000000001939.

Physical Activity, All-Cause and Cardiovascular Mortality, and Cardiovascular Disease

Affiliations

Physical Activity, All-Cause and Cardiovascular Mortality, and Cardiovascular Disease

William E Kraus et al. Med Sci Sports Exerc. 2019 Jun.

Abstract

Purpose: Conduct a systematic umbrella review to evaluate the relationship of physical activity (PA) with all-cause mortality, cardiovascular mortality, and incident cardiovascular disease (CVD); to evaluate the shape of the dose-response relationships; and to evaluate these relationships relative to the 2008 Physical Activity Guidelines Advisory Committee Report.

Methods: Primary search encompassing 2006 to March, 2018 for existing systematic reviews, meta-analyses, and pooled analyses reporting on these relationships. Graded the strength of evidence using a matrix developed for the Physical Activity Guidelines Advisory Committee.

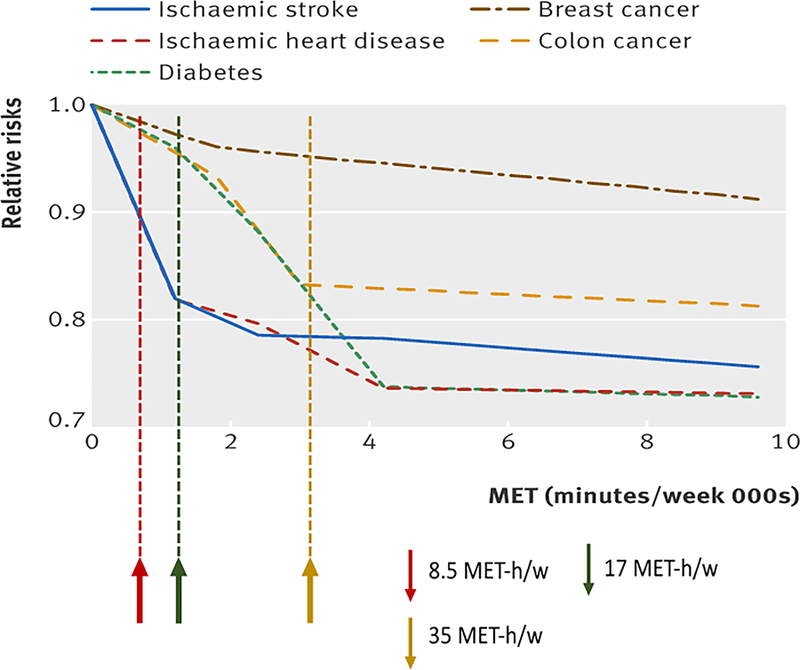
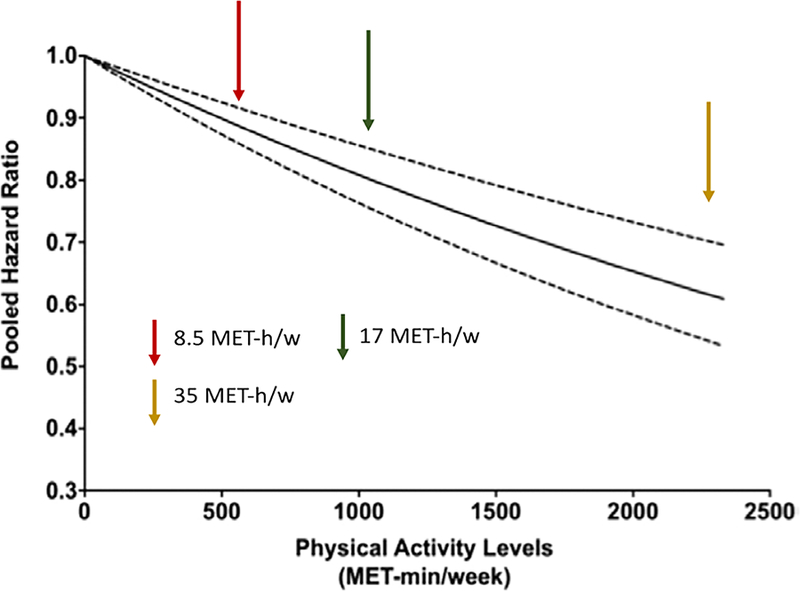
Results: The association of self-reported moderate-to-vigorous physical activity (MVPA) on all-cause mortality, CVD mortality, and atherosclerotic CVD-including incident coronary heart disease, ischemic stroke and heart failure-are very similar. Increasing MVPA to guidelines amounts in the inactive US population has the potential to have an important and substantial positive impact on these outcomes in the adult population. The following points are clear: the associations of PA with beneficial health outcomes begin when adopting very modest (one-third of guidelines) amounts; any MVPA is better than none; meeting the 2008 PA guidelines reduces mortality and CVD risk to about 75% of the maximal benefit obtained by physical activity alone; PA amounts beyond guidelines recommendations amount reduces risk even more, but greater amounts of PA are required to obtain smaller health benefits; and there is no evidence of excess risk over the maximal effect observed at about three to five times the amounts associated with current guidelines. When PA is quantified in terms of energy expenditure (MET·h·wk), these relationships hold for walking, running, and biking.

Conclusions: To avoid the risks associated with premature mortality and the development of ischemic heart disease, ischemic stroke, and all-cause heart failure, all adults should strive to reach the 2008 Physical Activity Guidelines for Americans.


Conflict of interest statement

Conflicts of Interest and Source of Funding

The results of this study are presented clearly, honestly, and without fabrication, falsification, or inappropriate manipulation. The Committee’s work was supported by the U.S. Department of Health and Human Services (HHS). Committee members were reimbursed for travel and per diem expenses for the five public meetings; Committee members volunteered their time. The authors report no other potential conflicts of interest.

Figures

Figure 1.
Figure 1.. The Association Between Walking and All-Cause Mortality in Men and Women.
Source: M Hamer, and Y Chida, 2008 (9). Forest plot showing point and 95% confidence interval estimates of the HR for all-cause mortality associated with different amounts of PA. Relative influence on the pooled results/effect sizes are represented by varying line weights of the symbols. Walking is favored, with a shift of the estimate to the left. These estimates are similar to the associations found for CVD mortality discussed later.
Figure 2.
Figure 2.. Relationships of Moderate-to-Vigorous Physical Activity to All-Cause Mortality, with Highlighted Characteristics Common to Studies of This Type.
Source: adapted from Moore et al., 2012 (17). Shown is the relation of leisure time physical activity amount and hazard ratios for mortality. The points shown represent the mortality hazard ratio for each of the physical activity categories; the vertical lines represent the 95% CIs for that physical activity category. The reference category no leisure time physical activity. The lines connecting the points help to illustrate the dose–response relationship between physical activity and risk of mortality; the shape of the association shown here is similar to that obtained using spline modeling. As discussed in the text and displayed in this graphic, the characteristics of this curve seems to apply for most studies of the relationships of moderate-to-vigorous physical activity with all-cause and CVD mortality, as well as with incident coronary artery disease, ischemic stroke and all-cause heart failure: there is no lower threshold for effect; there is a steep, early slope; about 70% of the benefit obtained by physical activity alone is reached by 8.25 MET-h/w (150 minutes of “brisk walking” (3 miles per hour); there is not apparent upper threshold for effect; there is no evidence for increased risk at the greatest amounts of physical activity; and there is not obvious “best amount”.
Figure 3.
Figure 3.. Relationships of Moderate-to-Vigorous Physical Activity to All-Cause Mortality, with Highlighted Characteristics Common to Studies of This Type.
Source: adapted from Arem H et al., 2015 (15). The ranges of physical activity relative to 2008 US Physical Activity Guidelines for aerobic activity are shown as ranges. There is no increase in risk noted up to 10 times the current guidelines PA amounts.
Figure 4.
Figure 4.. Plot with Spline and 95% Confidence Intervals of Relative Risk of Coronary Heart Disease by Kcal Per Week of Leisure-time Physical Activity.
Source: Sattelmair et al., 2011 (27). This summary of the synthesis of nine studies displays the characteristics of this dose-response relationship with all-cause mortality as shown and discussed in Figure 2.
Figure 5.
Figure 5.. Dose-Response Relationships Between Total Physical Activity and Risk of Breast Cancer, Colon Cancer, Diabetes, Ischemic Heart Disease, and Ischemic Stroke Events Using 174 Studies (43 For Ischemic Heart Disease, and 26 For Ischemic Stroke).
Adapted from Kyu, 2016 (25). For reference, shown are the lower end (red arrows and dotted line) and upper bounds (green arrows and dotted line) of the 2008 Guidelines for moderate-to-vigorous physical activity. Also indicated is the moderate-to-vigorous physical activity amount associated with normalization of the risk from >8h per day of sedentary activity from Ekelund, 2016 (8) (gold arrows and dotted line). The latter would represent the amount of physical activity required to compensate for an entirely sedentary lifestyle. The risk for ischemic heart disease and ischemic stroke are reminiscent of the characteristic dose-response relationships established for all-cause and cardiovascular mortality noted previously and in Figure 2. The universality of the dose-response relationships described in the caption of Figure 2 to other outcomes — such as type 2 diabetes and some cancers — are shown in this figure.
Figure 6.
Figure 6.. Dose-Response Relationships Between Moderate-to-Vigorous Physical Activity and Risk of Incident Heart Failure.
Source: Adapted from Pandey et al., 2015 (26). For reference, shown are the lower end (red arrows and dotted line) and upper bounds (green arrows and dotted line) of the 2008 Guidelines for moderate-to-vigorous physical activity. Also indicated is the moderate-to-vigorous physical activity amount associated with normalization of the risk from >8h per day of sedentary activity from Ekelund et al., 2016 (8) (gold arrows and dotted line). The latter would represent the amount of physical activity required to compensate for a highly sedentary lifestyle. Note, the colors of the arrows are important, not the direction of the arrow.

References

    1. Physical Activity Guidelines Advisory Committee. Physical Activity Guidelines Advisory Committee Scientific Report Washington, DC: U.S. Department of Health and Human Services; 2008.
    1. Physical Activity Guidelines for Americans In: DHHS, editor. Washington, DC: U.S. Department of Health and Human Services; 2008.
    1. Physical Activity Guidelines Advisory Committee 2018. 2018 Physical Activity Guidelines Advisory Committee Scientific Report Washington, DC: U.S. Department of Health and Human Services; 2018.
    1. Torres A, Tennant B, Ribeiro-Lucas I, Vaux-Bjerke A, Piercy K, Bloodgood B. Umbrella and systematic review methodology to support the 2018 Physical Activity Guidelines Advisory Committee. J Phys Act Health 2018;1–6. - PubMed
    1. Johnson BT, MacDonald HV, Bruneau ML Jr., Goldsby TU, Brown JC, Huedo-Medina TB, et al. Methodological quality of meta-analyses on the blood pressure response to exercise: a review. J Hypertens 2014;32(4):706–23. Epub 2014/01/28. doi: 10.1097/hjh.0000000000000097. - DOI - PubMed

Publication types