

Model of personalized postprandial glycemic response to food developed for an Israeli cohort predicts responses in Midwestern American individuals
- PMID: 31095300
- PMCID: PMC6599737
- DOI: 10.1093/ajcn/nqz028
Model of personalized postprandial glycemic response to food developed for an Israeli cohort predicts responses in Midwestern American individuals
Erratum in
-
Erratum to Mendes-Soares et al. Model of personalized postprandial glycemic response to food developed for an Israeli cohort predicts responses in Midwestern American individuals. Am J Clin Nutr 2019;110:63-75.Am J Clin Nutr. 2019 Sep 1;110(3):783. doi: 10.1093/ajcn/nqz142. Am J Clin Nutr. 2019. PMID: 31505550 Free PMC article. No abstract available.
Abstract
Background: Controlled glycemic concentrations are associated with a lower risk of conditions such as cardiovascular disease and diabetes. Models commonly used to guide interventions to control the glycemic response to food have low efficacy, with recent clinical guidelines arguing for the use of personalized approaches.
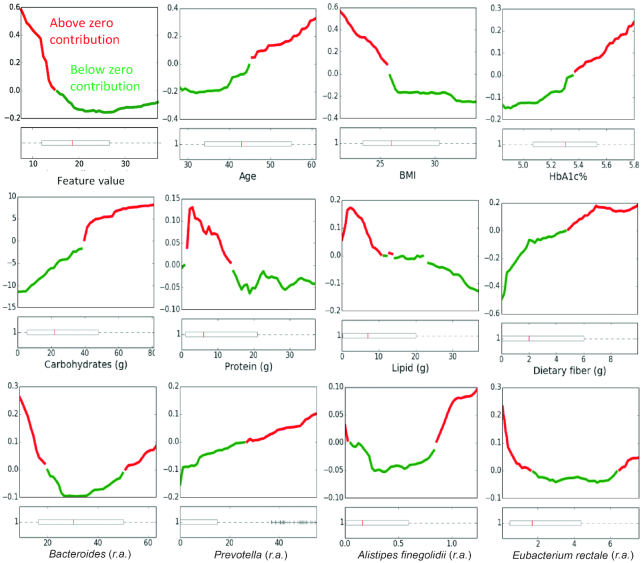
Objective: We tested the efficacy of a predictive model of personalized postprandial glycemic response to foods that was developed with an Israeli cohort and that takes into consideration food components and specific features, including the microbiome, when applied to individuals from the Midwestern US.
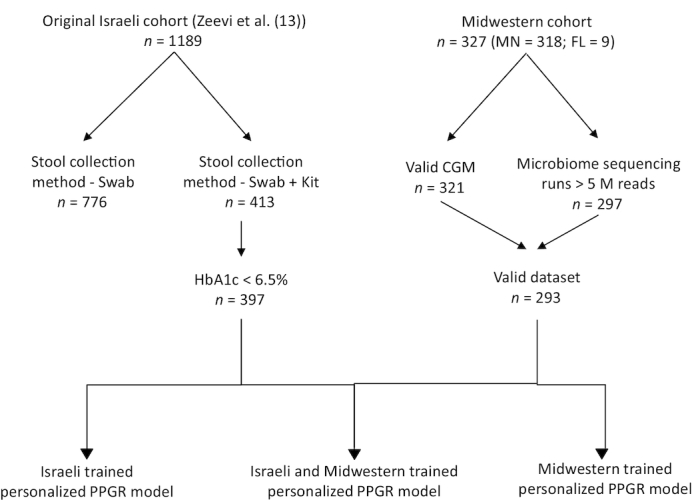
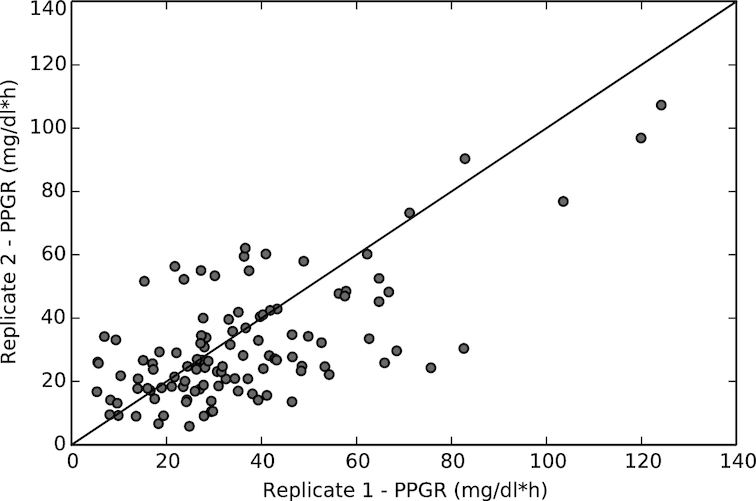
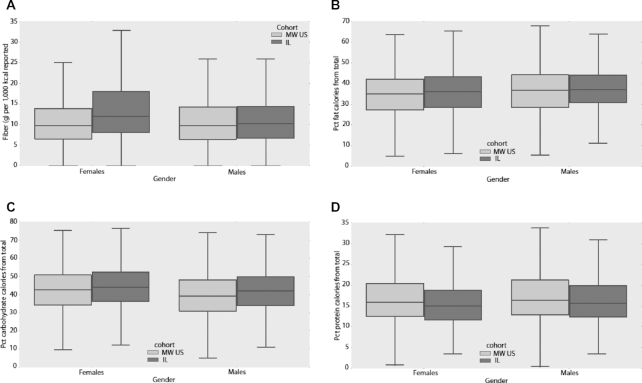
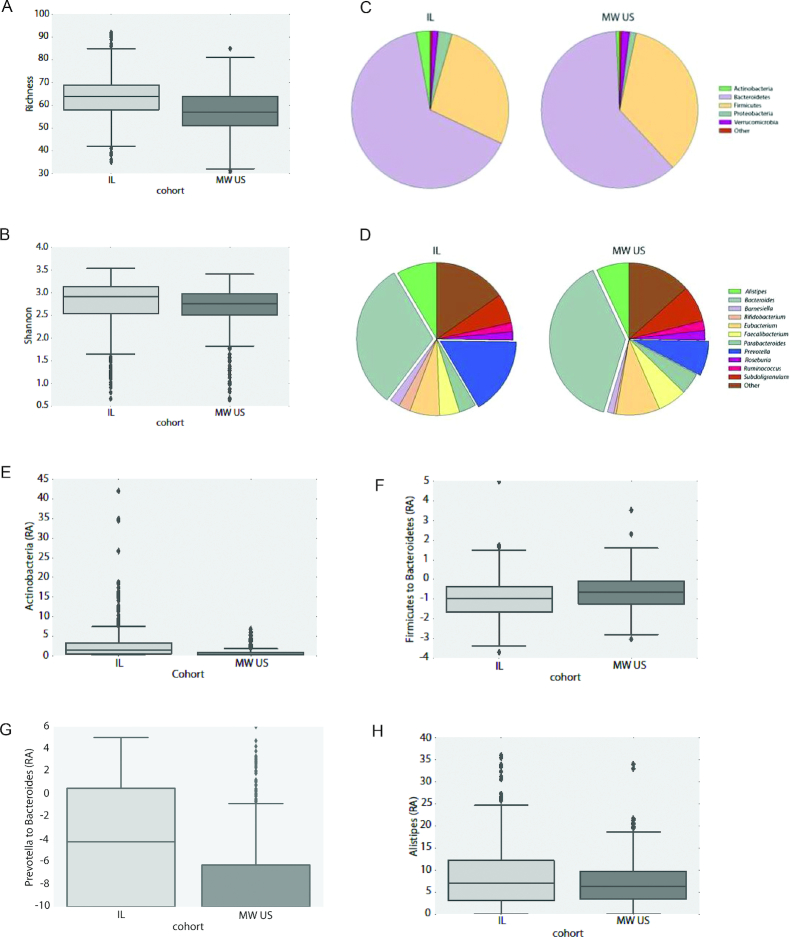
Design: We recruited 327 individuals for this study. Participants provided information regarding lifestyle, dietary habits, and health, as well as a stool sample for characterization of their gut microbiome. Participants were connected to continuous glucose monitors for 6 d, and the glycemic response to meals logged during this time was computed. The ability of a model trained using meals logged by the Israeli cohort to correctly predict glycemic responses in the Midwestern cohort was assessed and compared with that of a model trained using meals logged by both cohorts.
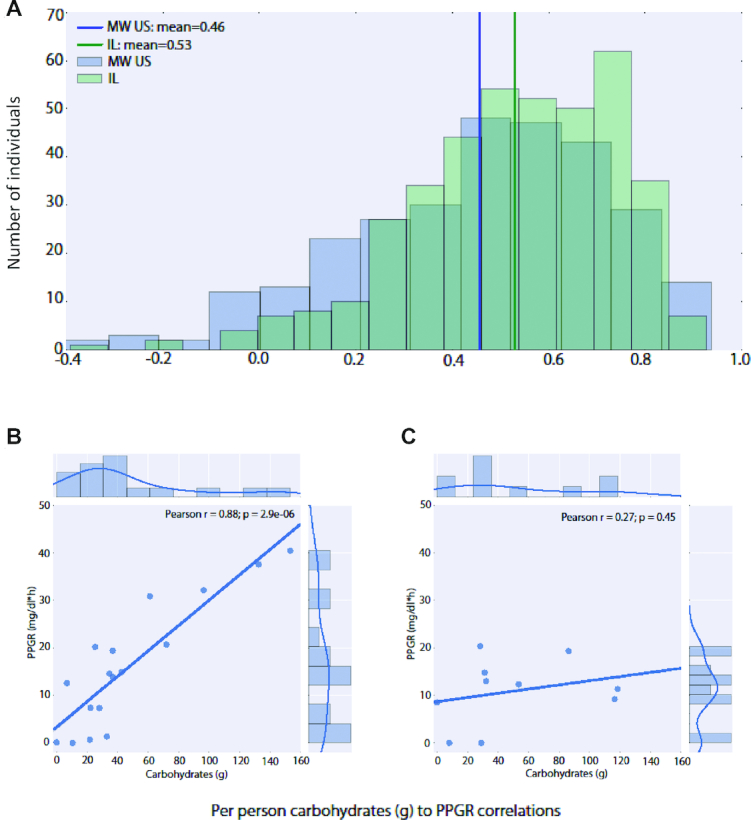
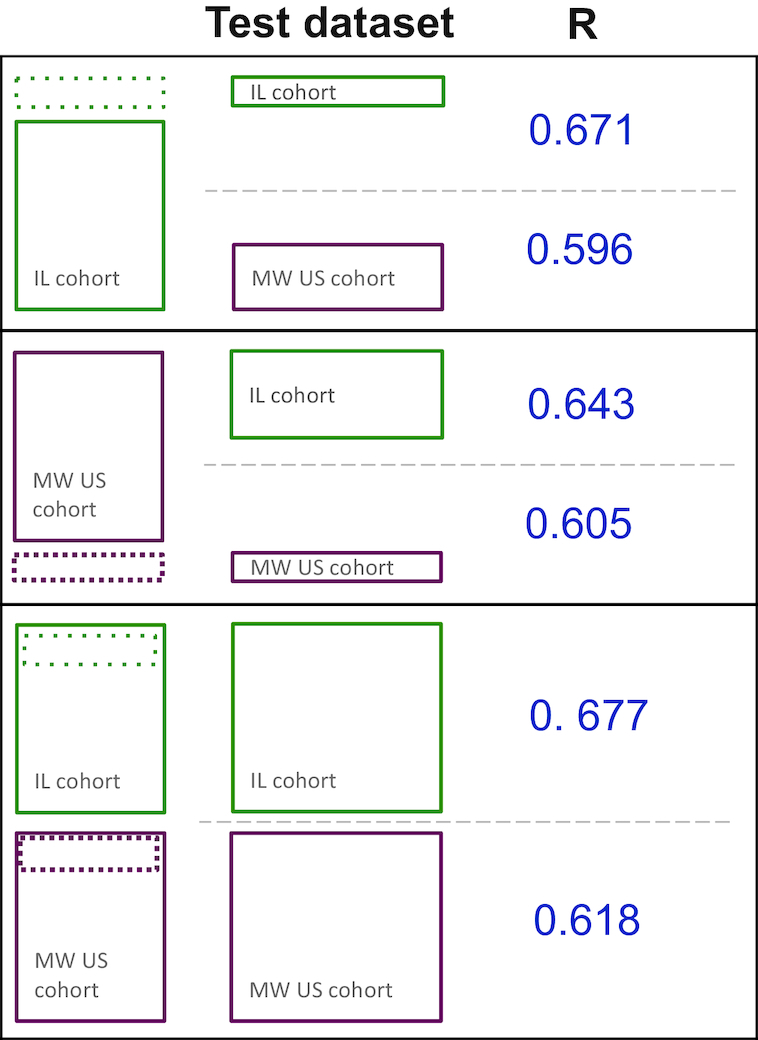
Results: When trained on the Israeli cohort meals only, model performance for predicting responses of individuals in the Midwestern cohort was better (R = 0.596) than that observed for models taking into consideration the carbohydrate (R = 0.395) or calorie content of the meals alone (R = 0.336). Performance increased (R = 0.618) when the model was trained on meals from both cohorts, likely because of the observed differences in age distribution, diet, and microbiome.
Conclusions: We show that the modeling framework described in Zeevi et al. for an Israeli cohort is applicable to a Midwestern population, and outperforms commonly used approaches for the control of blood glucose responses. The adaptation of the model to the Midwestern cohort further enhances performance and is a promising means for designing effective nutritional interventions to control glycemic responses to foods. This trial was registered at clinicaltrials.gov as NCT02945514.
Keywords: carbohydrate content; continuous glucose monitors; diabetes; glycemic response; microbiome; personalized nutrition.
Copyright © American Society for Nutrition 2019.
Figures
References
-
- Brand-Miller JC. Glycemic load and chronic disease. Nutrition Reviews. 2003;61(5):S49–55. - PubMed
-
- de Vegt F, Dekker JM, Ruhe HG, Stehouwer CD, Nijpels G, Bouter LM, Heine RJ. Hyperglycaemia is associated with all-cause and cardiovascular mortality in the Hoorn population: the Hoorn study. Diabetologia. 1999;42:926–31. - PubMed
-
- Glucose tolerance and mortality: comparison of WHO and American Diabetic Association diagnostic criteria. The Lancet. 1999;354(9179):617–21. - PubMed
-
- American Diabetes Association. Postprandial blood glucose. Diabet Care. 2001;24(4):775–7. - PubMed
-
- Bantle JP, Wylie-Rosett J, Albright AL, Apovian CM, Clark NG, Franz MJ, Hoogwerf BJ, Lichtenstein AH, Mayer-Davis E, Mooradian ADAmerican Diabetes Association, et al., American Diabetes Association Nutrition recommendations and interventions for diabetes: a position statement of the American Diabetes Association. Diabetes Care. 2008;31(Suppl 1):S61–78. - PubMed
Publication types
MeSH terms
Substances
Associated data
Grants and funding
LinkOut - more resources
Full Text Sources
Other Literature Sources
Medical
