

doi: 10.1109/TCBB.2019.2917204.
Epub 2020 Dec 8.
Topological Metrizations of Trees, and New Quartet Methods of Tree Inference
- PMID: 31095496
- PMCID: PMC7650847
- DOI: 10.1109/TCBB.2019.2917204
Item in Clipboard
Topological Metrizations of Trees, and New Quartet Methods of Tree Inference
IEEE/ACM Trans Comput Biol Bioinform.
2020 Nov-Dec.
Abstract
Topological phylogenetic trees can be assigned edge weights in several natural ways, highlighting different aspects of the tree. Here, the rooted triple and quartet metrizations are introduced, and applied to formulate novel methods of inferring large trees from rooted triple and quartet data. These methods lead to new statistically consistent procedures for inference of a species tree from gene trees under the multispecies coalescent model.
Figures
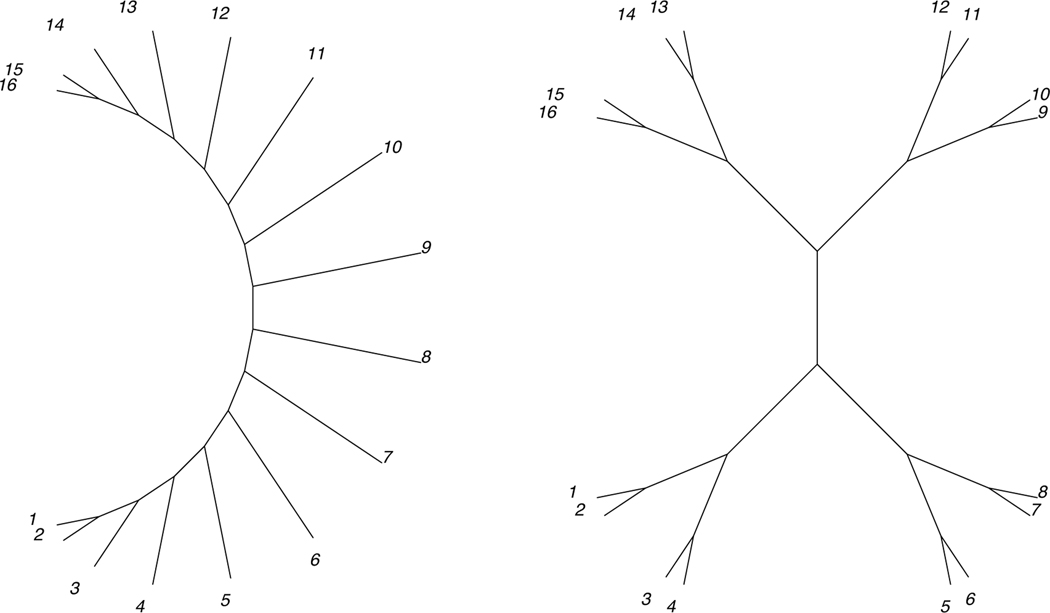
16-taxon caterpillar and balanced trees, with edge lengths given by the quartet metrization
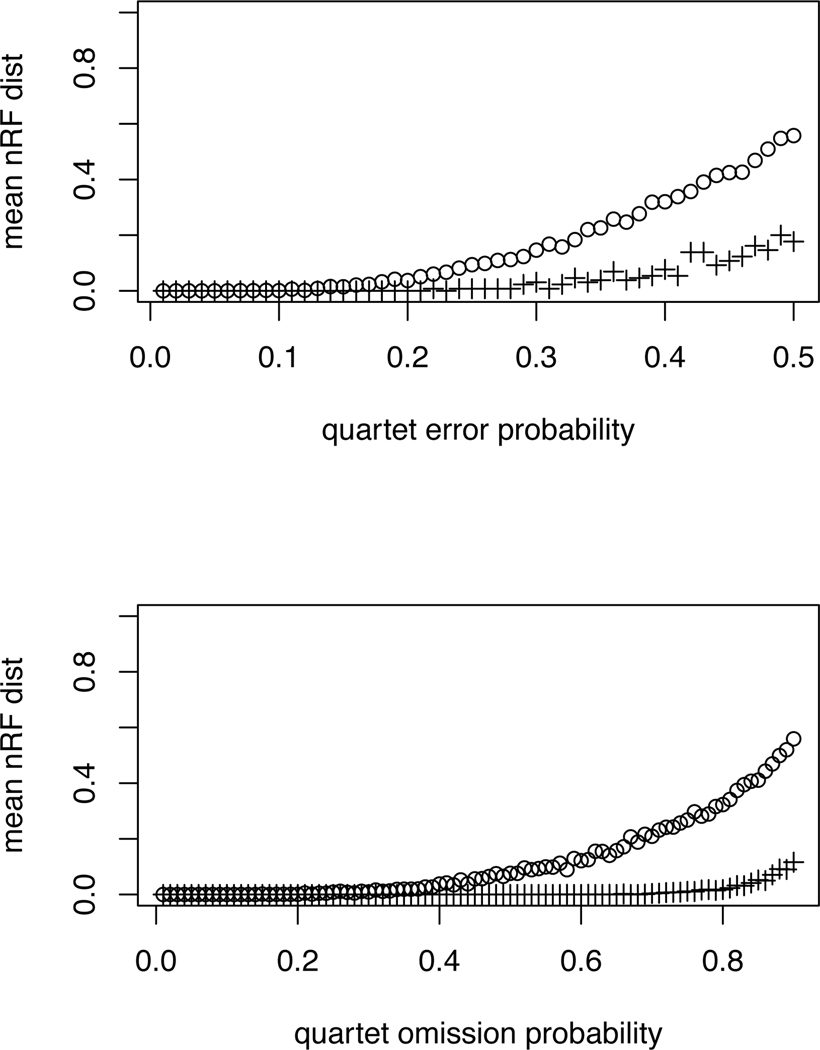
Performance of QDS/NJ in simulation under under two scenarios, erroneous quartets (top) and omitted quartets (bottom), as described in the text. Circles (○) denote the 16-taxon caterpillar tree and pluses (+) the 16-taxon balanced tree. The horizontal axes on the top plot gives the probability that a true quartet is replaced with an alternative on the same taxa in forming the quartet set. On the bottom plot, that axis gives the probability a quartet is omitted from the quartet set. Inference error is measured by the normalized Robinson-Foulds (nRF) distance between the correct and inferred tree. The vertical axes show the mean nRF distance over 100 replicates. Note that two resolved 16 taxon trees differing by one NNI have nRF distance 2/2(16 − 3) ≈ 0.077.
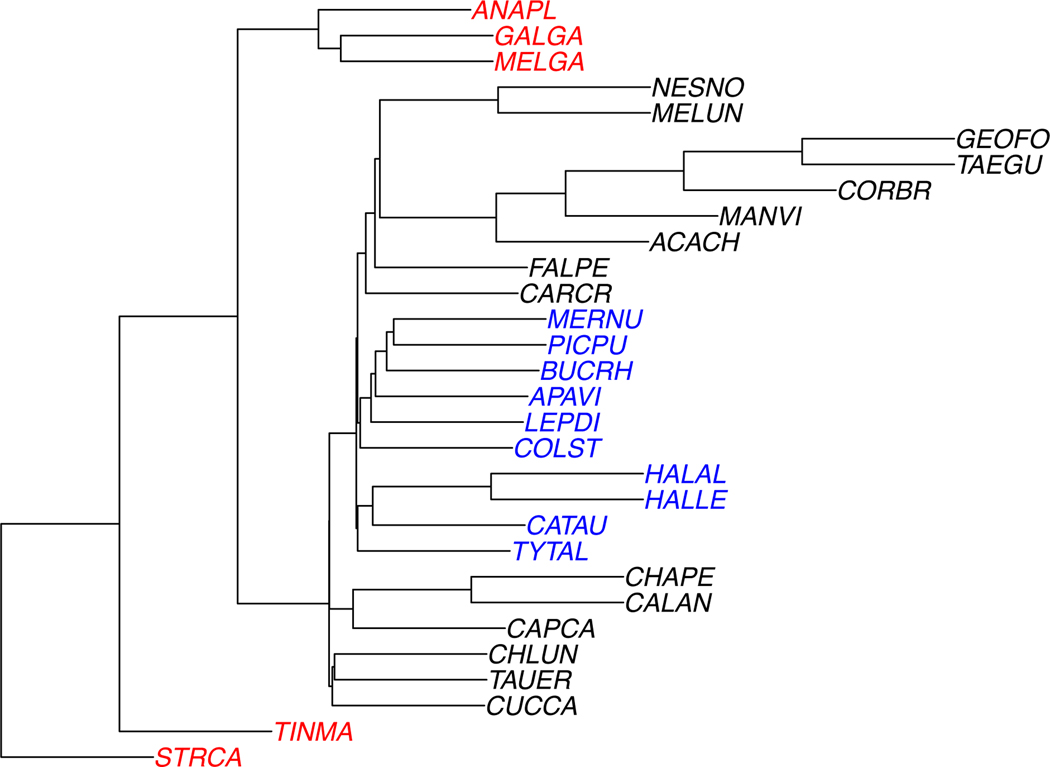
The 30-taxon species tree used for simulations. For trials involving missing taxa, a deletion probability p was chosen, and a group of taxa deleted with probability 2p from each gene tree. The deleted group was the taxa shown in red (anapl, galga, melga, tinma, strca) or blue (mernu, picpu, bucrh, apavi, lepdi, colst, halal, halle, catau, tytal), with equal probability. Thus the the expected proportion of gene trees on all taxa is 1 − 2p, on the the black and blue taxa is p, and on the black and red is p.
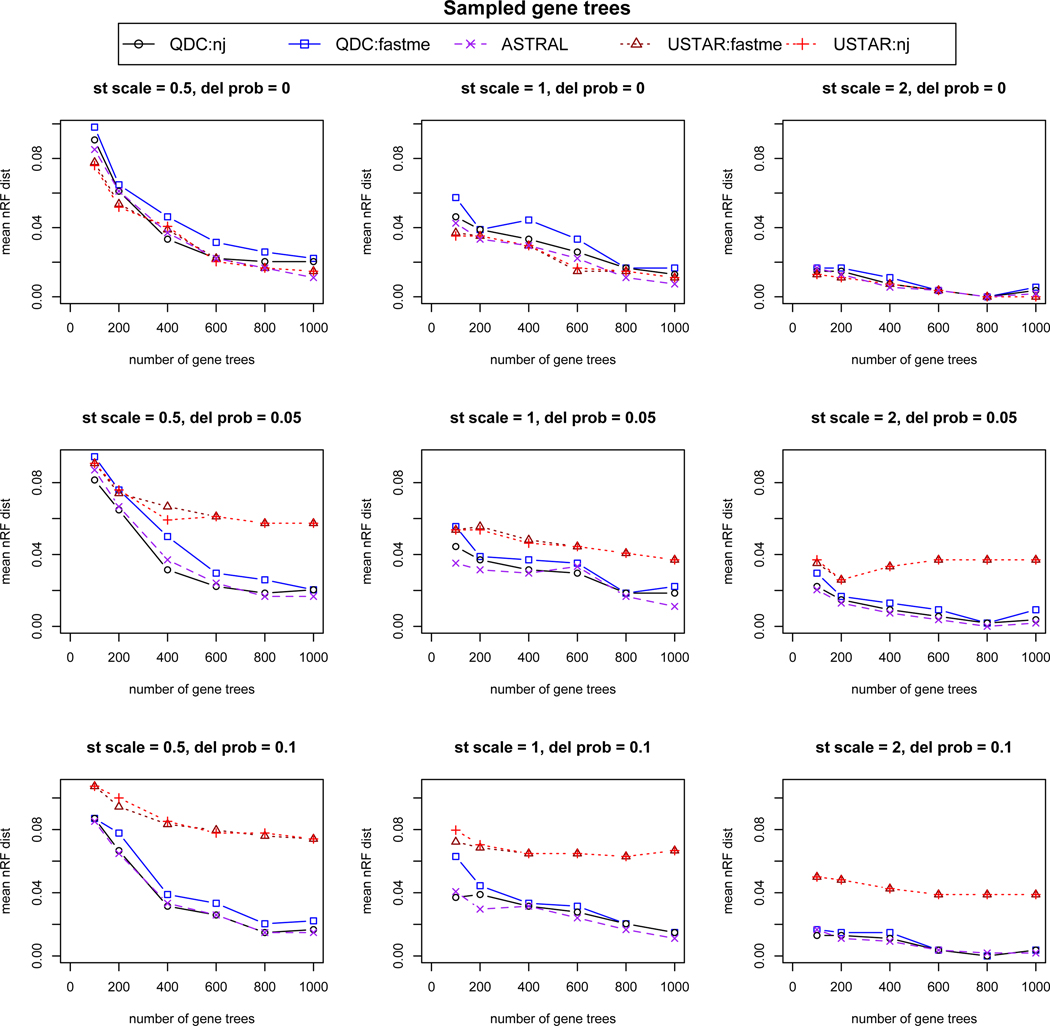
Simulation results based on 20 replicates for each simulation condition, using gene trees sampled from the multispecies coalescent model (lacking estimation error). From left to right, “st scale” is the species tree scaling factor of .5,1, or 2, indicating decreasing amounts of ILS. From top to bottom,“del prob” controls the probability of missing taxa on gene trees, with values 0, .05, or .1 indicating increasing numbers of gene trees with missing taxa. On individual plots, increasing numbers of gene trees, 100, 200, 400, 600, 800, and 1000, were analyzed for species tree inference. The mean over the replicates of the normalized Robinson-Foulds (nRF) distance from the species tree is used to measure accuracy. For 30 taxa, 2 trees differing by a single NNI move have nRF = 2/2(30 − 3) ≈ 0.037.
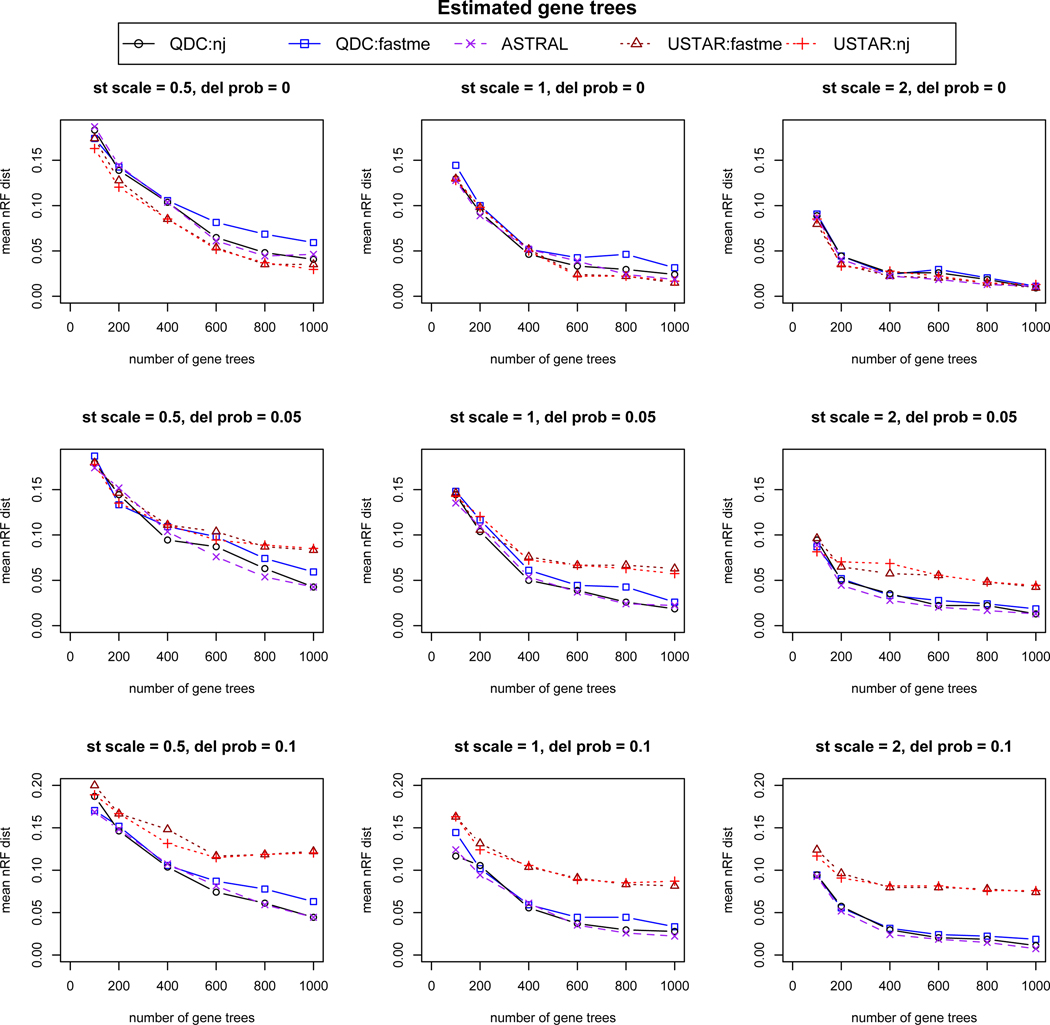
Simulation results based on 20 replicates for each simulation condition, using gene trees estimated from sequences simulated on gene trees sampled from the multispecies coalescent model. From left to right, “st scale” is the species tree scaling factor of .5, 1, or 2, indicating decreasing amounts of ILS. From top to bottom,“del prob” controls the probability of missing taxa on gene trees, with values 0, .05, or .1 indicating increasing numbers of gene trees with missing taxa. On individual plots, increasing numbers of gene trees, 100, 200, 400, 600, 800, and 1000, were analyzed for species tree inference. The mean over the replicates of the normalized Robinson-Foulds (nRF) distance from the species tree is used to measure accuracy. For 30 taxa, 2 trees differing by a single NNI move have nRF = 2/2(30 − 3) ≈ 0.037.
References
-
- Allman ES, Degnan JH, and Rhodes JA Identifying the rooted species tree from the distribution of unrooted gene trees under the coalescent. J. Math. Biol, 62(6):833–862, 2011. - PubMed
-
- Allman ES, Degnan JH, and Rhodes JA Species tree inference by the STAR method, and generalizations. J. Comput. Biol, 20(1):50–61, 2013. - PubMed
-
- Anvi E, Cohen R, and Snir S Weighted quartets phylogenetics. Syst. Biol, 64(2):233–242, 2015. - PubMed
-
- Bandelt H-J and Dress A Reconstructing the shape of a tree from observed dissimilarity data. Adv. Appl. Math, 7:309–343, 1986.
