

Evolution of major histocompatibility complex gene copy number
- PMID: 31095555
- PMCID: PMC6541284
- DOI: 10.1371/journal.pcbi.1007015
Evolution of major histocompatibility complex gene copy number
Abstract
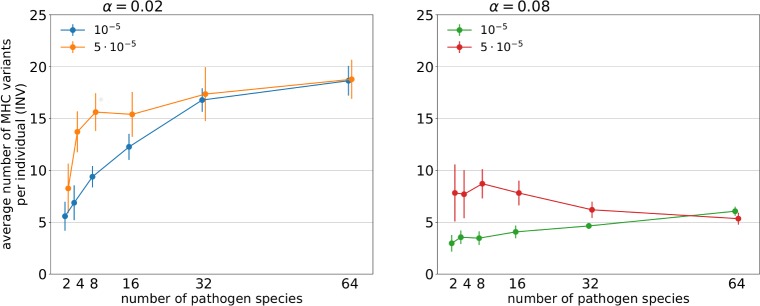
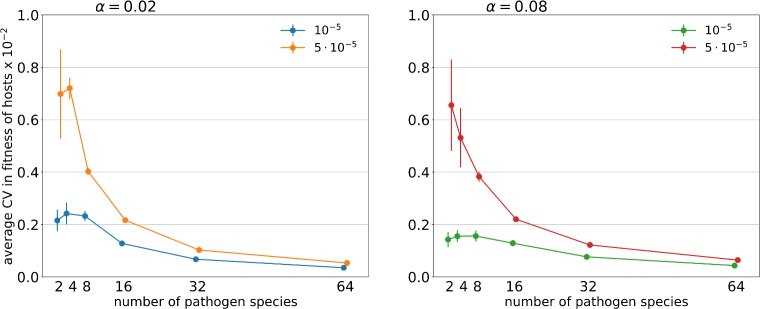
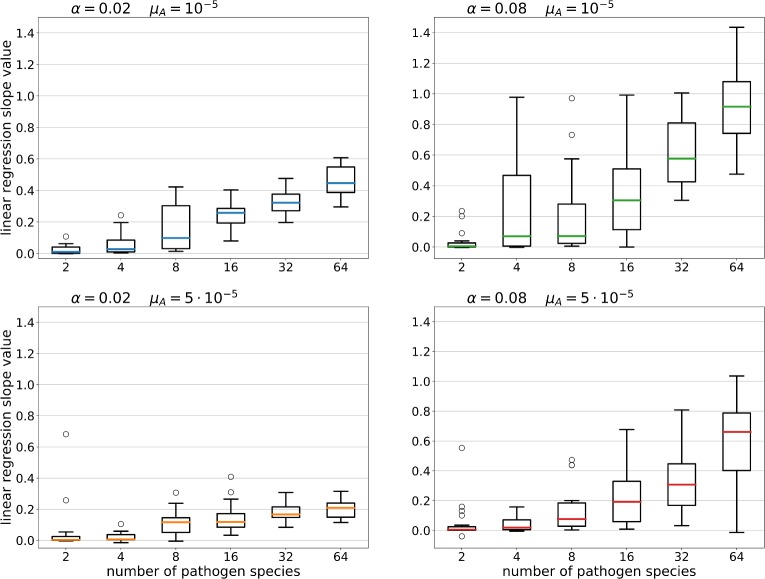
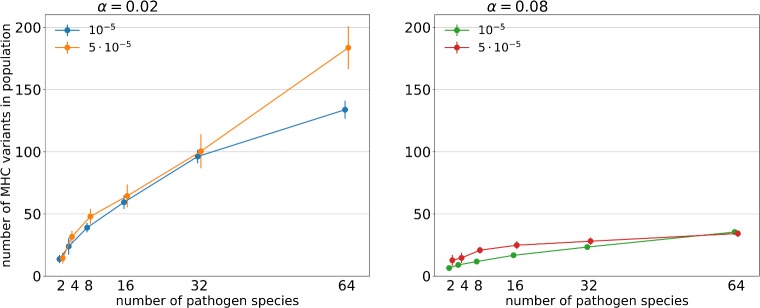
MHC genes, which code for proteins responsible for presenting pathogen-derived antigens to the host immune system, show remarkable copy-number variation both between and within species. However, the evolutionary forces driving this variation are poorly understood. Here, we use computer simulations to investigate whether evolution of the number of MHC variants in the genome can be shaped by the number of pathogen species the host population encounters (pathogen richness). Our model assumed that while increasing a range of pathogens recognised, expressing additional MHC variants also incurs costs such as an increased risk of autoimmunity. We found that pathogen richness selected for high MHC copy number only when the costs were low. Furthermore, the shape of the association was modified by the rate of pathogen evolution, with faster pathogen mutation rates selecting for increased host MHC copy number, but only when pathogen richness was low to moderate. Thus, taking into account factors other than pathogen richness may help explain wide variation between vertebrate species in the number of MHC genes. Within population, variation in the number of unique MHC variants carried by individuals (INV) was observed under most parameter combinations, except at low pathogen richness. This variance gave rise to positive correlations between INV and host immunocompetence (proportion of pathogens recognised). However, within-population variation in host immunocompetence declined with pathogen richness. Thus, counterintuitively, pathogens can contribute more to genetic variance for host fitness in species exposed to fewer pathogen species, with consequences to predictions from "Hamilton-Zuk" theory of sexual selection.
Conflict of interest statement
The authors have declared that no competing interests exist.
Figures
References
-
- Garrigan D, Hedrick PW. Perspective: Detecting adaptive molecular polymorphism, lessons from the MHC. Evolution. 2003;57:1707–22. WOS:000185599701200. - PubMed
-
- Bernatchez L, Landry C. MHC studies in nonmodel vertebrates: what have we learned about natural selection in 15 years? Journal of Evolutionary Biology. 2003;16(3):363–77. 150. - PubMed
-
- Bodmer W. Evolutionary significance of the HL-A system. Nature. 1972;237:139–45. - PubMed
-
- Doherty PC, Zinkernagel RM. Enhanced immunological surveillance in mice heterozygous at H-2 gene complex. Nature. 1975;256(5512):50–2. 3. - PubMed
Publication types
MeSH terms
LinkOut - more resources
Full Text Sources
Other Literature Sources
Research Materials
