. 2019 May 16;17(5):e3000250.
doi: 10.1371/journal.pbio.3000250. eCollection 2019 May.

Resistance diagnostics as a public health tool to combat antibiotic resistance: A model-based evaluation

Affiliations

Resistance diagnostics as a public health tool to combat antibiotic resistance: A model-based evaluation

David McAdams et al. PLoS Biol. .

Abstract

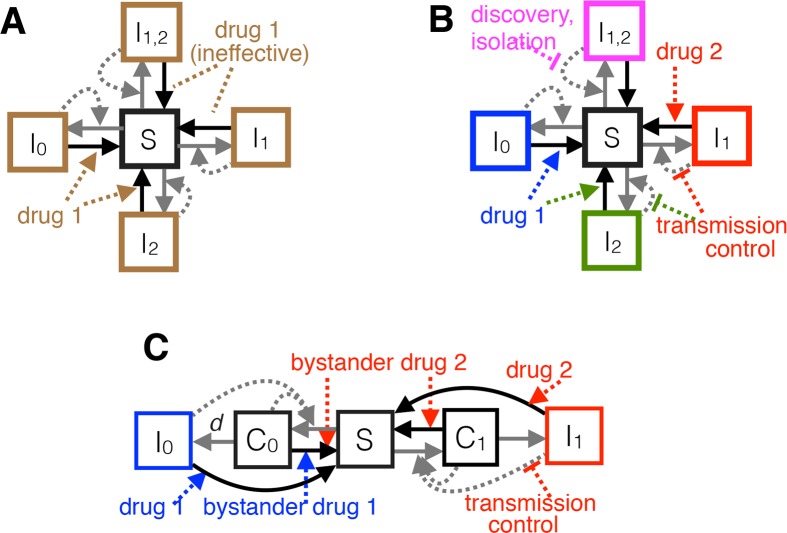
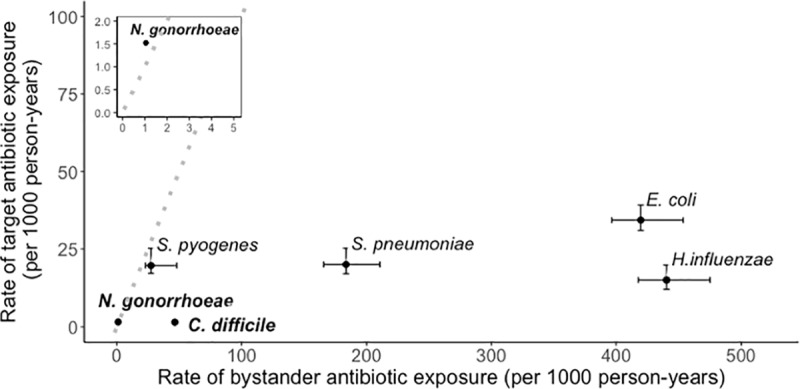
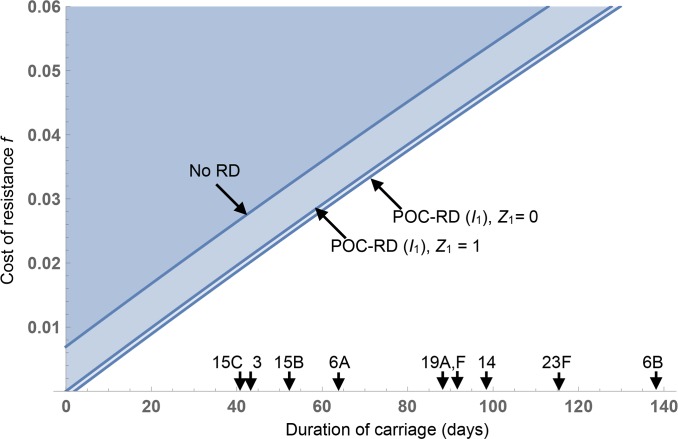
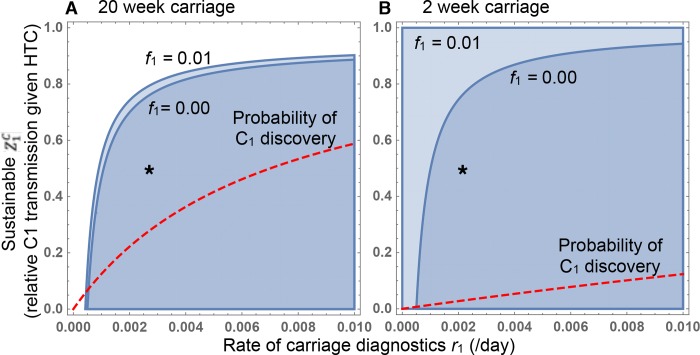
Rapid point-of-care resistance diagnostics (POC-RD) are a key tool in the fight against antibiotic resistance. By tailoring drug choice to infection genotype, doctors can improve treatment efficacy while limiting costs of inappropriate antibiotic prescription. Here, we combine epidemiological theory and data to assess the potential of resistance diagnostics (RD) innovations in a public health context, as a means to limit or even reverse selection for antibiotic resistance. POC-RD can be used to impose a nonbiological fitness cost on resistant strains by enabling diagnostic-informed treatment and targeted interventions that reduce resistant strains' opportunities for transmission. We assess this diagnostic-imposed fitness cost in the context of a spectrum of bacterial population biologies and find that POC-RD have a greater potential against obligate pathogens than opportunistic pathogens already subject to selection under "bystander" antibiotic exposure during asymptomatic carriage (e.g., the pneumococcus). We close by generalizing the notion of RD-informed strategies to incorporate carriage surveillance information and illustrate that coupling transmission-control interventions to the discovery of resistant strains in carriage can potentially select against resistance in a broad range of opportunistic pathogens.


Conflict of interest statement

The authors have declared that no competing interests exist.

Figures

Fig 1
Fig 1
Schematic of the obligate/SIS (A, B) and opportunistic/SCIS (C) epidemiological models. Boxes denote proportions of hosts in mutually exclusive states: S for uninfected (susceptible) hosts, I0 for hosts infected with a strain sensitive to both drugs, and I1, I2, and I12 for hosts infected with strains resistant to drugs 1, 2, or both 1 and 2, respectively. In the SCIS model (C, showing only 2 pathogen genotypes for clarity), C0 and C1 denote asymptomatic carriage of sensitive and drug 1–resistant bacteria, respectively, and d is the rate at which disease develops from carriage (when d→∞, we recover an SIS model). Box colors denote distinct clinical presentations in the absence (A) or presence (B, C) of multidrug POC-RD. Solid arrows represent flows of individuals between states, and dashed arrows represent factors influencing those flows (e.g., antibiotic treatment). Gray and black arrows denote transmission and clearance, respectively. Equations describing the system are in S1B Text. POC-RD, point-of-care resistance diagnostics; SCIS, Susceptible-Carriage-Infected-Susceptible; SIS, Susceptible-Infected-Susceptible.
Fig 2
Fig 2. Rapid RD enable conditional treatment and infection control strategies that can select against resistance for obligate pathogens even with no biological costs of resistance.
The minimal cost of resistance f*(D) that allows universal treatment without causing an increase in resistance is plotted (contour lines) against diagnostic delay D. The dashed vertical line indicates the longest diagnostic delay (D*) given which there is selection against drug 1 resistance while treating all cases. Three scenarios are shown: RD not available (No RD, contour plot of f1*()=f12*()); RD control of I1 only (RD (I1), contour plot of f1*(D)); and RD control of I12 (and trivially, I1) (RD (I12), contour plot of f12*(D)). Parameters (rates per day): γ0I=0.1, γ1I=γ2I=0.2,βI=0.2,Z1I=0.8, Z12I=0.8. RD, resistance diagnostics.
Fig 3
Fig 3. Incidental antibiotic exposure during asymptomatic carriage exceeds disease-related antibiotic exposure for key human pathogens.
Bold font: Tier 1 urgent resistance concerns according to the CDC [1]. Standard font: The most frequent etiologic agents of the top indications for antibiotic prescription in United States ambulatory care. “Target antibiotic exposure” is defined as any antibiotic use associated with disease caused by that organism; “bystander antibiotic exposure” refers to the incidence of antibiotic exposure in asymptomatic carriage, roughly calculated as the product of the incidence of antibiotic prescription in ambulatory care and the proportion of the population in the relevant age group that carries the bacterium minus the number of target antibiotic exposures. The dotted line is where incidence of antibiotic exposure in carriage is equal to incidence of antibiotic exposure due to disease. See Tedijanto and colleagues [31] for method details, source references, and an alternate visualization of the same data on Neisseria gonorrhoeae, Streptococcus pyogenes, S. pneumoniae, Escherichia coli, and Haemophilus influenzae. Values for Clostridioides difficile were calculated using the same methodology and additional sources for disease incidence [33] and carriage prevalence [34]; see S1F Text for details. CDC, Centers for Disease Control and Prevention.
Fig 4
Fig 4. POC-RD alone cannot reverse selection on cost-free pneumococcal resistance.
The minimal cost of resistance (f1*) that allows universal treatment without causing an increase in strain 1 resistance is plotted (contour lines) against the expected duration of carriage. Two POC-RD scenarios are shown: with (Z1I=0) and without (Z1I=1) transmission control. Arrows on the x axis are serotype-specific mean carriage duration estimates from [35] (serotypes with ≥15 recorded carriage episodes only). The remaining parameters (rates per day) are d = 0.001, ϕ1C = 5 × 10⁻⁴, ϕ2C = 0, γ1I=γ2I = 1, γ0I = 0.125. We make the simplifying assumption that baseline carriage and infection transmission rates are identical (βC = βI = β) which ensures that f1* does not depend on β. Details on parameterization are in S1G Text. POC-RD, point-of-care resistance diagnostics.
Fig 5
Fig 5. POC-RD plus carriage RD can reverse selection on pneumococcal resistance, even for long–carriage-duration serotypes.
The parameter space generating net selection against resistance is plotted in blue as a function of the rate of carriage discovery (r1) and the effectiveness of carriage HTC (Z1C). (A) Longest–carriage-duration serotype (6B, median 20 weeks). (B) Shortest–carriage-duration serotypes (1, 4, 5; approximately 2 weeks). In both (A) and (B), 2 POC-RD scenarios are shown: with (f = 0.01) and without (f = 0) biological cost of resistance. The red dashed line represents the probability of strain 1 discovery while in the carriage state (“C1 discovery”), an increasing function of the rate of carriage diagnosis. The remaining parameters (rates per day) are d = 0.001, ϕ1C = 5 × 10⁻⁴, ϕ2C = 0, γ1I=γ2I = 1, γ0I = 0.125, γC = 0.006 (A), γC = 0.07 (B). We make the simplifying assumption that baseline carriage and infection transmission rates are identical (βI = βC = β), which ensures that the parameter space generating net selection against resistance does not depend on β. Details on parameterization are in S1G Text. The asterisk positions the outcome of an annual intervention with 50% efficacy in reducing C1 transmission. HTC, heightened transmission control; POC-RD, point-of-care resistance diagnostics.

References

    1. Centers for Disease Control and Prevention. Antibiotic resistance threats in the United States, 2013. U.S. Department of Health and Human Services, Centers for Disease Control and Prevention; 2013.
    1. Laxminarayan R, Duse A, Wattal C, Zaidi AKM, Wertheim HFL, Sumpradit N, et al. Antibiotic resistance—the need for global solutions. Lancet Infect Dis. 2013. December;13:1057–98. 10.1016/S1473-3099(13)70318-9 - DOI - PubMed
    1. Center for Disease Dynamics Economics & Policy. The state of the world’s antibiotics 2015. Washington, D.C.: The Center; 2015.
    1. World Health Organization. Antimicrobial resistance Fact Sheet 194 [Internet]. Geneva: The Organization; 2014. April Available from: http://www.wpro.who.int/mediacentre/releases/2014/AMR_factsheet_FINAL.pdf. [cited 2019 Apr 3].
    1. European Centre for Disease Prevention and Control. Antimicrobial resistance surveillance in Europe 2014. Solna (Sweden): The Centre; 2015.

Publication types