. 2019 May 16;14(5):e0216539.
doi: 10.1371/journal.pone.0216539. eCollection 2019.

Whole blood transcriptomic profiles can differentiate vulnerability to chronic low back pain

Affiliations

Whole blood transcriptomic profiles can differentiate vulnerability to chronic low back pain

Susan G Dorsey et al. PLoS One. .

Abstract

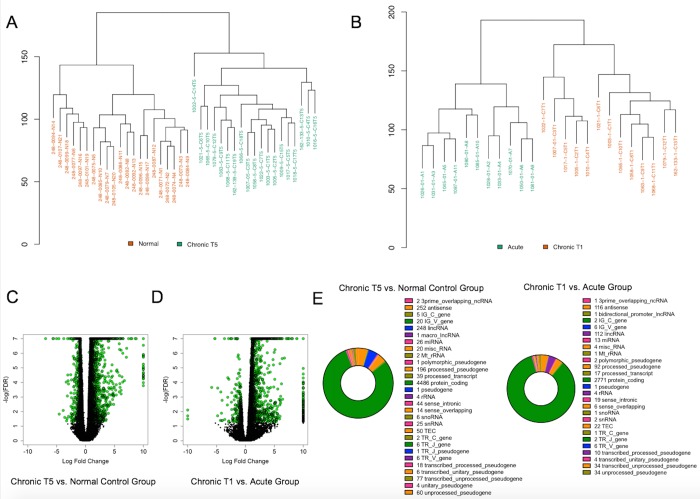
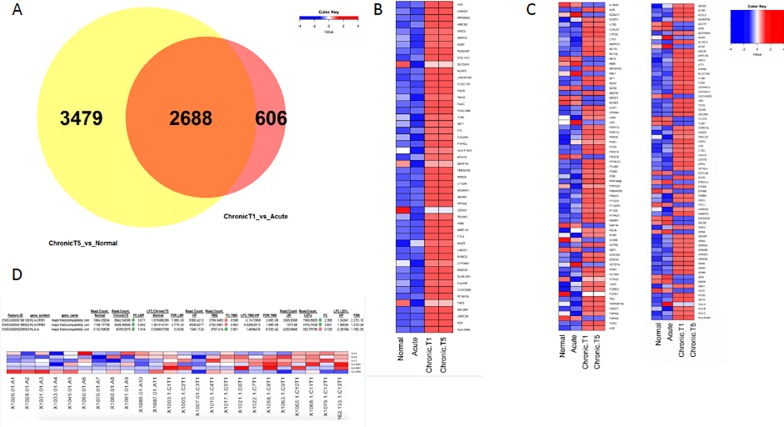
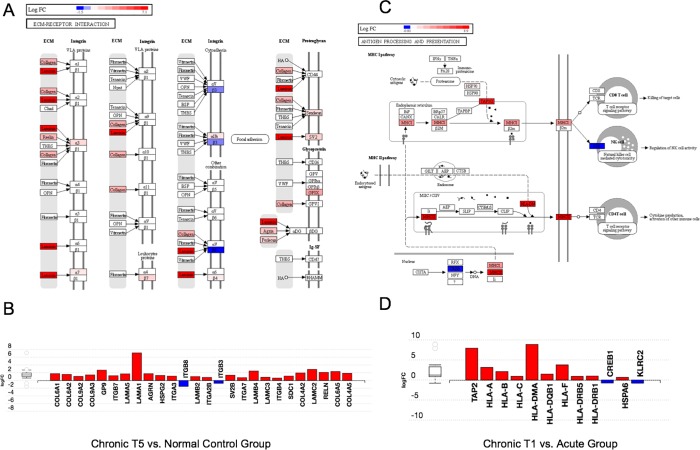
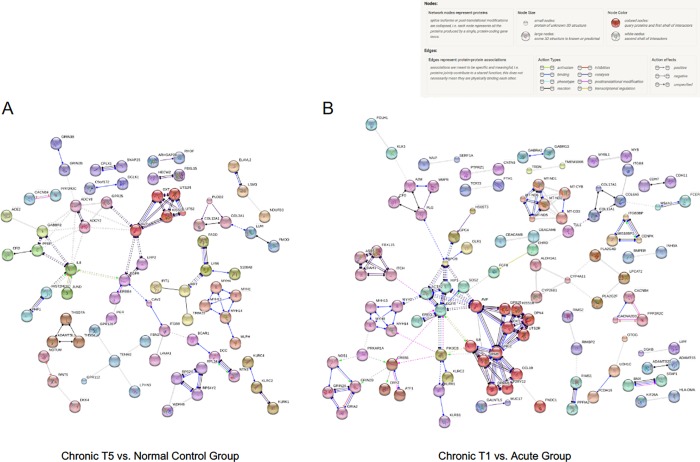
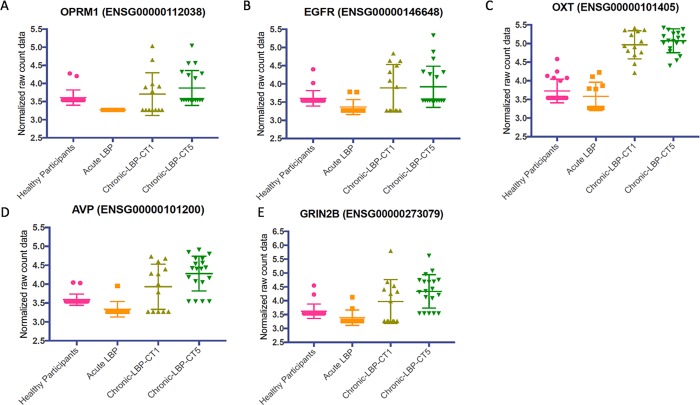
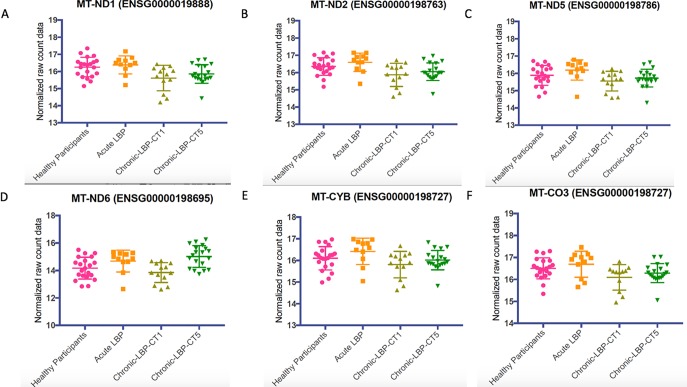
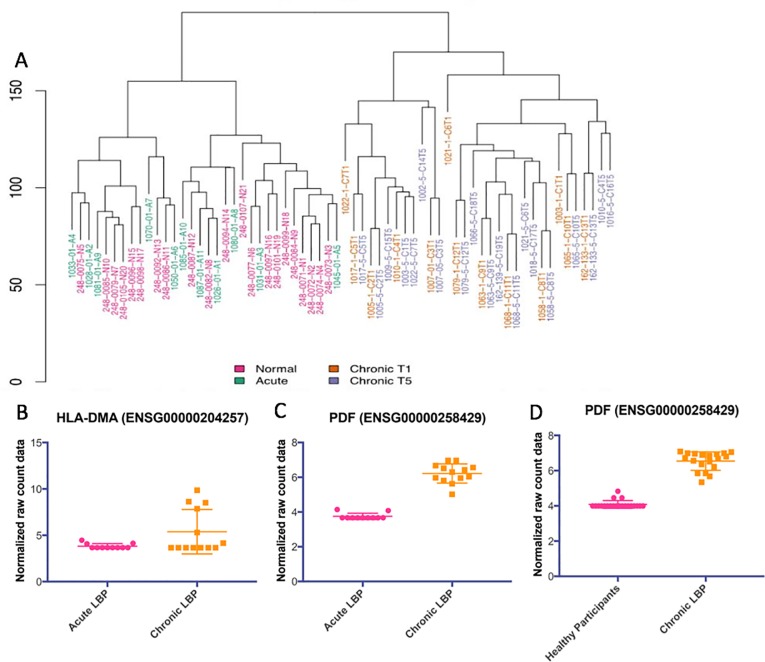
The mechanisms underlying the transition from acute to chronic pain remain unclear. Here, we sought to characterize the transcriptome associated with chronic low back pain as well as the transcriptome of the transition from acute to chronic low back pain. For the analysis, we compared the whole blood transcriptome of: (a) patients at the onset of low back pain who no longer had pain within 6 weeks after onset (acute) with patients who developed chronic low back pain at 6 months (chronic T5); and, (b) patients at the onset of low back pain (chronic T1) who developed chronic pain at 6 months with healthy pain-free (normal) controls. The majority of differentially expressed genes were protein coding. We illustrate a unique chronic low back pain transcriptome characterized by significant enrichment for known pain genes, extracellular matrix genes, and genes from the extended major histocompatibility complex (MHC) genomic locus. The transcriptome of the transition from acute to chronic low back pain was characterized by significant upregulation of antigen presentation pathway (MHC class I and II) genes and downregulation of mitochondrial genes associated with oxidative phosphorylation, suggesting a unique genomic signature of vulnerability to low back pain chronicity.


Conflict of interest statement

SGD, CLR, MG, and ARS have a patent pending (62/607,969 filed 12/20/17) on Biomarkers of Acute and Chronic Pain. The other authors declare no competing interests.

Figures

Fig 1
Fig 1. Characterization of differential gene expression in whole blood from the chronic T5 versus normal (healthy pain-free) group and in the chronic T1 and acute group.
(A) Euclidean clustering demonstrates separation between the chronic T5 group compared with the normal control group. (B) Euclidean clustering demonstrates separation between the acute and chronic T1 group. (C) Volcano plot showing log fold change (LFC) for significantly differentially expressed genes (LFC ±0.58; FDR p-value ≤ 0.05; N = 3,479 shown in green circles) in the chronic T5 versus normal group. (D) Volcano plot showing log fold change (LFC) for significantly differentially expressed genes (LFC ±0.58; FDR p-value ≤ 0.05; N = 3,288 shown in green circles) in the chronic T1 compared with the acute group. (E) Pie charts depicting protein-coding and non-coding gene types for chronic T5 versus normal group (left) and chronic T1 versus acute group (right).
Fig 2
Fig 2. Comparisons in differential gene expression among normal control (single timepoint) and cases (acute and chronic T1 and T5).
(A)Venn diagram showing that 2,688 differentially expressed genes (LFC ±0.58; FDR p-value ≤ 0.05) overlap between the two contrasts. (B) Heat map showing the top 50 up-regulated (left) and down-regulated (right) protein-coding genes in all four groups [healthy participants (normal), acute, chronic T1 and chronic T5]. Color key shows the z-score for downregulated genes (blue) and upregulated genes (red). (C) A one-tailed Fisher’s Exact test was used to compute a hypergeometric p-value to determine whether the differentially expressed genes from each contrast (chronic T5 versus normal control group and chronic T1 versus acute group) were significantly enriched for known pain genes (dataset constructed from multiple literature and online database sources (see supplemental methods for detail). The p-value for known pain genes = 1.26E-09 for the chronic T5 versus normal participants contrast, and p = 2.62E-08 for the chronic T1 versus acute contrast and for genes that form the extended MHC locus. The heatmap depicts known pain genes. Color key shows the z-score for downregulated genes (blue) and upregulated genes (red). (D) We computed the one-tailed Fisher’s Exact test to obtain a p-value for genes that reside in the extended MHC genomic locus (see supplemental methods for detail). The p-value for genes in the extended MHC genomic locus was only significant for the chronic T1 versus acute contrast (p = 1.43E-02).
Fig 3
Fig 3. Unbiased pathway analysis demonstrates significant enrichment for extracellular matrix genes in chronic T5 versus the normal control group and the antigen presentation pathway (MHC class I and II) genes in the chronic T1 patients compared with the acute group.
Using the Impact Analysis method in iPathway (Advaita Corporation), we conducted unbiased pathway analysis. Each pathway diagram is overlayed with the computed perturbation of each gene. The perturbation accounts both for the gene's measured fold change and for the accumulated perturbation propagated from any upstream genes (accumulation). The highest negative perturbation is shown in dark blue, while the highest positive perturbation is shown in dark red. The legend describes the values on the gradient in logFC. Note: For legibility, one gene may be represented in multiple places in the diagram and one box may represent multiple genes in the same gene family. A gene is highlighted in all locations it occurs in the diagram. For each gene family, the color corresponding to the gene with the highest absolute perturbation is displayed. (A) Top differentially regulated pathway in the chronic T5 versus normal group is extracellular matrix (ECM)-receptor interaction (KEGG: 04512; p = 0.005). (B) Bar graph of individual gene display for the ECM-receptor interaction pathway. The signed perturbation is represented with negative values in blue and positive values in red. The box and whisker plot on the left summarizes the distribution of all gene perturbations in this pathway. The box represents the 1st quartile, the median and the 3rd quartile, while circles represent the outliers. (C) Top differentially regulated pathway in the chronic T1 versus acute group is antigen processing and presentation (KEGG: 04612; p = 0.006). (D) Bar graph individual gene display for the antigen processing and presentation pathway. The signed perturbation is represented with negative values in blue and positive values in red. The box and whisker plot on the left summarizes the distribution of all gene perturbations in this pathway. The box represents the 1st quartile, the median and the 3rd quartile, while circles represent the outliers.
Fig 4
Fig 4. Protein-protein interaction network analysis demonstrates clusters of co-expressed genes.
Evidence for significant protein-protein interactions was demonstrated using STRING v10. For both contrasts (chronic T5 versus normal controls; chronic T1 versus acute), we analyzed the top 500 differentially expressed genes (250 upregulated, 250 downregulated). For the analysis, we specified high confidence (0.70) for cluster positions in the network as determined by an algorithm that computes a global confidence binding score. We next removed all disconnected nodes and then applied the Markov Cluster Algorithm (MCA) to extract clusters of densely connected nodes from biological networks. (A) String v10 analysis of gene expression analysis from chronic T5 compared with normal controls. Of the top 500 differentially expressed genes, 327 were identified in the database. The final network is comprised of 327 nodes and 150 edges. The random number of edges is 92. The protein-protein interaction (PPI) enrichment p-value = 1.88E-08. (B) String v10 analysis of gene expression in chronic T1 compared with the acute group. Of the top 500 differentially expressed genes, 263 were identified in the database. The final network is comprised of 263 nodes and 84 edges. The expected number of edges is 64. The PPI enrichment p-value = 0.0107.
Fig 5
Fig 5. The whole blood gene expression levels for known or suspected pain genes that were members of major clusters from String 10 protein-protein interaction analysis were plotted.
The analysis demonstrates that levels of each gene are differentially higher in the chronic T1/chronic T5 patients compared with acute and normal control participants. In each panel, the raw, normalized, non-zero gene expression counts from DESeq analysis are displayed as a scatter plot for each cohort. Symbols indicate individual expression levels for each of the N = 64 participants. A Kruskal-Wallis 1-way ANOVA was used to examine comparisons. In all cases, the expression levels for each gene were higher in the chronic T1 and chronic T5 groups compared with normal control participants and the acute group. (A) Opioid receptor mu 1 (OPRM1) gene (H = 27.64, p< 0.0001). (B) Epidermal growth factor receptor (EGFR) gene (H = 15.29, p = 0.0016). (C) Oxytocin (OXT) gene (H = 47.43, p<0.0001). (D) Arginine vasopressin (AVP) gene (H = 31.44, p<0.0001). (E) Glutamate ionotropic receptor NMDA type subunit 2B (GRIN2B) gene (H = 24.25, p<0.0001).
Fig 6
Fig 6. The whole blood gene expression levels for a cluster of mitochondrial genes associated with oxidative phosphorylation from String 10 protein-protein interaction analysis were plotted.
Results demonstrate that levels of each gene are differentially lower in the chronic T1 compared with the acute and normal participants. In each panel, the raw, normalized, non-zero gene expression counts from DESeq analysis are displayed as a scatter plot for each cohort. Symbols indicate individual expression levels for each of the N = 64 samples. A Kruskal-Wallis 1-way ANOVA was used to examine comparisons. In all cases except MT-CYB, the expression levels were statistically significantly lower in chronic T1 patients. (A) Mitochondrial encoded NADH dehydrogenase 1 (MT-ND1) gene (H = 12.29, p = 0.0064. (B) NADH dehydrogenase 2 (MT-ND2) gene (H = 12.05, p = 0.0072). (C) NADH dehydrogenase 5 (MT-ND5) gene (H = 10.22, p = 0.0168). (D) NADH dehydrogenase 6 (MT-ND6) gene (H = 17.03, p = 0.0007). (E) Cytochrome B (MT-CYB) gene (H = 7.333, p = 0.0620). (F) Cytochrome C oxidase III (MT-CO3) gene (H = 8.146, p = 0.0431).
Fig 7
Fig 7. Characterization of differential gene expression in whole blood over the transition from acute to chronic low back pain.
(A) Euclidean clustering demonstrates separation between normal control/acute group and chronic T1/T5. (B and C) HLA-DMA and PDF were the top 2 differentially expressed genes between the acute group and chronic T1 group. (D) PDF was significantly differentially expressed between normal controls and the chronic T5 group.

References

    1. Hoy D, March L, Brooks P, Blyth F, Woolf A, Bain C, et al. The global burden of low back pain: estimates from the Global Burden of Disease 2010 study. Ann Rheum Dis. 2014;73:968–974. 10.1136/annrheumdis-2013-204428 - DOI - PubMed
    1. Axén I, Leboeuf-Yde C. Trajectories of low back pain. Best Pract Res Clin Rheumatol. 2013;27:601–612. 10.1016/j.berh.2013.10.004 - DOI - PubMed
    1. Buchbinder R, Blyth FM, March LM, Brooks P, Woolf AD, Hoy DG. Placing the global burden of low back pain in context. Best Pract Res Clin Rheumatol. 2013;27: 575–589. 10.1016/j.berh.2013.10.007 - DOI - PubMed
    1. Ramond-Roquin A, Pecquenard F, Schers H, Van Weel C, Oskam S, Van Boven K. Psychosocial, musculoskeletal and somatoform comorbidity in patients with chronic low back pain: Original results from the Dutch Transition Project. Fam Pract. 2015;32:297–304. 10.1093/fampra/cmv027 - DOI - PubMed
    1. Hoy DG, Smith E, Cross M, Sanchez-Riera L, Buchbinder R, Blyth FM, et al. The global burden of musculoskeletal conditions for 2010: an overview of methods. Ann Rheum Dis. 2014;73:982–989. 10.1136/annrheumdis-2013-204344 - DOI - PubMed

Publication types

Substances