. 2019 Jul 1;16(7):3024-3039.
doi: 10.1021/acs.molpharmaceut.9b00263. Epub 2019 May 30.

Berunda Polypeptides: Biheaded Rapamycin Carriers for Subcutaneous Treatment of Autoimmune Dry Eye Disease

Affiliations

Berunda Polypeptides: Biheaded Rapamycin Carriers for Subcutaneous Treatment of Autoimmune Dry Eye Disease

Changrim Lee et al. Mol Pharm. .

Abstract

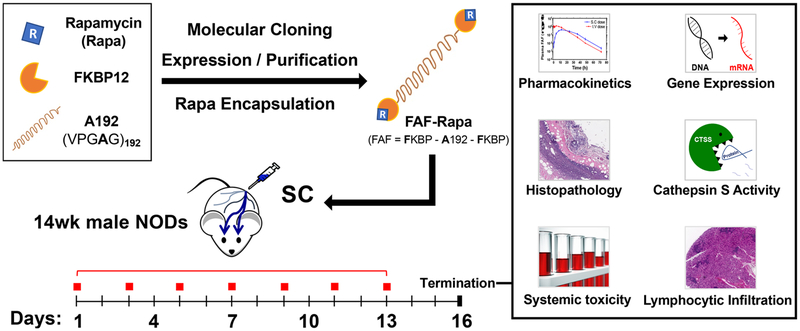
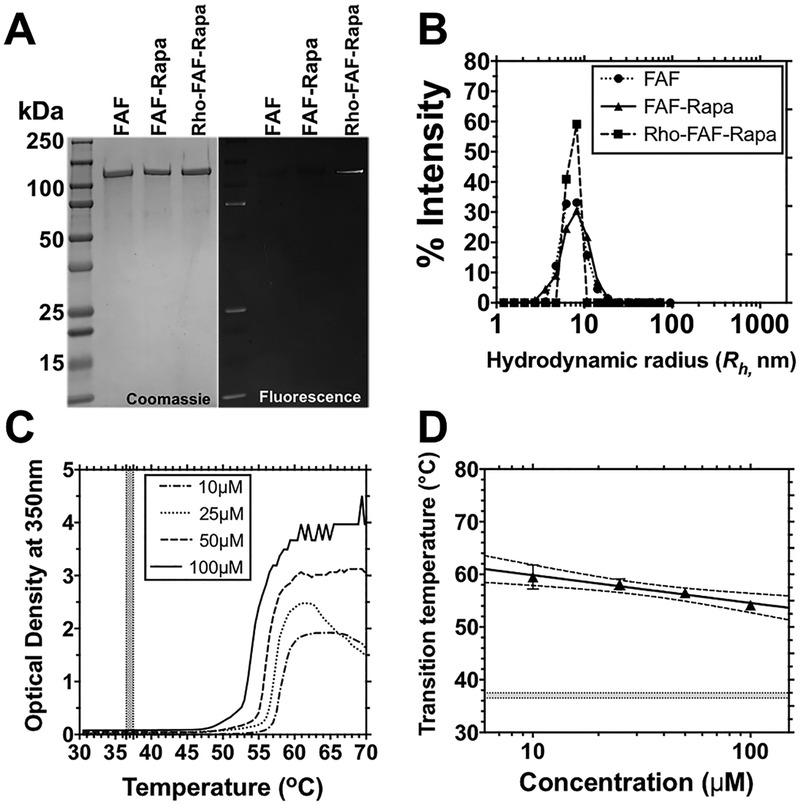
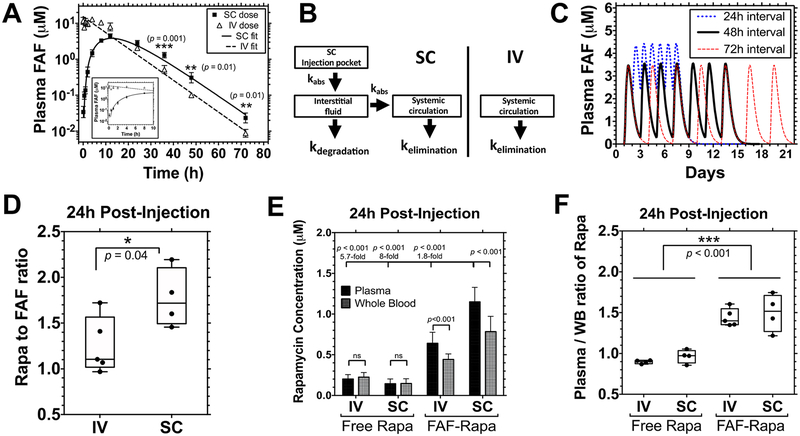
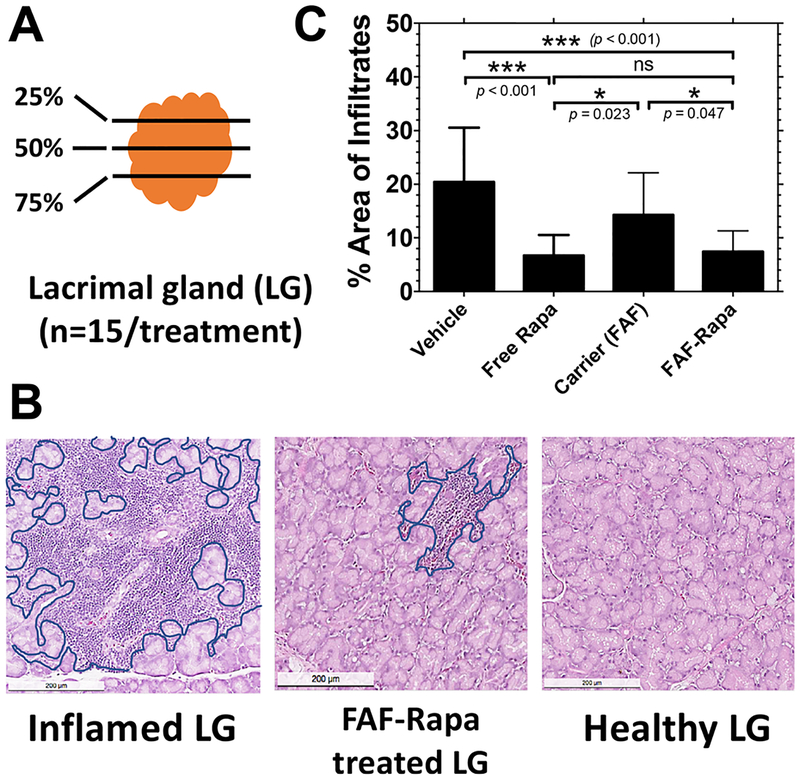
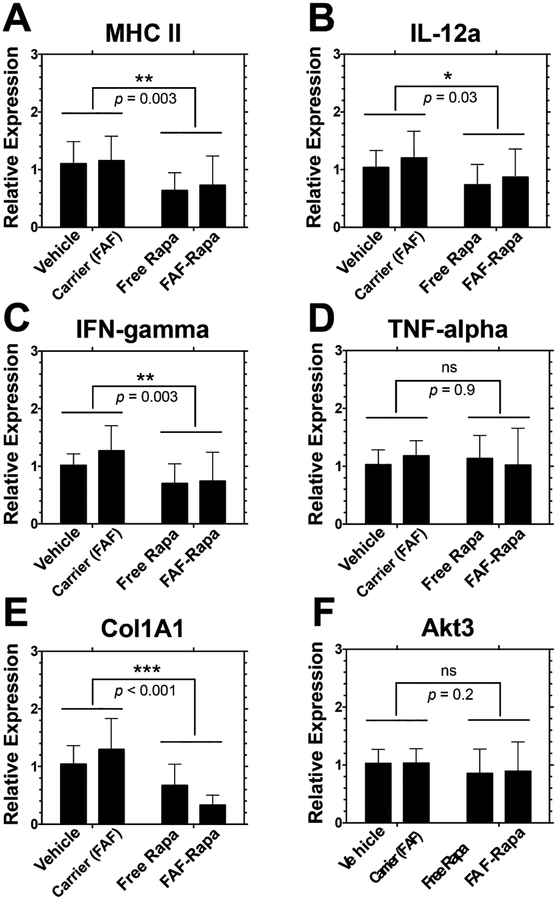
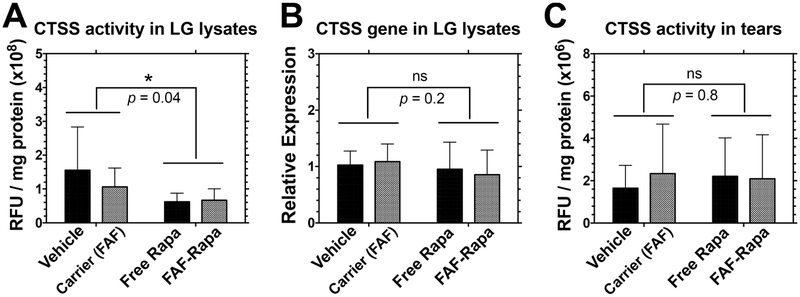
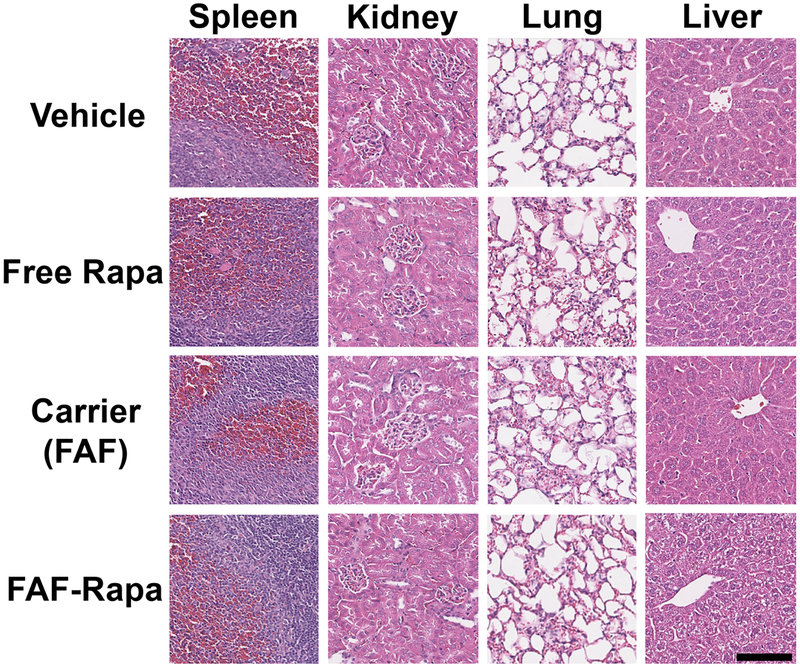
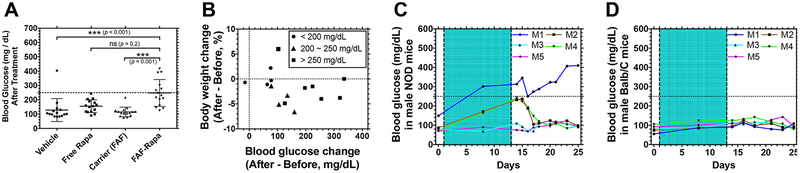
The USFDA-approved immunosuppressive drug rapamycin (Rapa), despite its potency, is limited by poor bioavailability and a narrow therapeutic index. In this study, we sought to improve bioavailability of Rapa with subcutaneous (SC) administration and to test its therapeutic feasibility and practicality in a murine model of Sjögren's syndrome (SS), a systemic autoimmune disease with no approved therapies. To improve its therapeutic index, we formulated Rapa with a carrier termed FAF, a fusion of the human cytosolic FK506-binding protein 12 (FKBP12) and an elastin-like polypeptide (ELP). The resulting 97 kDa FAF (i) has minimal burst release, (ii) is "humanized", (iii) is biodegradable, (iv) solubilizes two Rapa per FAF, and (v) avoids organic solvents or amphiphilic carriers. Demonstrating high stability, FAF remained soluble and monodisperse with a hydrodynamic radius of 8 nm at physiological temperature. A complete pharmacokinetic (PK) analysis of FAF revealed that the bioavailability of SC FAF was 60%, with significantly higher blood concentration during the elimination phase compared to IV FAF. The plasma concentration of Rapa delivered by FAF was 8-fold higher with a significantly increased plasma-to-whole blood ratio relative to free Rapa, 24 h after injection. To evaluate therapeutic effects, FAF-Rapa was administered SC every other day for 2 weeks to male non-obese diabetic (NOD) mice, which develop an SS-like autoimmune-mediated lacrimal gland (LG) inflammation and other characteristic features of SS. Both FAF-Rapa and free Rapa exhibited immunomodulatory effects by significantly suppressing lymphocytic infiltration, gene expression of IFN-γ, MHC II, type I collagen and IL-12a, and cathepsin S (CTSS) activity in LG compared to controls. Serum chemistry and histopathological analyses in major organs revealed no apparent toxicity of FAF-Rapa. Given its improved PK and equipotent therapeutic efficacy compared to free Rapa, FAF-Rapa is of further interest for systemic treatments for autoimmune diseases like SS.

Keywords: FK506-binding protein; Sjögren’s syndrome; cathepsin S; dacryoadenitis; elastin-like polypeptides; lacrimal gland; non-obese diabetic mouse; rapamycin.


Conflict of interest statement

The authors declare the following competing financial interest(s): J.A.M., S.F.H.-A., and S.P. are inventors on patents describing delivery of small molecules using protein polymer fusions related to this work. All other authors declare no competing financial interests.

Figures

Figure 1.
Figure 1.
Berunda polypeptides are humanized fusions of the FKBP12 protein that promote solvent-free, burst-free subcutaneous (SC) administration of Rapa to a murine model of autoimmune dacryoadenitis. Genes encoding the FK506-binding protein (12 kDa) were fused to each end of an ELP called A192 (73 kDa) to create a biheaded, biocompatible, and biodegradable drug carrier known as FAF. FAF was expressed via bacterial fermentation, purified at high yield by ELP-mediated purification, and used to solubilize Rapa. To explore the immunosuppressive properties of this formulation, FAF–Rapa was evaluated after SC injection to 14 week old male non-obese diabetic (NOD) mice every other day for 2 weeks. Male NOD mice of this age have developed autoimmune inflammation of the lacrimal gland (LG), also known as dacryoadenitis, leading to reduced tear production and dry eyes. At the termination of the study (Day 16), LG, tears, tissues, and serum were collected and analyzed using histology, gene expression, serum biochemistry, and the activity of a tear and tissue biomarker for SS known as cathepsin S.
Figure 2.
Figure 2.
High molecular weight FAF–Rapa has the purity, size, and concentration–temperature phase behavior necessary for stability at body temperature. (A) Identity, purity, and fluorescence of FAF, FAF–Rapa, and rhodamine-labeled FAF–Rapa (Rho–FAF–Rapa) were analyzed by Coomassie blue staining and fluorescence imaging of SDS–PAGE. (B) Dynamic light scattering shows that all three formulations (Table 1) remain monodisperse at 37 °C (10 μM, PBS). (C) Optical density of FAF was monitored as a function of temperature at 350 nm to confirm solubility in PBS at physiological temperatures (shaded area). The Tt of FAF at 25 μM was 57.0 °C. (D) Using optical density, the phase transition temperature was plotted vs. concentration as a phase diagram, below which FAF remains soluble (n = 3, Mean ± SD). The shaded area indicates physiological temperatures. Dotted lines show a 95% confidence interval (CI) of the mean.
Figure 3.
Figure 3.
Pharmacokinetic analysis reveals that SC administration of FAF–Rapa improves pharmacokinetic properties of Rapa. (A–D) 1.0 mg of Rapa/kg of BW of Rho–FAF–Rapa was injected either IV (n = 4) or SC (n = 5) to male NOD mice. (A) Data for the first 10 h are shown in the inset. SC administration yielded significantly higher Rho–FAF concentrations at 36, 48, and 72 h (Mean ± SD). A Student’s t test was used to compare groups. (B) Data were well-fit by either a one-compartment (IV) or three-compartment (SC) pharmacokinetic model as indicated. kabs = kabsorption. (C) On the basis of these parameters, pharmacokinetic modeling was performed to explore several dosing options prior to initiating a therapeutic study. (D–F) Male NOD mice were injected with 1.0 mg of Rapa/kg of BW as free Rapa IV (n = 4), free Rapa SC (n = 4), FAF–Rapa IV (n = 5), or FAF–Rapa SC (n = 4). Plasma and whole blood samples were collected via cardiac puncture after 24 h. (D) For each sample, Rapa concentration analyzed by LC–MS was compared with its fluorescence intensity analyzed by a plate reader to measure the Rapa to FAF ratio (min, mean, and max are depicted). A Student’s t test was used to compare groups, which revealed that at 24 h, SC administration retained nearly the starting ~2:1 ratio of Rapa:FAF, while FAF–Rapa-administered IV had lost about half of the bound drug. (E) Rapa concentration from each sample was analyzed by LC–MS (Mean ± SD). A Student’s t test and one-way ANOVA were used to compare groups. (F) For each sample, Rapa concentration in the plasma was compared to that of the whole blood (WB) (min, mean, and max are depicted). A two-way ANOVA was used to compare groups, which revealed that FAF reduces accumulation of Rapa in blood cells compared to the free drug.
Figure 4.
Figure 4.
Rapa reduces lymphocytic infiltration in the LG of male NOD mice. (A) One of each pair of LGs from each mouse in the cohort was collected at the conclusion of the study. The 25th, 50th, and 75th percentile sections from each LG were quantified by three blinded observers to determine the average percentage area of infiltrate per gland (n = 15). (B) Inflamed LGs show areas of purple nuclear staining, which indicate foci of infiltrating lymphocytes (outlined in blue). Lymphocytic infiltration was reduced by FAF–Rapa (middle panel). The scale bar represents 200 μm. (C) The percentage area of infiltration was calculated using ImageJ (Mean ± SD).
Figure 5.
Figure 5.
Gene expression profile of proteins involved in inflammation, antigen presentation, and autophagy in LG of male NOD mice treated with subcutaneous Rapa. One of each pair of LGs from mice in the treatment cohorts was collected at the conclusion of the study for mRNA extraction. Extracted mRNAs were reverse transcribed to cDNA and further analyzed by quantitative real-time PCR. Gene expression levels were normalized to vehicle (mean ± SD, n = 9). Two-way ANOVA was used to compare effects of drug and carrier. On the basis of a significant interaction between Rapa and FAF for Col1A1 (p = 0.025), one-way ANOVA and post hoc comparisons revealed significant differences between vehicle vs FAF–Rapa (p = 0.003); free Rapa vs FAF (p = 0.007); and FAF vs FAF–Rapa (p < 0.001).
Figure 6.
Figure 6.
Rapa suppresses proteolytic CTSS activity in the LG but not in the tears. At the conclusion of the 2 week study, LG and tears were collected immediately after euthanasia for CTSS activity and gene expression analysis. (A) A significant decrease in CTSS activity was observed in the LG lysates after SC Rapa treatments (n = 9). (B) No statistical significance was observed for CTSS gene expression level in the LG over a 2 week period (n = 12). (C) No statistical significance was achieved for CTSS activity in tears over a 2 week period (n = 9). Two-way ANOVA was used to compare the effects of the drug and carrier (Mean ± SD).
Figure 7.
Figure 7.
Histopathology of mouse organs reveals no systemic toxicity of FAF–Rapa at a therapeutic dose. At the conclusion of the study, organs and bloods from mice were sampled upon euthanasia. Organs were fixed, paraffin-embedded, sectioned, and stained with H&E. Kidney (n = 3), spleen (n = 3), lung (n = 3), and liver (n = 5) were analyzed by a blinded, trained pathologist. Images of organs from one representative mouse from each group were selected by a pathologist and shown. Black bar represents 100 μm.
Figure 8.
Figure 8.
FAF–Rapa induces temporary hyperglycemia in NOD mice that resolves after termination of the treatment. (A) At the conclusion of the study as described in Figure 1, blood glucose levels of individual mice were measured. The dotted line shows 250 mg/dL, which is a criterion for hyperglycemia. A Kruskal–Wallis nonparametric test was performed based on a statistical significance achieved by Rapa treatment (Vehicle + FAF vs free Rapa + FAF–Rapa, p < 0.001) and significant interaction between Rapa and FAF (p = 0.004) using two-way ANOVA (Mean ± SD, n = 15). Results of the Kruskal–Wallis nonparametric test are presented. (B) Each mouse treated with FAF–Rapa was further analyzed to correlate percent body weight change to blood glucose change, before and after the treatment. Mice with final blood glucose less than 200 mg/dL (circle), between 200 and 250 mg/dL (triangle), and above 250 mg/dL (square) were plotted. (C,D) In two additional studies, FAF–Rapa was administered as described in Figure 1 (shaded area) to either (C) male NOD mice (n = 5) or (D) male Balb/C mice (n = 5), and the blood glucose levels of individual mice (M1~M5) were monitored for 2 weeks after termination of the treatment.

References

    1. Kojima I; Cheng YR; Mohan V; Demain AL Carbon source nutrition of rapamycin biosynthesis in Streptomyces hygroscopicus. J. Ind. Microbiol 1995, 14 (6), 436–9. - PubMed
    1. Costa MA; Simon DI Molecular basis of restenosis and drug-eluting stents. Circulation 2005, 111 (17), 2257–2273. - PubMed
    1. Thomson AW; Turnquist HR; Raimondi G Immunoregulatory functions of mTOR inhibition. Nat. Rev. Immunol 2009, 9 (5), 324–37. - PMC - PubMed
    1. Bjornsti MA; Houghton PJ The TOR pathway: a target for cancer therapy. Nat. Rev. Cancer 2004, 4 (5), 335–48. - PubMed
    1. Hardinger KL; Koch MJ; Brennan DC Current and future immunosuppressive strategies in renal transplantation. Pharmacotherapy 2004, 24 (9), 1159–76. - PubMed

Publication types

MeSH terms