Review
. 2019 Aug:318:192-204.
doi: 10.1016/j.expneurol.2019.05.010. Epub 2019 May 13.

Surgical preparations, labeling strategies, and optical techniques for cell-resolved, in vivo imaging in the mouse spinal cord

Affiliations
Review

Surgical preparations, labeling strategies, and optical techniques for cell-resolved, in vivo imaging in the mouse spinal cord

Yu-Ting Cheng et al. Exp Neurol. 2019 Aug.

Abstract

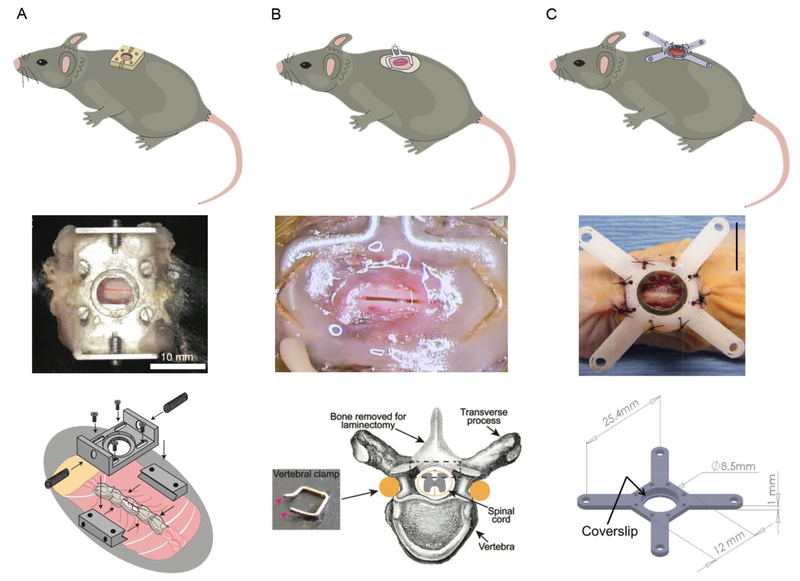
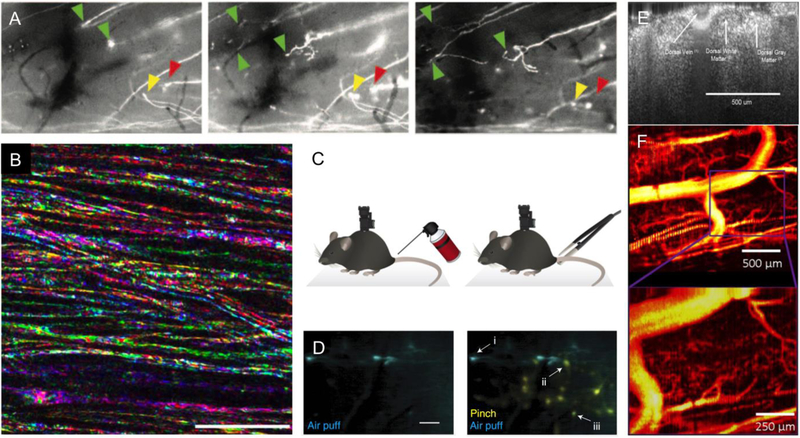
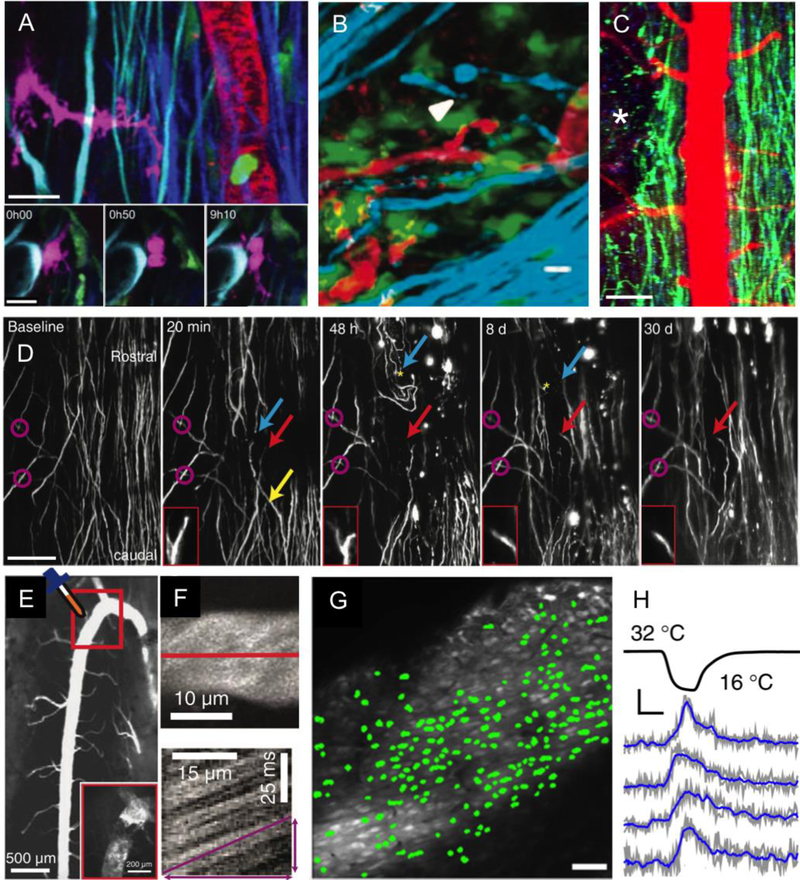
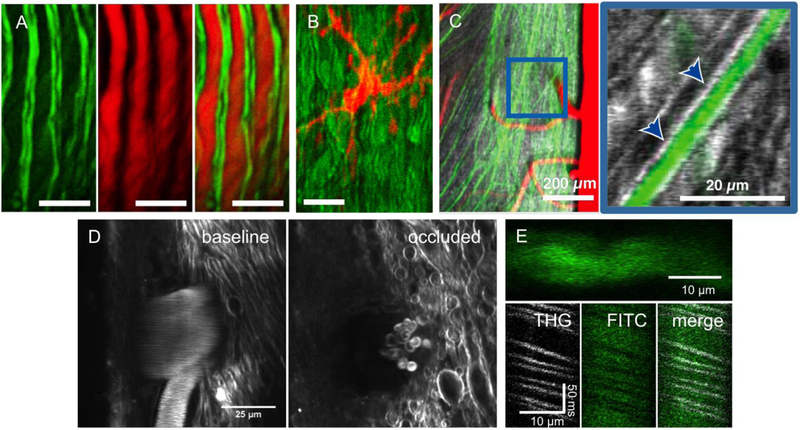
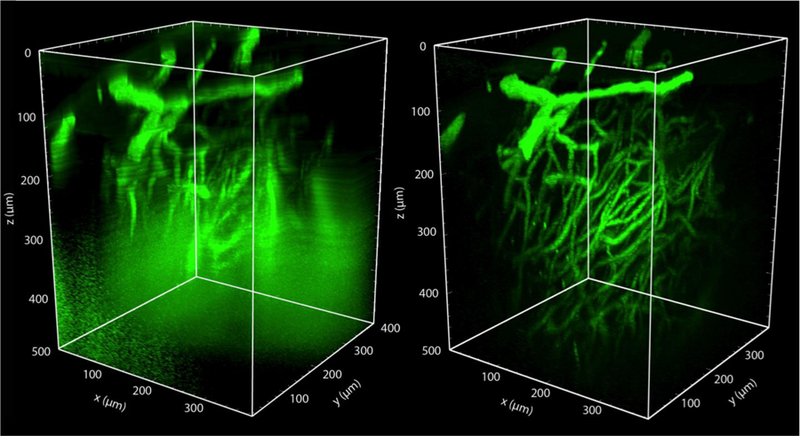
In vivo optical imaging has enabled detailed studies of cellular dynamics in the brain of rodents in both healthy and diseased states. Such studies were made possible by three advances: surgical preparations that give optical access to the brain; strategies for in vivo labeling of cells with structural and functional fluorescent indicators; and optical imaging techniques that are relatively insensitive to light scattering by tissue. In vivo imaging in the rodent spinal cord has lagged behind than that in the brain, largely due to the anatomy around the spinal cord that complicates the surgical preparation, and to the strong optical scattering of the dorsal white matter that limits the ability to image deep into the spinal cord. Here, we review recent advances in surgical methods, labeling strategies, and optical tools that have enabled in vivo, high-resolution imaging of the dynamic behaviors of cells in the spinal cord in mice. Surgical preparations that enable long-term optical access and robust stabilization of the spinal cord are now available. Labeling strategies that have been used in the spinal cord tend to follow those that have been used in the brain, and some recent advances in genetically-encoded labeling strategies remain to be capitalized on. The optical imaging methods used to date, including two photon excited fluorescence microscopy, are largely limited to imaging the superficial layers of the spinal cord by the optical scattering of the white matter. Finally, we show preliminary data that points to the use of higher-order nonlinear optical processes, such as three photon excited fluorescence, as a means to image deeper into the mouse spinal cord.

Keywords: Animal models; Chronic imaging; Intravital microscopy; Spinal cord; Two-photon excited fluorescence.


Figures

Fig.1
Fig.1. Chronic spinal cord imaging chambers.
(A) The system developed by Farrar, et al. uses machined parts, including two small metal bars and a top plate, to create a sealed chamber that is fixed to the spine. Reproduced from (Farrar et al., 2012). (B) The approach described by Fenrich, et al. relies on small bent pieces of metal and glue to create a sealed chamber that is secured to the spine. Reproduced from (Fenrich et al., 2012; Fenrich et al., 2013a). (C) Figley, et al. sealed the laminectomy separately and then secured a mounting frame to the surrounding muscle and soft tissue over the spine. Scale bar = 10 mm. Reproduced from (Figley et al., 2013).
Fig. 2
Fig. 2. Linear optical imaging in the mouse spinal cord.
(A) Sprouting of the dystrophic tip of severed GFP-labeled axons after systemic treatment with epothilone B, visualized using wide-field fluorescence microscopy. From left to right, images taken at 6 h, 1 d, and 4 d after spinal cord dorsal hemisection. The green arrows indicate regenerating axons, while the yellow and red arrows point to a forming retraction bulb and a dying axon, respectively. Images about 700-µm wide. Reproduced from (Ruschel et al., 2015). (B) Multicolor SCoRe microscopy images showing individual myelinated axons in mouse spinal cord, imaged in vivo. Scale bar = 25 µm. Reproduced from (Schain et al., 2014). (C) Schematic of a miniaturized spine-mounted wide-field fluorescence microscope used to image spinal cord neural activity in behaving mice in response to different mechanical stimuli. (D) Time-integrated fluorescence from GCaMP6-labeled dorsal horn neurons in response to an air puff on the tail (left and right; cyan) or a pinch with forceps (right; yellow). In the image on the right, neuron (i) responds only to the air puff, neuron (ii) only to the tail pinch, while neuron (iii) responds to both. Scale bar = 100 µm. C and D reproduced from (Sekiguchi et al., 2016). (E) Coronal view of the mouse spinal cord imaged in vivo with OCT, showing white and grey matter as well as the large dorsal spinal vein on the surface. (F) Contrast in speckle variance OCT depends on the motion of optical scatterers, and so highlights microvascular structures in the spinal cord. E and F reproduced from (Cadotte et al., 2012).
Fig. 3
Fig. 3. In vivo two-photon excited fluorescence imaging of cellular structure and function in the mouse spinal cord.
(A) 2PEF imaging of four different fluorescent labels and SHG in mouse spinal cord. (top) Transgenic Thy1-CFP labels dorsal column axons (cyan), transgenic LysM-GFP labels myelo-monocytic cells such as granulocytes and macrophages (green), transgenic CD11c-EYFP labels a subset of dendritic cells, microglia, and macrophages (magenta), intravenously injected fluorescent quantum dots (QDot 655) labels the blood plasma (red), and SHG comes from endogenous collagen in the dura matter (purple). (bottom) Time series showing the division of a CD11c-expressing cell 3 d after a spinal cord injury just rostral to the imaging site. Scale bar = 100 µm and 20 µm in the top and bottom images, respectively. Reproduced from (Fenrich et al., 2013b). (B) Imaging of axons (cyan; transgenic Thy1-CFP), microglia/macrophages (green; transgenic Cx3Cr1-GFP), and fluorescently-tagged fibrinogen (red: intravenously-injected Alexa 594-fibrinogen) in the EAE mouse model of MS. The white arrowhead indicates a degenerating axon. Scale bar = 10 µm. Reproduced from (Davalos, Ryu, et al., 2012). (C) Low-magnification 2PEF imaging of dorsal axons (green; transgenic Thy1-YFP) and blood vessels (red; intravenous Texas Red-dextran) at one day after a pin prick injury to the spinal cord at the location indicated by the white asterisk (unpublished data). Scale bar = 80 µm. (D) Long-term observation of axons (transgenic Thy1-YFP) after a focal, laser injury to the dorsal surface of the spinal cord. Yellow arrow: axon degenerated beyond imaging field; red arrow: axon was stable over course of imaging with axon tip shown in insets; blue arrow: axon slowly died back from lesion; magenta circles: landmarks identified across imaging sessions. Scale bar = 100 µm. Reproduced from (Farrar et al., 2012). (E) Low-magnification 2PEF image of fluorescently-labeled blood vessels, showing the prominence of the dorsal spinal vein. The inset shows the outlined region from the main figure after topical application of FeCl3 to induce clotting. (F) Top image shows a maximum projection of a 2PEF image stack of a venule with fluorescently-labeled blood plasma. Below is a space-time image formed by taking a repeated line scan along the center of the vessel, at the position indicated with the red line in the top image. Moving red blood cells, which do not take up the intravenously injected dye, form dark streaks whose slope is proportion to the inverse of the blood flow speed. E and F reproduced from (Farrar et al., 2015). (G) In vivo 2PEF imaging of OGB-labeled sensory neurons in the spinal cord of an anesthetized mouse. Green overlays indicate neurons that responded to the application of a cooling stimulus to the hind paw. Scale bar = 50 µm. (H) Example traces of the normalized change in fluorescence from OGB-labeled neurons responding to a cooling hind paw stimulus. Scale bar represents 10% ΔF/F and 10 s. G and H reproduced from (Ran et al., 2016).
Fig. 4
Fig. 4. Imaging of endogenous nonlinear optical signals in the mouse spinal cord.
(A) 2PEF imaging of YFP labeled axons (left), CARS imaging of myelin (middle), and an overlay of both modalities (right). Scale bar = 15 µm. (B) 2PEF of GFP labeled microglia (red) and CARS imaging of myelin (green). Scale bar = 15 µm. A and B reproduced from (Bélanger et al., 2012). (C) 2PEF imaging of YFP labeled axons (green) and THG (grey), which highlights myelin. The magnified image to the right (at location of blue box) shows the THG signal from myelin (arrowheads) wrapping tightly around a YFP labeled axon. Imaging done using 1,040-nm excitation light. Reproduced from (Farrar et al., 2011). (D) THG images taken using 1,320-nm excitation light at the surface of the spinal cord before (left) and 30 min after (right) photothrombotic occlusion of a surface venule. THG contrast is produced both by the myelin and by red blood cells inside the vessel (visible as streaks in the image on the left due to their motion). After the occlusion, only stationary red blood cells (which show a characteristic donut shape) are visible and the nearby myelin has begun to degenerate (unpublished data). (E) (top) 3PEF imaging of a spinal cord capillary labeled with an intravenous injection of FITC-dextran. (bottom) Space-time images from repetitive line scans along the axis of the capillary with THG and 3PEF signals detected simultaneously, showing the mutual exclusivity of these two signals in blood, with red blood cells producing THG while excluding the fluorescent dye that labels the blood plasma (unpublished data).
Fig. 5
Fig. 5. Three photon excited fluorescence microscopy enables much deeper imaging than two photon excited fluorescence in mouse spinal cord.
(left) Rendered 2PEF image stack of the spinal cord vasculature from a live, anesthetized mouse, labeled with an intravenous injection of 5% FITC-dextran. Image was taken with 800-nm excitation light (Chameleon, Coherent). (right) 3PEF imaging of the same region using 1,320-nm excitation light (Opera-F, Coherent). Out of plane fluorescence excitation leads to an increasing background with depth using 2PEF, ultimately limiting the imaging depth. This background is suppressed with 3PEF imaging, enabling visualization of individual capillaries as deep as 500 µm into the spinal cord (unpublished data).

References

    1. Adur J, Carvalho HF, Cesar CL, & Casco VH (2014). Nonlinear optical microscopy signal processing strategies in cancer. Cancer Inform, 13, 67–76. doi:10.4137/CIN.S12419 - DOI - PMC - PubMed
    1. Bélanger E, Crepeau J, Laffray S, Vallee R, De Koninck Y, & Cote D (2012). Live animal myelin histomorphometry of the spinal cord with video-rate multimodal nonlinear microendoscopy. J Biomed Opt, 17(2), 021107. doi:10.1117/1.JBO.17.2.021107 - DOI - PubMed
    1. Bellardita C, Caggiano V, Leiras R, Caldeira V, Fuchs A, Bouvier J, … Kiehn O (2017). Spatiotemporal correlation of spinal network dynamics underlying spasms in chronic spinalized mice. Elife, 6. doi:10.7554/eLife.23011 - DOI - PMC - PubMed
    1. Benakis C, Garcia-Bonilla L, Iadecola C, & Anrather J (2014). The role of microglia and myeloid immune cells in acute cerebral ischemia. Front Cell Neurosci, 8, 461. doi:10.3389/fncel.2014.00461 - DOI - PMC - PubMed
    1. Cadotte DW, Mariampillai A, Cadotte A, Lee KK, Kiehl TR, Wilson BC, … Yang VX (2012). Speckle variance optical coherence tomography of the rodent spinal cord: in vivo feasibility. Biomed Opt Express, 3(5), 911–919. doi:10.1364/BOE.3.000911 - DOI - PMC - PubMed

Publication types