. 2019 May 16;20(1):253.
doi: 10.1186/s12859-019-2845-y.

HOME: a histogram based machine learning approach for effective identification of differentially methylated regions

Affiliations

HOME: a histogram based machine learning approach for effective identification of differentially methylated regions

Akanksha Srivastava et al. BMC Bioinformatics. .

Abstract

Background: The development of whole genome bisulfite sequencing has made it possible to identify methylation differences at single base resolution throughout an entire genome. However, a persistent challenge in DNA methylome analysis is the accurate identification of differentially methylated regions (DMRs) between samples. Sensitive and specific identification of DMRs among different conditions requires accurate and efficient algorithms, and while various tools have been developed to tackle this problem, they frequently suffer from inaccurate DMR boundary identification and high false positive rate.

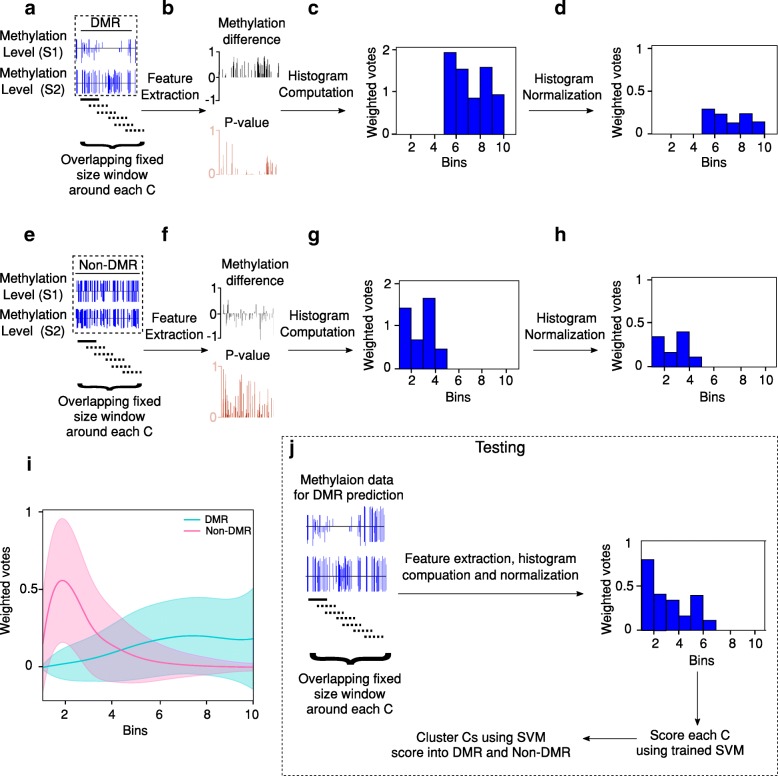
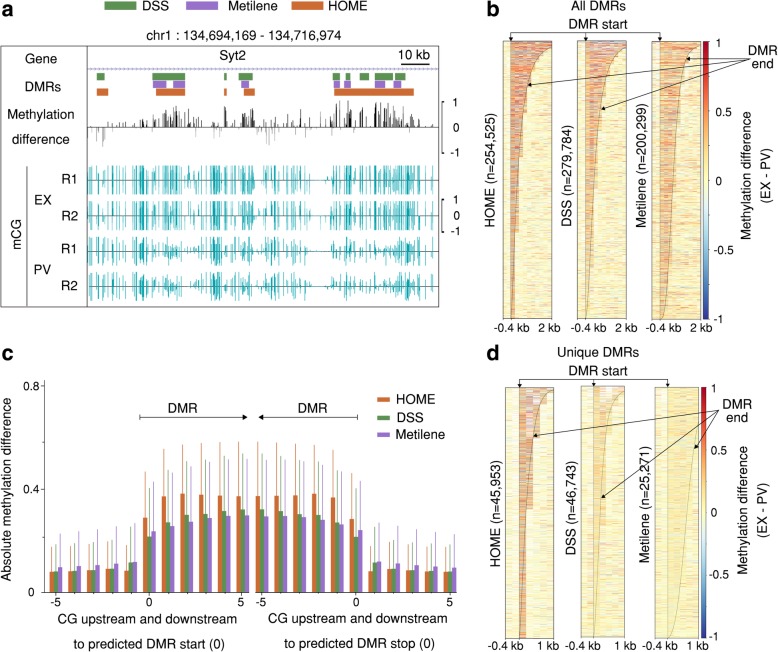
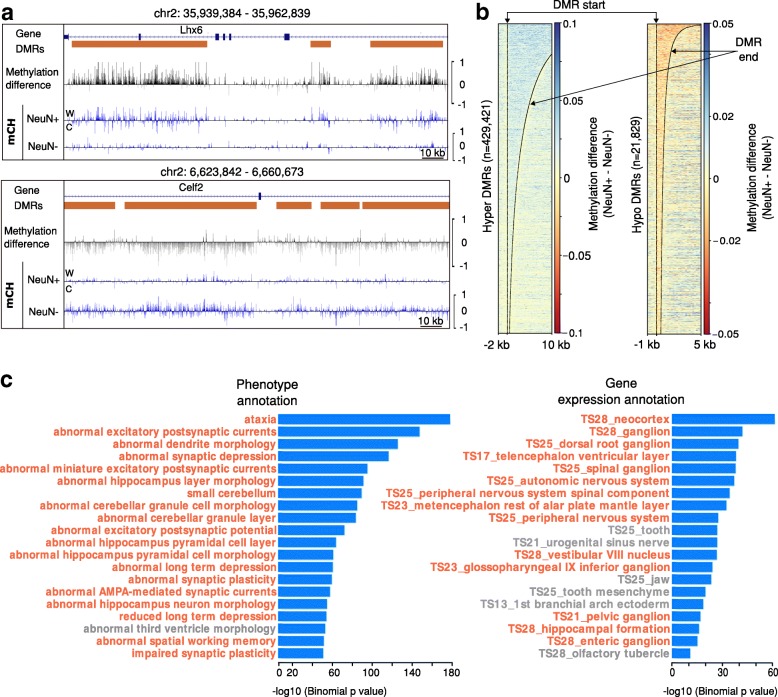
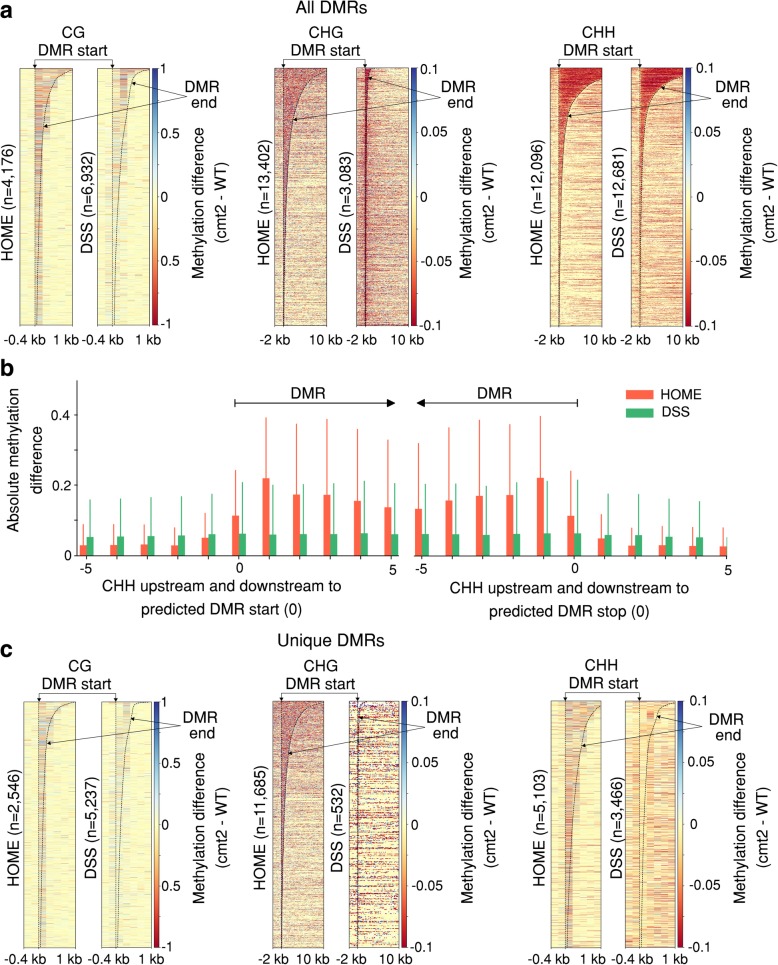
Results: We present a novel Histogram Of MEthylation (HOME) based method that takes into account the inherent difference in the distribution of methylation levels between DMRs and non-DMRs to discriminate between the two using a Support Vector Machine. We show that generated features used by HOME are dataset-independent such that a classifier trained on, for example, a mouse methylome training set of regions of differentially accessible chromatin, can be applied to any other organism's dataset and identify accurate DMRs. We demonstrate that DMRs identified by HOME exhibit higher association with biologically relevant genes, processes, and regulatory events compared to the existing methods. Moreover, HOME provides additional functionalities lacking in most of the current DMR finders such as DMR identification in non-CG context and time series analysis. HOME is freely available at https://github.com/ListerLab/HOME .

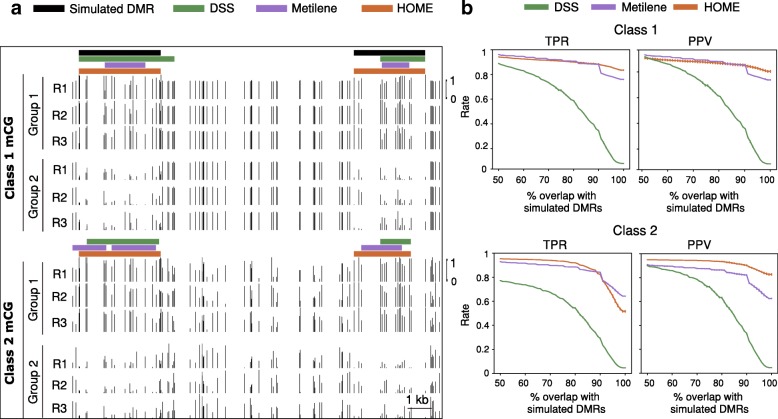
Conclusion: HOME produces more accurate DMRs than the current state-of-the-art methods on both simulated and biological datasets. The broad applicability of HOME to identify accurate DMRs in genomic data from any organism will have a significant impact upon expanding our knowledge of how DNA methylation dynamics affect cell development and differentiation.

Keywords: DMR identification; DNA methylation; Epigenetics; SVM; Whole genome bisulfite sequencing.


Conflict of interest statement

Ethics approval and consent to participate

Not applicable.

Consent for publication

Not applicable.

Competing interests

The authors declare no conflicts of interest.

Publisher’s Note

Springer Nature remains neutral with regard to jurisdictional claims in published maps and institutional affiliations.

Figures

Fig. 1
Fig. 1
Feature generation overview. (a) Methylation level of sample 1 (S1) and sample 2 (S2) for a DMR from the training set. The overlapping fixed size window is used around individual cytosine (C) in the DMR for feature extraction. (b) Extracted features: p-value and difference in methylation level for each CG site. (c) Histogram of scores computed from the extracted features and (d) histogram of normalized scores. (e) Methylation level of S1 and S2 for a non-DMR from the training dataset. The overlapping fixed size window is used around individual C in the DMR for feature extraction. (f) Extracted features: p-value and difference in methylation level for each CG. (g) Histogram of scores computed from the extracted features and (H) histogram of normalized scores. (i) Mean and standard deviation of histogram features for complete training data for DMRs (blue) and non-DMRs (pink). (j) Testing and DMR prediction on new dataset
Fig. 2
Fig. 2
Comparison of DMR detection methods (HOME, DSS and Metilene) on simulated data. (a) Browser representation showing the quality and boundary accuracy of predicted DMRs by HOME, DSS and Metilene on two simulated classes. The horizontal bars indicate the DMRs. Simulated DMRs (black) and the scale are the same for both classes. (b) The performance of HOME, DSS, and Metilene was assessed in terms of true positive rate (TPR) and positive predictive value (PPV) for both classes. The plots show mean and standard deviation of TPR and PPV for 5 random simulations. The evaluation was performed in terms of percent reciprocal overlap ranging from 50 to 100% between simulated and predicted DMRs by HOME, DSS and Metilene for two classes
Fig. 3
Fig. 3
Quality assessment of CG-DMRs predicted in mammalian WGBS data by HOME, DSS and Metilene. (a) Browser representation showing the quality and boundary accuracy of predicted CG context DMRs for the PV specific gene Syt2. (b) Heatmap of methylation level difference for all predicted DMRs by HOME, DSS and Metilene. The DMRs are sorted by length. The bin size is 200 bp for all heatmaps. (c) Mean and standard deviation of absolute methylation difference for all predicted CG DMRs for 5 CGs upstream and downstream of the DMR start (left) and stop (right) marked as 0, respectively. (d) Heatmap of methylation level difference for uniquely predicted DMRs by HOME, DSS and Metilene
Fig. 4
Fig. 4
Quality assessment of CH-DMRs predicted in mammalian WGBS data. (a) Genome browser representation of the quality and boundary accuracy of HOME predicted CH context DMRs for neurons (NeuN+) and glia (NeuN-) methylation data. Top panel represents hyper-methylated DMRs in NeuN+ and bottom panel represents hypo-methylated DMRs in NeuN+. (b) Heatmap of methylation level difference for hyper-methylated HOME DMRs and hypo-methylated HOME DMRs. (c) Biological annotations of hypo-methylated HOME DMRs in NeuN+ cells displaying the top 20 terms using the mouse phenotype annotation and the MGI gene expression annotation (neuron, or glia, and brain tissue related terms are highlighted in orange)
Fig. 5
Fig. 5
Qualitative analysis of predicted DMRs by HOME and DSS in plant WGBS data. (a) Heatmap of methylation level difference for all predicted HOME and DSS DMRs, between cmt2 and WT, for CG, CHG and CHH contexts. (b) Mean and standard deviation of absolute methylation difference for all predicted CHH DMRs by HOME and DSS for 5 CGs upstream and downstream of the DMR start (left) and stop (right) marked as 0, respectively. (c) Heatmap of methylation level difference for uniquely predicted HOME and DSS DMRs, between cmt2 and WT, for CG, CHG and CHH contexts
Fig. 6
Fig. 6
Browser representations of CG DMRs predicted by HOME in time-series WGBS data. Six time points: mouse embryonic fibroblast (MEF), day 3, day 6, day 9, day 12 and induced pluripotent stem cell (iPSC)

Similar articles

Cited by

References

    1. Richardson BC. Role of DNA methylation in the regulation of cell function: autoimmunity, aging and cancer. J Nutr. 2002;132(8):2401S–2405S. - PubMed
    1. Khavari DA, Sen GL, Rinn JL. DNA methylation and epigenetic control of cellular differentiation. Cell Cycle. 2010;9(19):3880–3883. - PubMed
    1. Messerschmidt DM, Knowles BB, Solter D. DNA methylation dynamics during epigenetic reprogramming in the germline and preimplantation embryos. Genes Dev. 2014;28(8):812–828. - PMC - PubMed
    1. Jones PA. Functions of DNA methylation: islands, start sites, gene bodies and beyond. Nat Rev Genet. 2012;13(7):484–492. - PubMed
    1. Lister R, Mukamel EA, Nery JR, Urich M, Puddifoot CA, Johnson ND, Lucero J, Huang Y, Dwork AJ, Schultz MD, et al. Global epigenomic reconfiguration during mammalian brain development. Science. 2013;341(6146):1237905. - PMC - PubMed