

GenePy - a score for estimating gene pathogenicity in individuals using next-generation sequencing data
- PMID: 31096927
- PMCID: PMC6524327
- DOI: 10.1186/s12859-019-2877-3
GenePy - a score for estimating gene pathogenicity in individuals using next-generation sequencing data
Abstract
Background: Next-generation sequencing is revolutionising diagnosis and treatment of rare diseases, however its application to understanding common disease aetiology is limited. Rare disease applications binarily attribute genetic change(s) at a single locus to a specific phenotype. In common diseases, where multiple genetic variants within and across genes contribute to disease, binary modelling cannot capture the burden of pathogenicity harboured by an individual across a given gene/pathway. We present GenePy, a novel gene-level scoring system for integration and analysis of next-generation sequencing data on a per-individual basis that transforms NGS data interpretation from variant-level to gene-level. This simple and flexible scoring system is intuitive and amenable to integration for machine learning, network and topological approaches, facilitating the investigation of complex phenotypes.
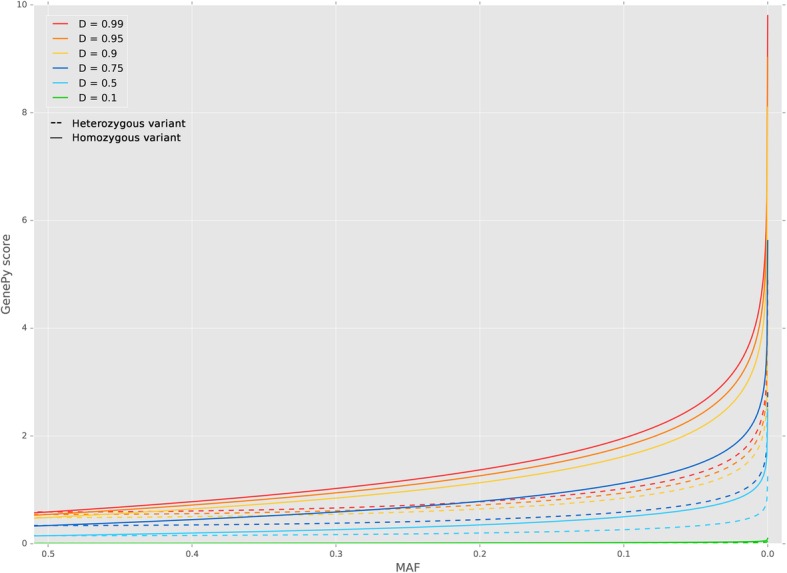
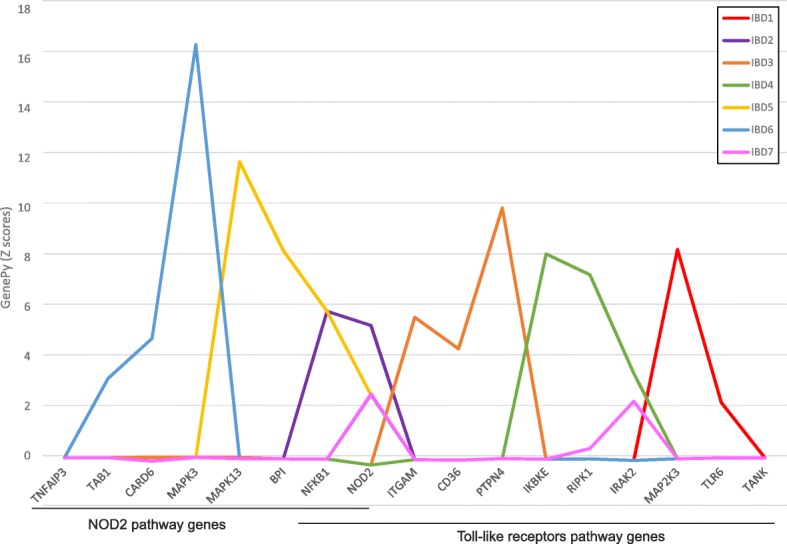
Results: Whole-exome sequencing data from 508 individuals were used to generate GenePy scores. For each variant a score is calculated incorporating: i) population allele frequency estimates; ii) individual zygosity, determined through standard variant calling pipelines and; iii) any user defined deleteriousness metric to inform on functional impact. GenePy then combines scores generated for all variants observed into a single gene score for each individual. We generated a matrix of ~ 14,000 GenePy scores for all individuals for each of sixteen popular deleteriousness metrics. All per-gene scores are corrected for gene length. The majority of genes generate GenePy scores < 0.01 although individuals harbouring multiple rare highly deleterious mutations can accumulate extremely high GenePy scores. In the absence of a comparator metric, we examine GenePy performance in discriminating genes known to be associated with three common, complex diseases. A Mann-Whitney U test conducted on GenePy scores for this positive control gene in cases versus controls demonstrates markedly more significant results (p = 1.37 × 10- 4) compared to the most commonly applied association tool that combines common and rare variation (p = 0.003).
Conclusions: Per-gene per-individual GenePy scores are intuitive when assessing genetic variation in individual patients or comparing scores between groups. GenePy outperforms the currently accepted best practice tools for combining common and rare variation. GenePy scores are suitable for downstream data integration with transcriptomic and proteomic data that also report at the gene level.
Keywords: Gene score; Genome analysis; Mathematical modelling; Next-generation sequencing; Pathogenicity score.
Conflict of interest statement
The authors declare that they have no competing interests.
Figures

References
MeSH terms
Grants and funding
LinkOut - more resources
Full Text Sources
Molecular Biology Databases
