

National, regional, and global levels and trends in neonatal mortality between 1990 and 2017, with scenario-based projections to 2030: a systematic analysis
- PMID: 31097275
- PMCID: PMC6527519
- DOI: 10.1016/S2214-109X(19)30163-9
National, regional, and global levels and trends in neonatal mortality between 1990 and 2017, with scenario-based projections to 2030: a systematic analysis
Erratum in
-
Correction to Lancet Glob Health 2019; 7: e710-20.Lancet Glob Health. 2019 Sep;7(9):e1179. doi: 10.1016/S2214-109X(19)30251-7. Epub 2019 Jun 10. Lancet Glob Health. 2019. PMID: 31196817 Free PMC article. No abstract available.
Abstract
Background: Reducing neonatal mortality is an essential part of the third Sustainable Development Goal (SDG), to end preventable child deaths. To achieve this aim will require an understanding of the levels of and trends in neonatal mortality. We therefore aimed to estimate the levels of and trends in neonatal mortality by use of a statistical model that can be used to assess progress in the SDG era. With these estimates of neonatal mortality between 1990 and 2017, we then aimed to assess how different targets for neonatal mortality could affect the burden of neonatal mortality from 2018 to 2030.
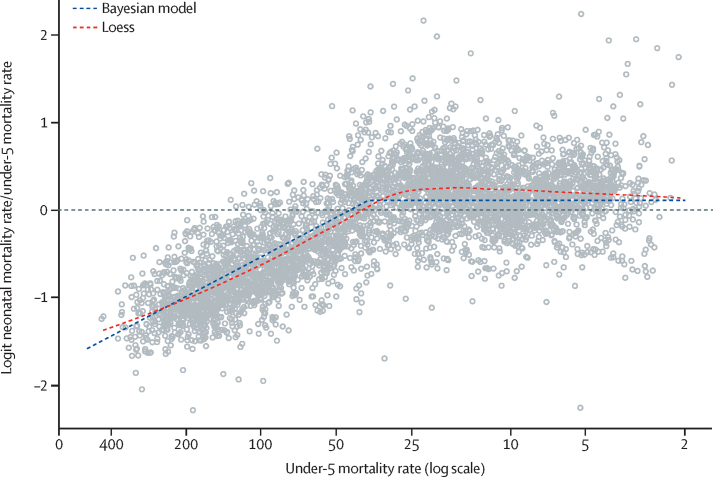
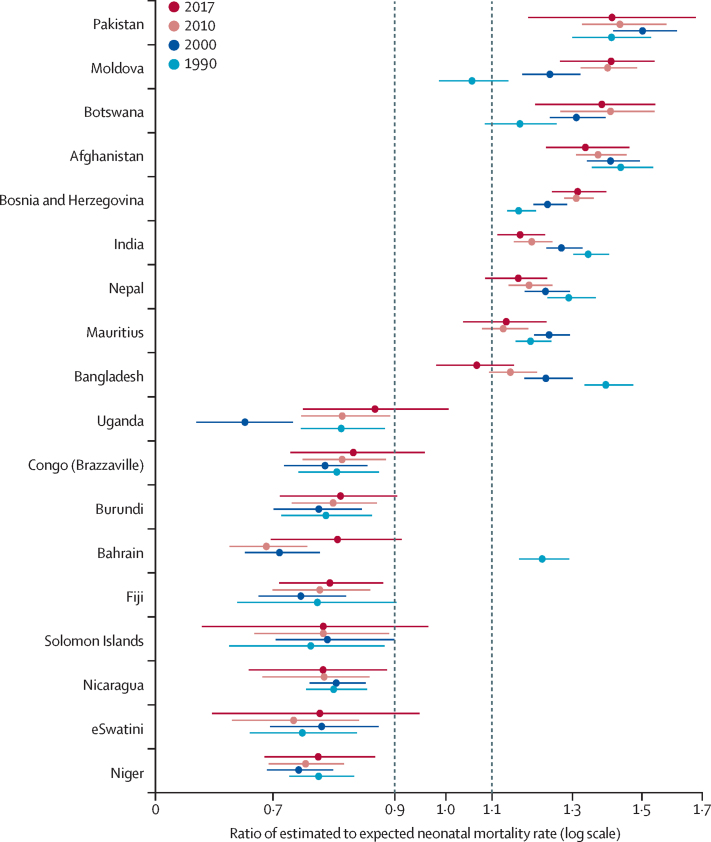
Methods: In this systematic analysis, we used nationally-representative empirical data related to neonatal mortality, including data from vital registration systems, sample registration systems, and household surveys, to estimate country-specific neonatal mortality rates (NMR; the probability of dying during the first 28 days of life) for all countries between 1990 (or the earliest year of available data) and 2017. For our analysis, we used all publicly available data on neonatal mortality from databases compiled annually by the UN Inter-agency Group for Child Mortality Estimation, which were extracted on or before July 31, 2018, for data relating to the period between 1950 and 2017. All nationally representative data were assessed. We used a Bayesian hierarchical penalised B-splines regression model, which allowed for data from different sources to be weighted differently, to account for variable biases and for the uncertainty in NMR to be assessed. The model simultaneously estimated a global association between NMR and under-5 mortality rate and country-specific and time-specific effects, which enabled us to identify countries with an NMR that was higher or lower than expected. Scenario-based projections were made at the county level by use of current levels of and trends in neonatal mortality and historic or annual rates of reduction that would be required to achieve national targets. The main outcome that we assessed was the levels of and trends in neonatal mortality and the global and regional NMRs from 1990 to 2017.
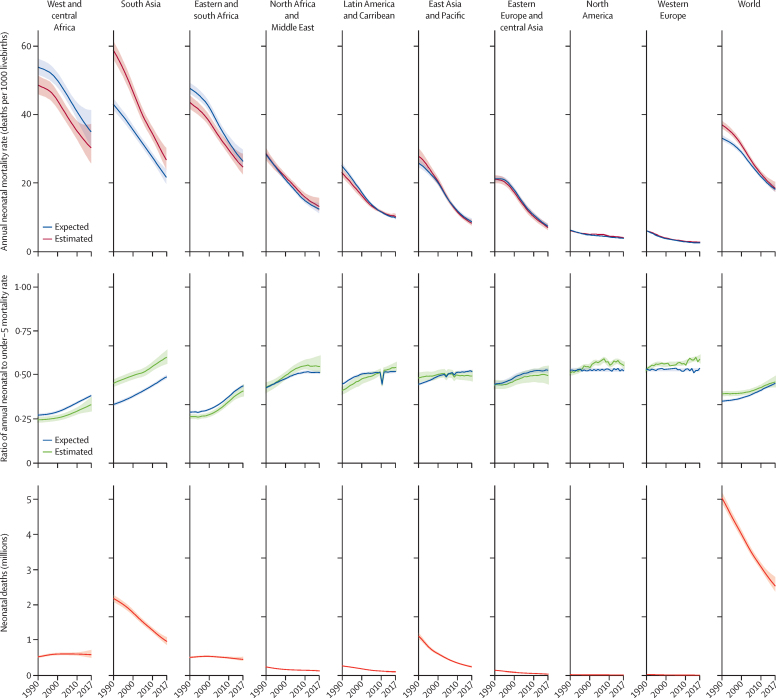
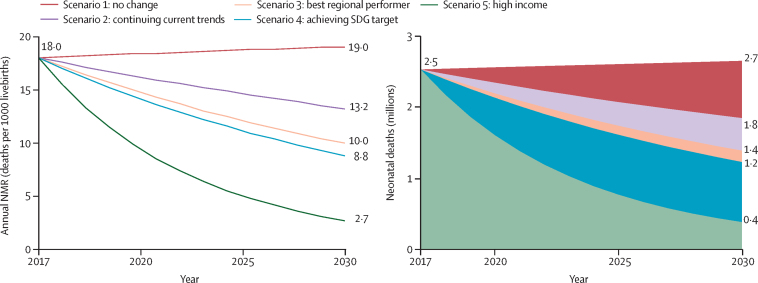
Findings: Between 1990 and 2017, the global NMR decreased by 51% (90% uncertainty interval [UI] 46-54), from 36·6 deaths per 1000 livebirths (35·5-37·8) in 1990, to 18·0 deaths per 1000 livebirths (17·0-19·9) in 2017. The estimated number of neonatal deaths during the same period decreased from 5·0 million (4·9 million-5·2 million) to 2·5 million (2·4 million-2·8 million). Annual NMRs vary widely across the world, but west and central Africa and south Asia had the highest NMRs in 2017. All regions have reported reductions in NMRs since 1990, and most regions accelerated progress in reducing neonatal mortality in 2000-17 versus 1990-2000. Between 2018 and 2030, we project that 27·8 million children will die in their first month of life if each country maintains its current rate of reduction in NMR. If each country achieves the SDG neonatal mortality target of 12 deaths per 1000 livebirths or fewer by 2030, we project 22·7 million cumulative neonatal deaths by 2030. More than 60 countries need to accelerate their progress to reach the neonatal mortality SDG target by 2030.
Interpretation: Although substantial progress has been made in reducing neonatal mortality since 1990, increased efforts to improve progress are still needed to achieve the SDG target by 2030. Accelerated improvements are most needed in the regions and countries with high NMR, particularly in sub-Saharan Africa and south Asia.
Funding: Bill & Melinda Gates Foundation, United States Agency for International Development.
Copyright © 2019 The Author(s). Published by Elsevier Ltd. This is an Open Access article under the CC BY 4.0 license. Published by Elsevier Ltd.. All rights reserved.
Figures
References
-
- UN Secretary-General Ban Ki-moon Global strategy for women's and children's health. 2010. http://www.everywomaneverychild.org/images/content/files/global_strategy...
- UN Secretary-General Ban Ki-moon. Global strategy for women's and children's health. 2010. http://www.everywomaneverychild.org/images/content/files/global_strategy... (accessed June 19, 2016).
-
- UNICEF Committing to child survival: a promise renewed. 2012. https://www.unicef.org/publications/files/APR_Progress_Report_2012_11Sep...
- UNICEF. Committing to child survival: a promise renewed. 2012. https://www.unicef.org/publications/files/APR_Progress_Report_2012_11Sep... (accessed July 21, 2018).
-
- WHO. UNICEF Every Newborn: an action plan to end preventable deaths. June 30, 2014. https://www.healthynewbornnetwork.org/resource/every-newborn-action-plan/
- WHO, UNICEF. Every Newborn: an action plan to end preventable deaths. June 30, 2014. https://www.healthynewbornnetwork.org/resource/every-newborn-action-plan/ (accessed July 21, 2018).
-
- Oestergaard MZ, Inoue M, Yoshida S. Neonatal mortality levels for 193 countries in 2009 with trends since 1990: a systematic analysis of progress, projections, and priorities. PLoS Med. 2011;8:e1001080. - PMC - PubMed
- Oestergaard MZ, Inoue M, Yoshida S, et al. Neonatal mortality levels for 193 countries in 2009 with trends since 1990: a systematic analysis of progress, projections, and priorities. PLoS Med 2011; 8: e1001080. - PMC - PubMed
-
- Alkema L, New JR. Global estimation of child mortality using a Bayesian B-spline bias-reduction method. Ann Appl Stat. 2014;8:2122–2149.
- Alkema, L, New, JR. Global estimation of child mortality using a Bayesian B-spline bias-reduction method. Ann Appl Stat 2014; 8: 2122–49.
Publication types
MeSH terms
LinkOut - more resources
Full Text Sources
Medical
