. 2019 Jun 18;50(6):1498-1512.e5.
doi: 10.1016/j.immuni.2019.04.010. Epub 2019 May 13.

Intratumoral Activity of the CXCR3 Chemokine System Is Required for the Efficacy of Anti-PD-1 Therapy

Affiliations

Intratumoral Activity of the CXCR3 Chemokine System Is Required for the Efficacy of Anti-PD-1 Therapy

Melvyn T Chow et al. Immunity. .

Abstract

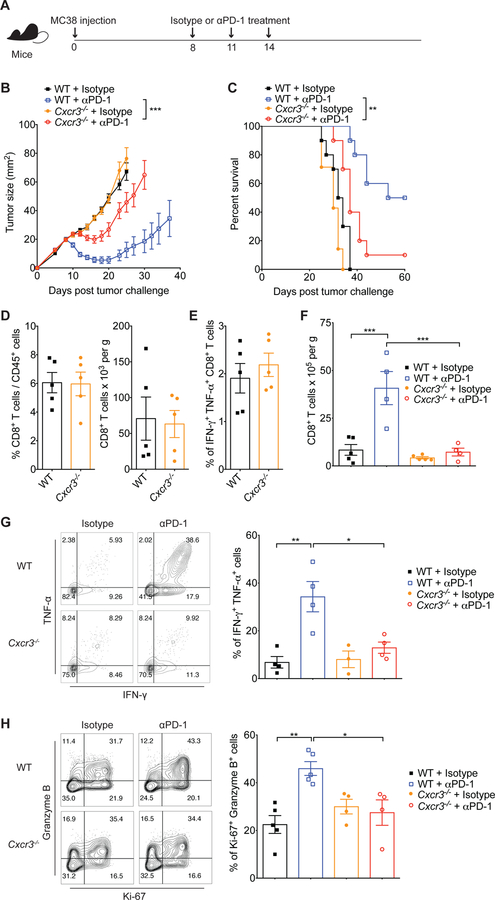
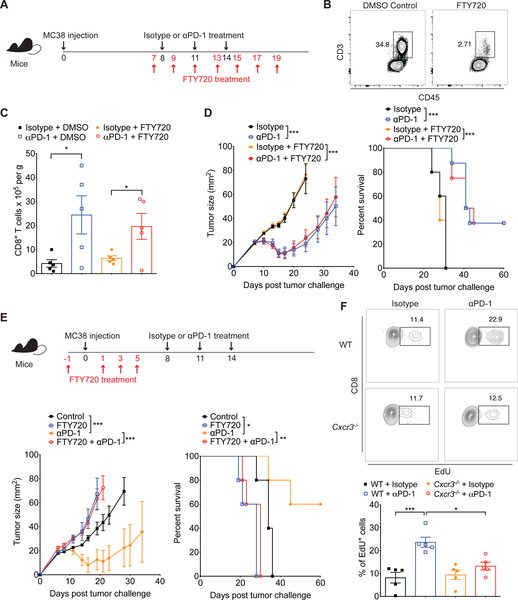
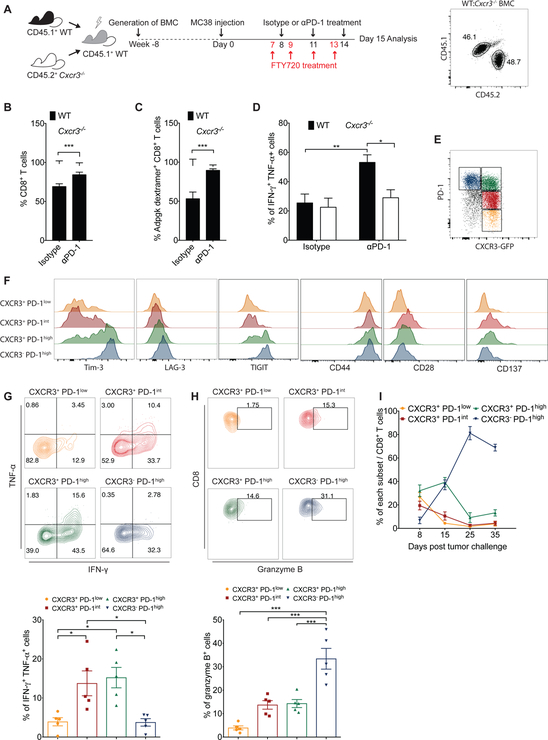
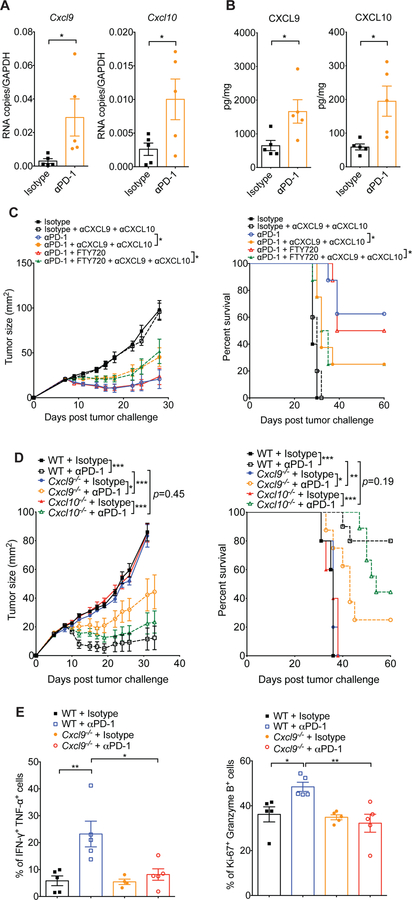
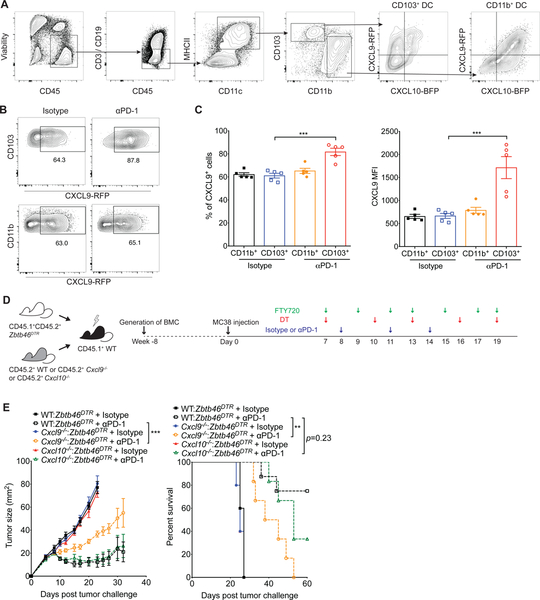
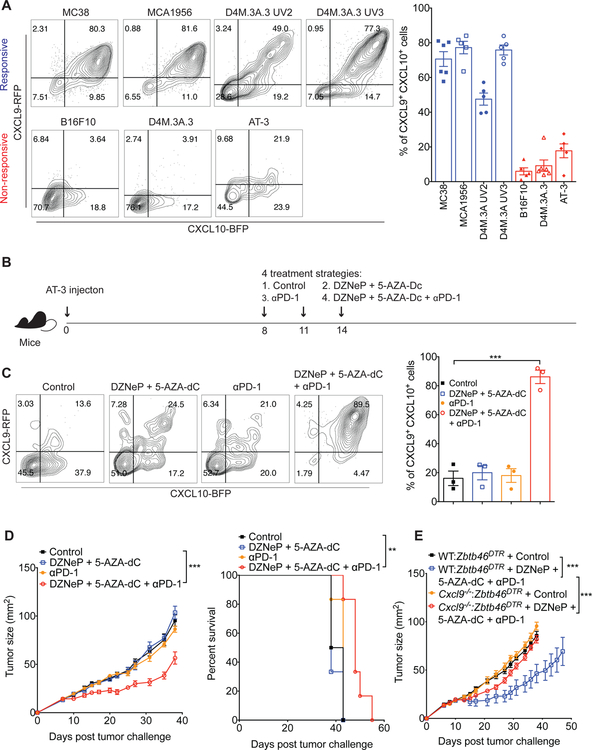
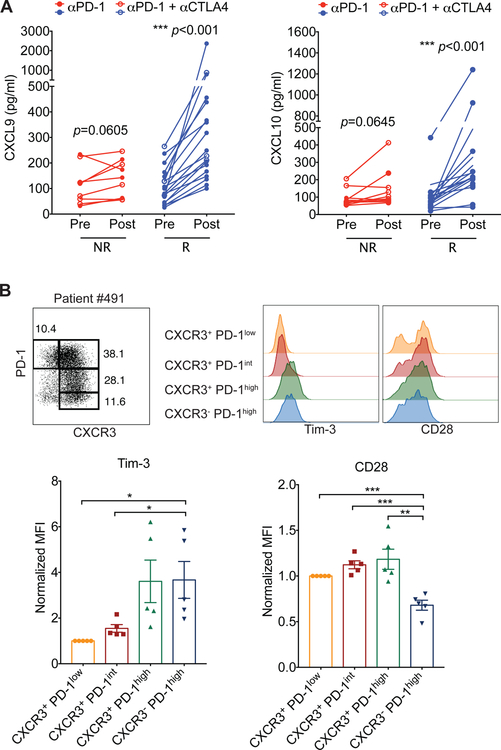
Despite compelling rates of durable clinical responses to programmed cell death-1 (PD-1) blockade, advances are needed to extend these benefits to resistant tumors. We found that tumor-bearing mice deficient in the chemokine receptor CXCR3 responded poorly to anti-PD-1 treatment. CXCR3 and its ligand CXCL9 were critical for a productive CD8+ T cell response in tumor-bearing mice treated with anti-PD-1 but were not required for the infiltration of CD8+ T cells into tumors. The anti-PD-1-induced anti-tumor response was facilitated by CXCL9 production from intratumoral CD103+ dendritic cells, suggesting that CXCR3 facilitates dendritic cell-T cell interactions within the tumor microenvironment. CXCR3 ligands in murine tumors and in plasma of melanoma patients were an indicator of clinical response to anti-PD-1, and their induction in non-responsive murine tumors promoted responsiveness to anti-PD-1. Our data suggest that the CXCR3 chemokine system is a biomarker for sensitivity to PD-1 blockade and that augmenting the intratumoral function of this chemokine system could improve clinical outcomes.

Keywords: CD8(+) T cells; CXCL10; CXCL9; CXCR3; PD-1; chemokine; dendritic cells; immune checkpoint; immunotherapy.


Conflict of interest statement

Declaration of Interests

A.D.L. has consulted for Merck, Lilly, Sanofi, Idera, Receptos, and Celtaxsys. D.E.F. has a financial interest in Soltego, Inc., a company developing SIK inhibitors for topical skin darkening treatments that might be used for a broad set of human applications. Dr. Fisher’s interests were reviewed and are managed by Massachusetts General Hospital and Partners HealthCare in accordance with their conflict of interest policies. G.J.F. has patents/pending royalties on the PD-1 pathway from Roche, Merck, Bristol-Myers-Squibb, EMD-Serono, Boehringer-Ingelheim, AstraZeneca, Dako and Novartis and has served on advisory boards for Roche, Bristol-Myers- Squibb, Xios, and Origimed.

Figures

Figure 1.
Figure 1.. CXCR3 is necessary for response to anti-PD-1 therapy.
(A) Schematic of the anti- PD-1 treatment schedule. Mice were inoculated subcutaneously with 1×10⁶ MC38 tumor cells, and on days 8, 11 and 14 after tumor inoculation, mice were intraperitoneally treated with 200μg of either isotype control or anti-PD-1 antibodies. Tumor growth and survival were monitored until the experimental endpoints. (B) Tumor growth in WT and Cxcr3−/− mice treated with isotype or anti-PD-1 antibodies (n=5–10 mice per group). Data are presented as the mean ± SEM; ***p<0.001, with statistical significance determined by two-way ANOVA. (C) Survival curves of the percentage of mice whose tumor sizes were <100mm2 at each time point. Statistical differences in survival were assessed by a Mantel-Cox log-rank test (**p<0.01). Representative data are shown from two independent experiments. (D-E) Quantification of CD8+ T cell frequencies (D) and cytokine-producing CD8+ T cells (E) within tumors of WT and Cxcr3−/− mice on day 8 after MC38 tumor inoculation. (F-H) Tumors were excised from mice on day 15 of the schedule presented in Figure 1A, followed by quantification of CD8+ T cell frequencies (F), IFN- γ+ TNF-ɑ+ CD8+ T cells (G) and Ki-67+ granzyme B+ CD8+ T cells (H) within tumors of WT and Cxcr3−/− mice treated with isotype or anti-PD-1 antibodies. (G-H) Contour plots and bar graphs reflect the proportion of IFN-γ+ TNF-ɑ+ (G) or Ki-67+ granzyme B+ (H) cells out of total CD8+ T cells. In (D-H) bar graphs represent the mean value of the indicated data points; error bars represent SEM; *p<0.05, **p<0.01, with statistical significance determined by one-way ANOVA with Tukey’s multiple comparison test. Representative data are shown from two independent experiments. See also Figure S1, S2 and S3.
Figure 2.
Figure 2.. Pre-existing intratumoral CD8+ T cell population is sufficient for anti-PD-1- induced tumor control.
(A) Schematic of the anti-PD-1 and FTY720 treatment schedule. Groups of WT mice were inoculated subcutaneously with 1×10⁶ MC38 on day 0. Following tumor inoculation, tumor-bearing mice were intraperitoneally treated with either isotype or anti-PD-1 antibodies (200μg) on days 8, 11 and 14. Administration of DMSO or FTY720 (1mg/kg) was performed at the indicated time points to block the egress of lymphocytes during the course of anti-PD-1 therapy. (B) Representative FACS plots of leukocytes recovered in peripheral blood from mice on day 8 of the schedule presented in Figure 2A (1 day after the 1st dose of FTY720 but before antibody administration). Cells were stained for CD3 and CD45 and analyzed on the gated lymphocyte population. (C) Absolute CD8+ T cell number within tumors of WT mice treated with DMSO control or FTY720 in addition to the anti-PD-1 therapy. Tumors were excised on day 15 of the schedule presented in Figure 2A and FACS analysis of CD8+ T cell number was performed. Data represent the mean ± SEM; *p<0.05, with statistical significance determined by one-way ANOVA with Tukey’s multiple comparison test. Representative data are shown from two independent experiments. (D) Tumor growth and survival of WT mice treated with isotype-matched control or anti-PD-1 antibodies in combination with DMSO or FTY720 as indicated in Figure 2A (n=5–8 mice per group). (E) Groups of WT mice were treated with DMSO or FTY720 (1mg/kg) before tumor inoculation as indicated (n=5 mice per group). 1×10⁶ MC38 was given subcutaneously on day 0, and tumor-bearing mice were intraperitoneally treated with either isotype or anti-PD-1 antibodies (200μg) on days 8, 11 and 14. Tumor growth and survival were monitored until the experimental endpoints. Data represent the mean ± SEM; *p<0.05, ***p<0.001, with statistical significance determined by two- way ANOVA. Survival curves show the percentage of mice whose tumor sizes were <100mm2 at each time point. Statistical differences in survival were assessed by a Mantel-Cox log-rank test (*p<0.05, **p<0.01, ***p<0.001). Data are representative of two independent experiments. (F) Groups of WT and Cxcr3−/− were inoculated subcutaneously with 1×10⁶ MC38 on day 0. Following tumor inoculation, tumor-bearing mice were intraperitoneally treated with FTY720 (1mg/kg) on days 7 and 9 as well as either isotype or anti-PD-1 antibodies (200μg) on day 8. Administration of EdU (50mg/kg) was performed on day 10, followed by quantification of EdU+ CD8+ T cells within tumors on day 11. Contour plots and bar graphs reflect the proportion of EdU+ cells out of total CD8+ T cells in MC38 tumors. Bar graph represents the mean value of the indicated data points; error bars represent SEM; *p<0.05, ***p<0.001, with statistical significance determined by one-way ANOVA with Tukey’s multiple comparison test. Representative data are shown from two independent experiments. See also Figure S4.
Figure 3.
Figure 3.. CXCR3 expressed on CD8+ T-cells is required for anti-PD-1-mediated CD8+ T cell activation.
(A-D) Bone marrow cells from CD45.1+ WT mice and CD45.2+ Cxcr3−/− mice were mixed in a 50:50 ratio and injected into lethally irradiated WT recipient mice. Eight weeks after transplant, 1×10⁶ MC38 cells were injected subcutaneously into chimeric mice. Following tumor inoculation, administration of DMSO control or FTY720 (1mg/kg) started one day before isotype or anti-PD-1 treatment (200μg; day 8, 11 and 14), and continued every second day. Flow plot at the right panel reflects the proportion of CD45.1+ WT and CD45.2+ Cxcr3−/− donor cells in a recipient mouse after reconstitution. Tumors were excised on day 15 and FACS analyses performed to determine the percentages of total WT and Cxcr3−/− CD8+ T cells (B), antigen- specific CD8+ T cells (C) and cytokine-producing CD8+ T cells (D) within tumors of mixed bone marrow chimeric mice (n=5 mice per group). Data are presented as the mean ± SEM; *p<0.05, **p<0.01, ***p<0.001 with statistical significance determined by Student’s t-test. Data are representative of two independent experiments. (E-I) 1×10⁶ MC38 cells were injected subcutaneously into CXCR3-GFP reporter (CIBER) mice and tumors were harvested on day 8 for analysis. (E) Identification of four subsets of dysfunctional CD8+ T cells based on CXCR3 and PD-1 expression. (F) Surface expression of Tim-3, LAG-3, TIGIT, CD44, CD28 and CD137 on different subsets of CD8+ T cells. (G-H) Contour plots and bar graphs reflect the proportion of IFN-γ+ TNF-ɑ+ (G) or granzyme B+ (H) cells within different subsets of CD8+ T cells. Bar graphs represent the mean value of the indicated data points; error bars represent SEM; *p<0.05, ***p<0.001, with statistical significance determined by one-way ANOVA with Tukey’s multiple comparison test. Representative data are shown from two independent experiments. (I) Frequency of CD8+ T cell subsets within tumors at different times following inoculation.
Figure 4.
Figure 4.. Host-derived CXCL9 is required for response to anti-PD-1.
(A) Quantitative RT- PCR analysis of Cxcl9 and Cxcl10 mRNA expression in MC38 tumors from WT mice 24 hours after treatment with the first dose of isotype or anti-PD-1 antibodies. Data are presented as cDNA copies of indicated gene per copy of GAPDH. Data are mean ± SEM; *p<0.05, with statistical significance determined by Student’s t-test. Data are representative of two independent experiments. (B) Quantitative protein analysis of CXCL9 and CXCL10 in MC38 tumors from WT mice 48 hours after treatment with the first dose of isotype or anti-PD-1 antibodies. Data are mean ± SEM; *p<0.05, with statistical significance determined by Student’s t-test. Data are representative of two independent experiments. (C) Tumor growth and survival of WT mice treated with isotype or anti-PD-1 antibodies in combination with FTY720 or DMSO control and/or antibodies against CXCL9 and CXCL10 as indicated (n=5–10 mice per group). Administration of DMSO control or FTY720 (1mg/kg) started one day before isotype or anti-PD-1 treatment (200μg; days 8, 11 and 14), and continued every second day until day 19. To neutralize CXCR3 ligands, anti-CXCL9 and anti-CXCL10 antibodies were injected intraperitoneally into mice on days 7, 11, 15 and 19 (initial dose: 200μg of each antibody; maintenance dose: 100μg of each antibody). Data represent the mean ± SEM; *p<0.05, with statistical significance determined by two-way ANOVA. Survival curves show the percentage of mice whose tumor sizes were <100mm2 at each time point. Statistical differences in survival were assessed by a Mantel-Cox log-rank test (*p<0.05). Data are representative of two independent experiments. (D) Tumor growth in WT, Cxcl9−/− and Cxcl10−/− mice treated with isotype control or anti-PD-1 antibodies (n=5–10 mice per group) according to the schedule presented in Figure 1A. Data represent the mean ± SEM; *p<0.05, **p<0.01, ***p<0.001, with statistical significance determined by two-way ANOVA. Survival curves show the percentage of mice whose tumor sizes were <100mm2 at each time point. Statistical differences in survival were assessed by a Mantel-Cox log-rank test (**p<0.01). Representative data are shown from two independent experiments. (E) Tumors were excised from mice on day 15 of the schedule presented in Figure 1A, followed by quantification of IFN-γ+ TNF-ɑ+ CD8+ T cells (left panel) and Ki-67+ granzyme B+ CD8+ T cells (right panel) within tumors of WT and Cxcl9−/− mice treated with isotype or anti-PD-1 antibodies. Percentages reflect the proportion of IFN-γ+ TNF-ɑ+ or Ki-67+ granzyme B+ out of total CD8+ T cells. Bar graphs represent the mean values of the indicated data points, and the error bars represent SEM; *p<0.05, **p<0.01, with statistical significance determined by one-way ANOVA with Tukey’s multiple comparison test. Data are representative of two independent experiments. See also Figure S5.
Figure 5.
Figure 5.. CD103+ DC-derived CXCL9 is important for the efficacy of PD-1 blockade.
(A) Representative flow cytometry gating strategy for determination of CXCL9 and CXCL10 expression in tumor-infiltrating DC subpopulations (CD103+ DC and CD11b+ DC) within MC38 tumors harvested from the CXCL9-CXCL10 dual reporter (REX3) transgenic mice. (B-C) MC38 tumors were excised from REX3 transgenic mice on day 15 following treatment with isotype or anti-PD-1 antibodies according to the schedule presented in Figure 1A and were analyzed for CXCL9-RFP expression in CD103+ DC and CD11b+ DC (gated on CD45+ CD3 CD19 CD11c+ MHCII+ as demonstrated in Figure 5A). Bar graph represent the mean values of the indicated data points, and the error bars represent SEM; ***p<0.001, with statistical significance determined by one-way ANOVA with Tukey’s multiple comparison test. Representative data are shown from two independent experiments. (D-E) Bone marrow cells from CD45.1+ CD45.2+ Zbtb46DTR mice were mixed in a 50:50 ratio with bone marrow cells from CD45.2+ WT, Cxcl9−/− or Cxcl10−/− mice and injected into lethally irradiated CD45.1+ WT recipient mice. Eight weeks after transplant, 1×10⁶ MC38 cells were injected subcutaneously into chimeric mice. Following tumor inoculation, administration of FTY720 (1mg/kg) and DT (20μg/kg) started one day before isotype or anti-PD-1 treatment (200μg; on day 8, 11 and 14), and continued until day 19 as indicated. Tumor growth and survival were monitored until the experimental endpoints (n=5–10 mice per group). Data are given as the mean ± SEM; ***p<0.001, with statistical significance determined by two-way ANOVA. Survival curves show the percentage of mice whose tumor sizes were <100mm2 at each time point. Statistical differences in survival were assessed by a Mantel-Cox log-rank test (**p<0.01). Representative data are shown from two independent experiments. See also Figure S5 and S6.
Figure 6.
Figure 6.. The combination of epigenetic modulators and anti-PD-1 increases CXCR3 ligand expression and converts non-responders to responders.
(A) Expression of CXCL9 and CXCL10 in gated CD11c+ MHCII+ cells within the indicated solid tumors of REX3 transgenic mice. Bar graph represents the mean values of the indicated data points, and the error bars represent SEM. (B) Schematic of experimental design for the treatment schedule for the epigenetic modulators and anti-PD-1. Orthotopic injection of AT-3 tumor cells (1×10⁶) into the mammary fat pad of mice was performed on day 0. Following tumor inoculation, tumor-bearing mice were treated with four different treatment schemes on day 8, 11 and 14: (1) control; (2) DZNeP (5mg/kg) + 5-AZA-Dc (0.2mg/kg); (3) anti-PD-1 (200μg); and (4) DZNeP (5mg/kg) + 5-AZA-Dc (0.2mg/kg) + anti-PD-1 (200μg). (C) Tumors were excised from REX3 transgenic mice on day 15 of the schedule presented in Figure 6B, followed by analysis of CXCL9 and CXCL10 expression in CD11c+ MHCII+ cells from AT-3 tumors of REX3 transgenic mice treated with control, epigenetic modulators, anti-PD-1 or a combination of epigenetic modulators and anti-PD-1 antibody. Bar graph represent the mean values of the indicated data points, and the error bars represent SEM; ***p<0.001, with statistical significance determined by Student’s t-test. Representative data are shown from two independent experiments. (D) AT-3 tumor growth in WT mice that were treated with control, epigenetic modulators, anti-PD-1 or a combination of epigenetic modulators and anti-PD-1 (n=6 mice per group). Data represent the mean ± SEM; ***p<0.001, with statistical significance determined by two-way ANOVA. Survival curves show the percentage of mice whose tumor sizes were <100mm2 at each time point. Statistical differences in survival were assessed by a Mantel-Cox log-rank test (**p<0.01). Data are representative of two independent experiments. (E) 1×10⁶ AT3 tumor cells were injected into the mammary fat pad of chimeric mice, which were generated using the protocol presented in Figure 5D. Following tumor inoculation, administration of DT (20μg/kg) started one day before control or a combination of epigenetic modulators and anti-PD-1 treatment, and continued until day 19. Tumor growth was monitored until the experimental endpoints (n=5–8 mice per group). Data are given as the mean ± SEM; ***p<0.001, with statistical significance determined by two- way ANOVA.
Figure 7.
Figure 7.. CXCL9 and CXCL10 expression correlates with response to PD-1 blockade therapy.
(A) Levels of CXCL9 and CXCL10 in plasma samples from non-responders (NR) (red) (n=10) and responders (R) (blue) (n=18) before (Pre) and after treatment (Post) with anti-PD-1 (closed symbols) or anti-PD-1 plus anti-CTLA-4 (open symbols). Statistical differences were determined by Wilcoxon matched-pairs signed rank test. (B) Identification of four subsets of dysfunctional CD8+ T cells within tumors based on the cell surface expression of CXCR3 and PD-1 in melanoma patients (top left panel). Surface expression of Tim-3 and CD28 on different subsets of CD8+ T cells (top right panel). Bar graph shows the normalized MFI of Tim-3 and CD28 expression on CD8+ T cell subsets (bottom panel). MFI of Tim-3 and CD28 expression on each subset was normalized to the MFI of Tim-3 or CD28, respectively, on the CXCR3+ PD-1low CD8 T cell population in each individual patient. See also Figure S7 and Table S1.

Comment in

  • Predicting the anti-PD1 response.
    Minton K. Minton K. Nat Rev Immunol. 2019 Jul;19(7):414-415. doi: 10.1038/s41577-019-0184-x. Nat Rev Immunol. 2019. PMID: 31150011 No abstract available.
  • CXCR3-CXCL9: It's All in the Tumor.
    Humblin E, Kamphorst AO. Humblin E, et al. Immunity. 2019 Jun 18;50(6):1347-1349. doi: 10.1016/j.immuni.2019.05.013. Immunity. 2019. PMID: 31216458

References

    1. Ahrends T, Spanjaard A, Pilzecker B, Bąbała N, Bovens A, Xiao Y, Jacobs H, and Borst J (2017). CD4+ T cell help confers a cytotoxic T cell effector program including coinhibitory receptor downregulation and increased tissue invasiveness. Immunity 47, 848–861. - PubMed
    1. Berghuis D, Santos SJ, Baelde HJ, Taminiau AH, Maarten Egeler R, Schilham MW, Hogendoorn PC, and Lankester AC (2011). Pro‐inflammatory chemokine-chemokine receptor interactions within the Ewing sarcoma microenvironment determine CD8+ T‐lymphocyte infiltration and affect tumour progression. J. Pathol 223, 347–357. - PubMed
    1. Bindea G, Mlecnik B, Tosolini M, Kirilovsky A, Waldner M, Obenauf AC, Angell H, Fredriksen T, Lafontaine L, Berger A, et al. (2013). Spatiotemporal dynamics of intratumoral immune cells reveal the immune landscape in human cancer. Immunity 39, 782–795. - PubMed
    1. Chew V, Chen J, Lee D, Loh E, Lee J, Lim KH, Weber A, Slankamenac K, Poon RT, Yang H, et al. (2012). Chemokine-driven lymphocyte infiltration: an early intratumoural event determining long-term survival in resectable hepatocellular carcinoma. Gut 61, 427–438. - PMC - PubMed
    1. Christen U, McGavern DB, Luster AD, von Herrath MG, and Oldstone MB (2003). Among CXCR3 chemokines, IFN-γ-inducible protein of 10 kDa (CXC chemokine ligand (CXCL) 10) but not monokine induced by IFN-γ (CXCL9) imprints a pattern for the subsequent development of autoimmune disease. J. Immunol 171, 6838–6845. - PubMed

Publication types

MeSH terms