. 2019 Jul 1;216(7):1542-1560.
doi: 10.1084/jem.20182386. Epub 2019 May 16.

Sex-specific effects of microbiome perturbations on cerebral Aβ amyloidosis and microglia phenotypes

Affiliations

Sex-specific effects of microbiome perturbations on cerebral Aβ amyloidosis and microglia phenotypes

Hemraj B Dodiya et al. J Exp Med. .

Abstract

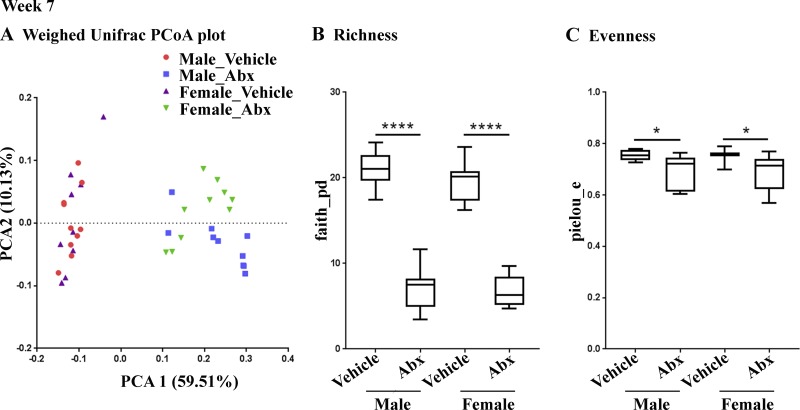
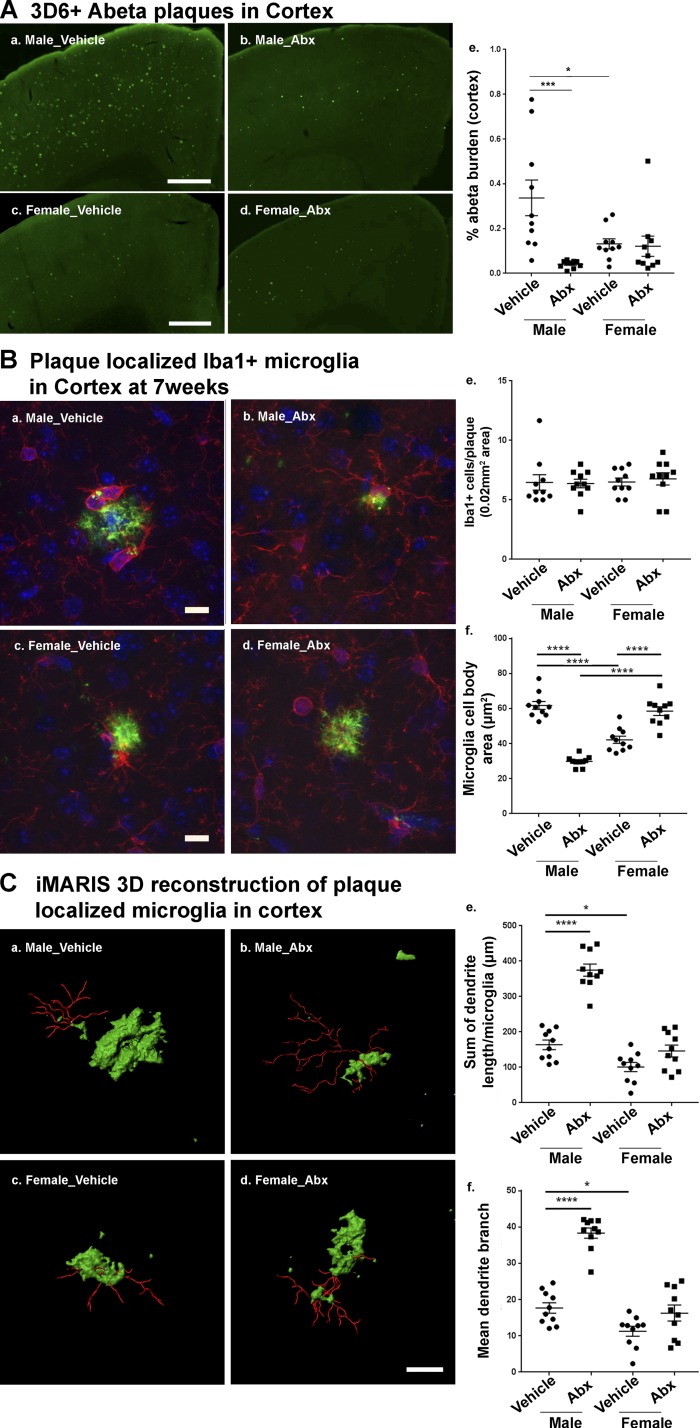
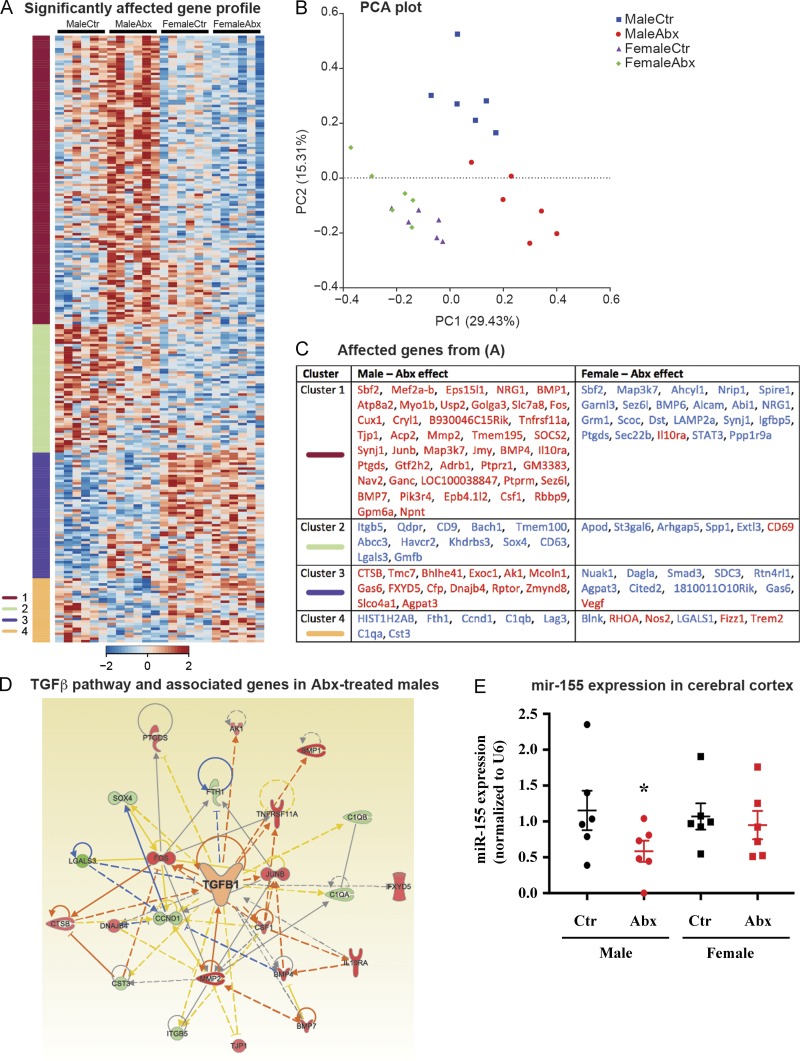
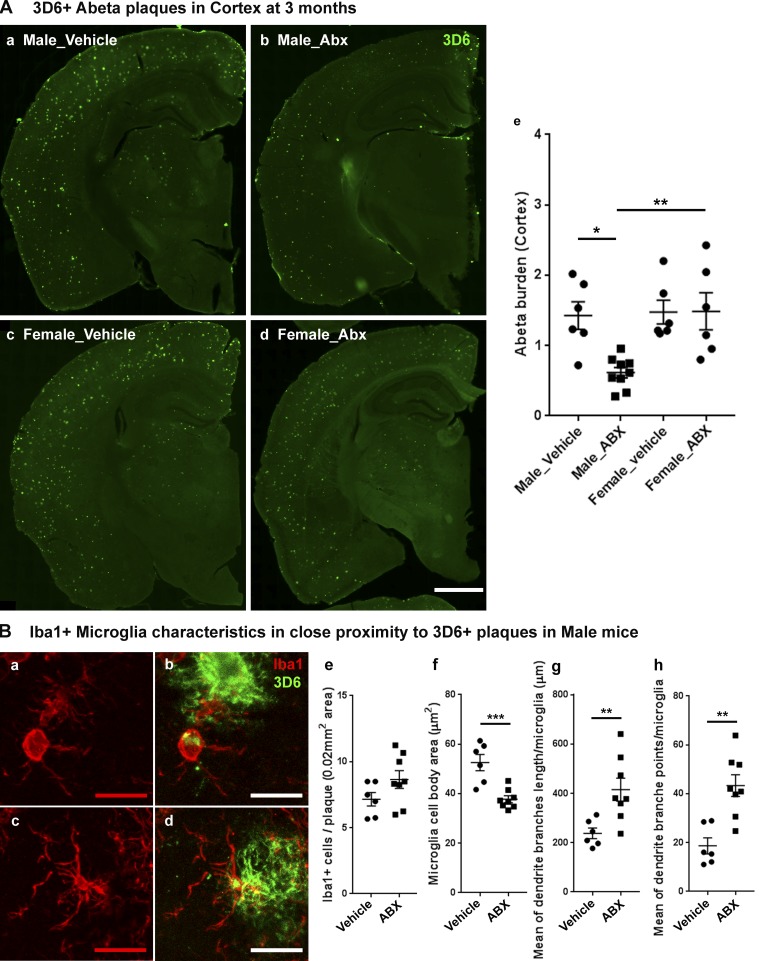
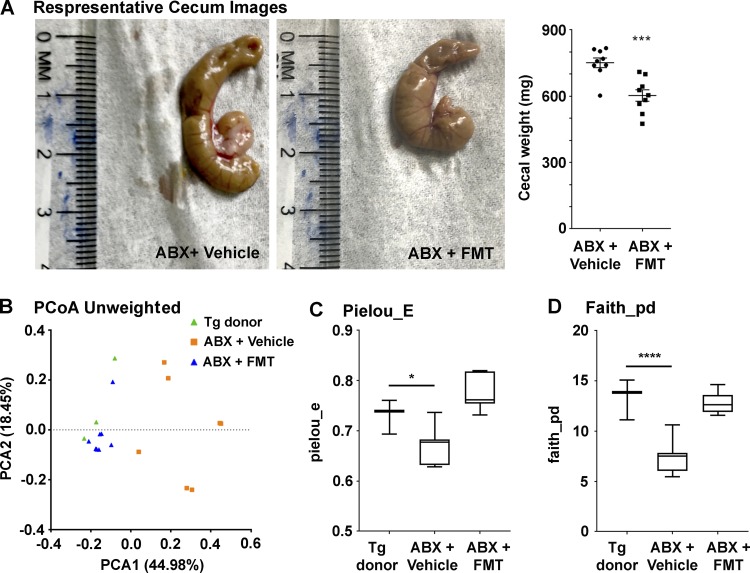
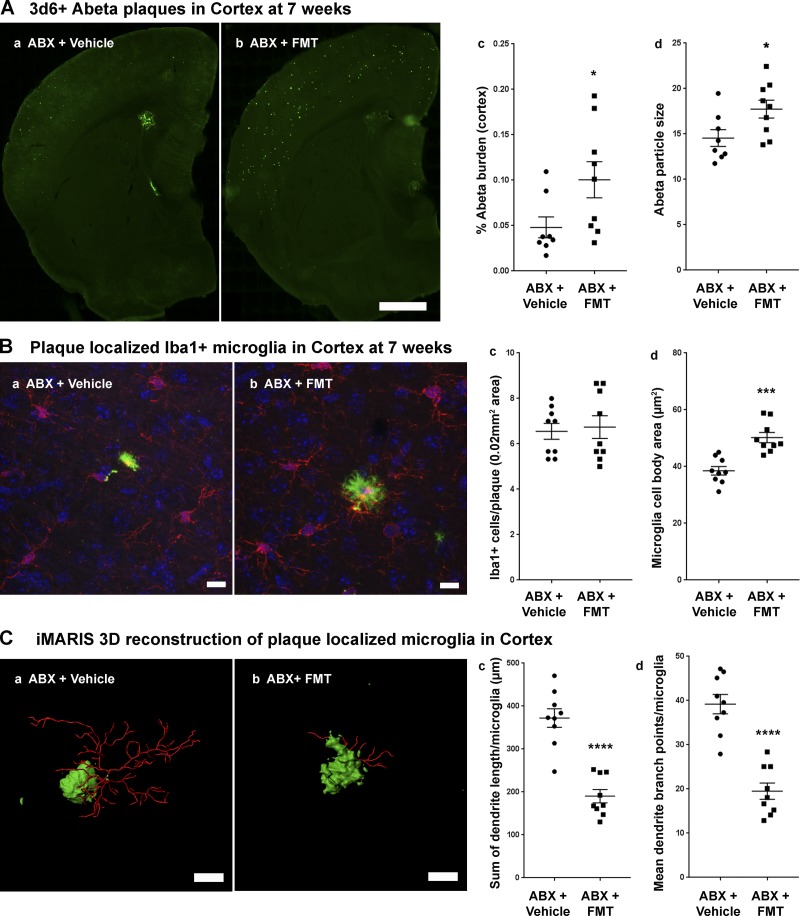
We demonstrated that an antibiotic cocktail (ABX)-perturbed gut microbiome is associated with reduced amyloid-β (Aβ) plaque pathology and astrogliosis in the male amyloid precursor protein (APP)SWE /presenilin 1 (PS1)ΔE9 transgenic model of Aβ amyloidosis. We now show that in an independent, aggressive APPSWE/PS1L166P (APPPS1-21) mouse model of Aβ amyloidosis, an ABX-perturbed gut microbiome is associated with a reduction in Aβ pathology and alterations in microglial morphology, thus establishing the generality of the phenomenon. Most importantly, these latter alterations occur only in brains of male mice, not in the brains of female mice. Furthermore, ABX treatment lead to alterations in levels of selected microglial expressed transcripts indicative of the "M0" homeostatic state in male but not in female mice. Finally, we found that transplants of fecal microbiota from age-matched APPPS1-21 male mice into ABX-treated APPPS1-21 male restores the gut microbiome and partially restores Aβ pathology and microglial morphology, thus demonstrating a causal role of the microbiome in the modulation of Aβ amyloidosis and microglial physiology in mouse models of Aβ amyloidosis.


Figures

Figure 1.
Figure 1.
ABX treatment results in microbiome changes in male and female APPPS1-21 mice (n = 10/group). (A) The PCoA plot at week 7 generated by using weighted versions of the UniFrac distance metric. The two components explained 59.51% of the variance. (B and C) At week 7 also, both α diversity values (species richness and evenness) were significantly lower in the ABX treatment group compared with the control (Faith’s phylogenetic diversity [B]: two-way ANOVA, F[1,35] = 367.6, P < 0.0001; Pielou’s evenness [C]: two-way ANOVA, F[1,35] = 14.73, P = 0.0005). Sex or an interaction between sex and ABX treatment showed no significant difference in either richness or evenness (P > 0.05). Post hoc comparisons showed reduced diversity in ABX-treated male (Faith: P < 0.0001, Pielou: P = 0.049) and ABX-treated female (Faith: P < 0.0001, Pielou: P = 0.0462) mice compared with their vehicle-treated counterparts. Data are mean ± SEM. *, P < 0.05; ****, P < 0.0001. n = 10/group. PCA1, principal coordinate 1; PCA2, principal coordinate 2.
Figure 2.
Figure 2.
Reductions in Aβ pathology and altered plaque-localized microglial phenotypes are only observed in ABX-treated male APPPS1-21 mice. (A) Representative images of Aβ plaque burden in the cortex of vehicle (a and c) and ABX-treated (b and d) in 7-wk-old APPPS1-21 mice using anti-Aβ monoclonal antibody, 3D6. (a and b) Male vehicle vs. ABX, respectively; (c and d) female vehicle vs. ABX, respectively. (e) Quantification of plaque burden in vehicle- and ABX-treated APPPS1-21 mice using threshold-limited particle analysis of 3D6+-positive staining from six sections per case and expressed relative to the total cortical area of each slice. Aβ burden analysis revealed a significant effect of ABX (two-way ANOVA: F[1, 36] = 10.58, P = 0.0025) and an interaction (F[1, 36] = 9.145, P = 0.0046) while sex showed no significant effect (F[1, 36] = 1.76, P = 1929). (B) Representative images of microglial cells using Iba1 antibody. No differences in total Iba1-positive cells were observed in vehicle versus ABX treatment irrespective of sex (male: a, b, and e; female: c, d, and e; two-way ANOVA—ABX treatment: F[1, 36] = 0.036, P = 0.85; or sex: F[1,36] = 0.19, P = 0.668; or an interaction between ABX treatment and sex: F[1,36] = 0.131, P = 0.718). In contrast, the area of Iba1-positive cell bodies was significantly reduced in ABX treated male mice (b and f) but not in females (d and f; two-way ANOVA—ABX treatment: F[1, 36] = 14.77, P = 0.0005; sex: F[1, 36] = 4.97, P = 0.0321; and an interaction: F[1, 36] = 142.2, P < 0.0001). Control male mice showed larger cell bodies compared with control female mice (P < 0.0001). ABX treatment resulted in significantly smaller cell bodies in males (P < 0.0001) and larger cell bodies in females (P < 0.0001) compared with their respective controls. (C) Imaris 3D reconstruction showed significantly different microglia morphology characteristics in males (a and b) compared with females (c and d) after ABX treatment (microglial branch length—two-way ANOVA: F[1, 36] = 70.77, P < 0.0001; microglial branch end points: F[1, 36] = 61.24, P < 0.0001), with sex (microglial branch length: F[1, 36] = 91.42, P < 0.0001; microglial branch end points: F[1, 36] = 75.38, P < 0.0001), and an interaction (microglial branch length: F[1, 36] = 29.63, P < 0.0001; microglial branch end points: F[1, 36] = 22.73, P < 0.0001). Vehicle-treated male mice showed significantly longer branch lengths (a; quantified in e, P = 0.029) and number of branch points (a; quantified in f, P = 0.04) compared with vehicle-treated females (c). ABX treatment resulted in significantly longer branch lengths (b; quantified in e, P < 0.0001) and increased numbers of branch points (b; quantified in f, P < 0.0001) in male mice. Scale bars in A (a–d), B (a–d), and C (a–d) represent 500 µm, 10 µm, and 10 µm, respectively. Data are mean ± SEM. *, P < 0.05; ***, P < 0.001; ****, P < 0.0001; n = 10/group.
Figure 3.
Figure 3.
ABX treatment restores TGFβ signaling and the microglial homeostatic signature in the cerebral cortex of APPPS1-21 male mice. (A) K-means clustering of 246 significantly affected genes in RNA samples extracted from cortex tissue lysates from vehicle and Abx-treated APPPS1-21 male and female mice by using NanoString analysis. Vertical lanes are biological replicates per treatment and sex. (B) A principal component analysis (PCA) plot based on significantly affected genes between treatment and sex groups. (C) Student’s t tests within each sex and between ABX-treated and -untreated mice were conducted on the genes within each cluster from A to reveal significantly affected genes based on ABX treatment (P < 0.05). Genes in red are up-regulated, and genes in blue are down-regulated. (D) Ingenuity pathway analysis shows up-regulation of the TGFβ pathway–related molecules in tissue from ABX-treated male mice. (E) Quantitative PCR analysis of ABX-treated male and female mice revealed a significant decrease (P < 0.05) of miR-155 expression in ABX-treated male but not female mice. Data are mean ± SEM. *, P < 0.05. n = 6/group. Ctr, control.
Figure 4.
Figure 4.
Reduced Aβ pathology and altered microglial phenotypes in cerebral cortex of ABX-treated male APPPS1-21 mice at 3 mo of age. (A) Representative images of Aβ plaque burden in the vehicle (a and c) and ABX (b and d) treated male (a and b) and female (c and d) mice using 3D6 antibody (e). Aβ burden was significantly lower in ABX-treated male mice (n = 8) compared with vehicle-treated male mice (P = 0.0116) while female mice showed no significant differences in Aβ burden (P > 0.05) with ABX treatment (two-way ANOVA—ABX treatment: F[1, 23] = 5.419, P = 0.0291; sex: F[1, 23] = 7.173, P = 0.0134, and an interaction: F[1, 23] = 5.707, P = 0.0255). (B) Representative images (a–d) of Iba1-positive microglial cells in close proximity to 3D6+ immunostained Aβ plaque (<0.07-mm radial distance from plaque) in 3-mo-old male mice. (e) Cell count analysis showed no significant differences between vehicle- or ABX-treated male mice; (unpaired Student’s t test: t[12] = 1.661, P = 0.1225). ABX treatment (c and d) resulted in smaller cell bodies compared with vehicle-treated (a and b) male mice (f; unpaired Student’s t test: t[12] = 4.573, P = 0.0006). Imaris 3D reconstruction (g and h) showed significantly different microglial characteristics between vehicle- and ABX-treated male APPPS1 mice. Branch length/microglia (g) showed significantly higher branch length in ABX-treated mice (unpaired Student’s t test: t[12] = 3.096, P < 0.0093). Moreover, ABX-treated mice also showed significantly higher numbers of branch points per plaque localized microglia (h; unpaired Student’s t test: t[12] = 4.178, P < 0.0013). Scale bars in A (a, b, c, and d) and B (a, b, c, and d) represent 1,000 µm and 10 µm, respectively. Data are mean ± SEM. *, P < 0.05; **, P < 0.01; ***, P < 0.001. Male_vehicle: n = 6. Male_ABX: n = 8. Female_vehicle: n = 6. Female_ABX: n = 6.
Figure 5.
Figure 5.
FMT reverts ABX-associated changes in the gut microbiome (n = 9/group). (A) Cecum weights from vehicle- or FMT-treated ABX-treated male mice. FMT introduced into ABX-treated APPPS1-21 male mice lead to reduced cecum weight (unpaired Student’s t test: t[16] = 4.372, P = 0.0005). (B) PCoA plot generated by using unweighted versions of the UniFrac distance metric. The two components explained 44.98% of the variance. FMT-treated ABX-treated male mice showed no clear separation compared with the donor fecal microbiome while vehicle-treated ABX-treated male mice showed a clear separation compared with the other two groups. The α diversity was measured by using Pielou’s evenness (Pielou_E; C) and Faith's phylogenetic diversity (Faith_pd; D) indices. FMT treatment restored the microbiome diversity as measured by both Faith’s phylogenetic diversity (one-way ANOVA: F[2,16] = 32.91, P < 0.0001) and Pielou’s evenness (one-way ANOVA: F[2,16] = 18.7, P < 0.0001). Data are mean ± SEM. *, P < 0.05; ***, P < 0.001; ****, P < 0.0001. n = 9/group. PCA1, principal coordinate 1; PCA2, principal coordinate 2.
Figure 6.
Figure 6.
FMT from APPPS1-21 male mice to ABX-treated APPPS1-21 male mice resulted in restoration of Aβ pathology and microglial phenotypes. (A) Representative images of Aβ plaque burden in the cortex of vehicle- (a) and FMT-treated ABX-treated mice (b) using 3D6 antibody. (c) Quantification of plaque burden in vehicle- and FMT-treated ABX-treated male mice. Aβ burden was significantly higher in ABX+FMT–treated mice compared with ABX+vehicle–treated mice (two-tailed Student’s t test: t[15] = 2.209, P = 0.0431). (d) Aβ particle size was also significantly higher in ABX+FMT–treated mice compared with ABX+vehicle–treated mice (two-tailed Student’s t test: t[15] = 2.355, P = 0.0326). (B) Representative images of Iba1-positive microglial cells (a and b). (c) Cell count analysis showed no significant differences between ABX+vehicle–treated mice (a) versus ABX+FMT–treated mice (b; unpaired Student’s t test: t[16] = 0.3026, P = 0.7661). However, FMT resulted in larger cell bodies compared with vehicle-treated ABX-treated male mice (d; unpaired Student’s t test: t[16] = 4.968, P = 0.0001). (C) Imaris 3D reconstruction showed significantly different microglial characteristics between vehicle-treated (a) and FMT-treated (b) ABX-treated male mice. Branch length/microglia (c) showed significantly lower branch length in ABX+FMT–treated mice (unpaired Student’s t test: t[16] = 6.823, P < 0.0001). Moreover, ABX+FMT–treated mice showed significantly lower numbers of branch points per plaque-localized microglia (d; unpaired Student’s t test: t[16] = 6.876, P < 0.0001). Scale bars in A (a and b), B (a and b), and C (a and b) represent 1,000 µm, 10 µm, and 10 µm, respectively. Data are mean ± SEM. *, P < 0.05; ***, P < 0.001; ****, P < 0.0001. n = 8–9/group.

References

    1. Bäuerl C., Collado M.C., Diaz Cuevas A., Viña J., and Pérez Martínez G.. 2018. Shifts in gut microbiota composition in an APP/PSS1 transgenic mouse model of Alzheimer’s disease during lifespan. Lett. Appl. Microbiol. 66:464–471. 10.1111/lam.12882 - DOI - PubMed
    1. Belkaid Y., and Naik S.. 2013. Compartmentalized and systemic control of tissue immunity by commensals. Nat. Immunol. 14:646–653. 10.1038/ni.2604 - DOI - PMC - PubMed
    1. Berer K., Gerdes L.A., Cekanaviciute E., Jia X., Xiao L., Xia Z., Liu C., Klotz L., Stauffer U., Baranzini S.E., et al. . 2017. Gut microbiota from multiple sclerosis patients enables spontaneous autoimmune encephalomyelitis in mice. Proc. Natl. Acad. Sci. USA. 114:10719–10724. 10.1073/pnas.1711233114 - DOI - PMC - PubMed
    1. Brandscheid C., Schuck F., Reinhardt S., Schäfer K.H., Pietrzik C.U., Grimm M., Hartmann T., Schwiertz A., and Endres K.. 2017. Altered Gut Microbiome Composition and Tryptic Activity of the 5xFAD Alzheimer’s Mouse Model. J. Alzheimers Dis. 56:775–788. 10.3233/JAD-160926 - DOI - PubMed
    1. Braniste V., Al-Asmakh M., Kowal C., Anuar F., Abbaspour A., Tóth M., Korecka A., Bakocevic N., Ng L.G., Kundu P., et al. . 2014. The gut microbiota influences blood-brain barrier permeability in mice. Sci. Transl. Med. 6:263ra158 10.1126/scitranslmed.3009759 - DOI - PMC - PubMed

Publication types

Substances