. 2019 Jul 17;39(29):5760-5772.
doi: 10.1523/JNEUROSCI.3085-18.2019. Epub 2019 May 16.

Increased Lysosomal Exocytosis Induced by Lysosomal Ca2+ Channel Agonists Protects Human Dopaminergic Neurons from α-Synuclein Toxicity

Affiliations

Increased Lysosomal Exocytosis Induced by Lysosomal Ca2+ Channel Agonists Protects Human Dopaminergic Neurons from α-Synuclein Toxicity

Taiji Tsunemi et al. J Neurosci. .

Abstract

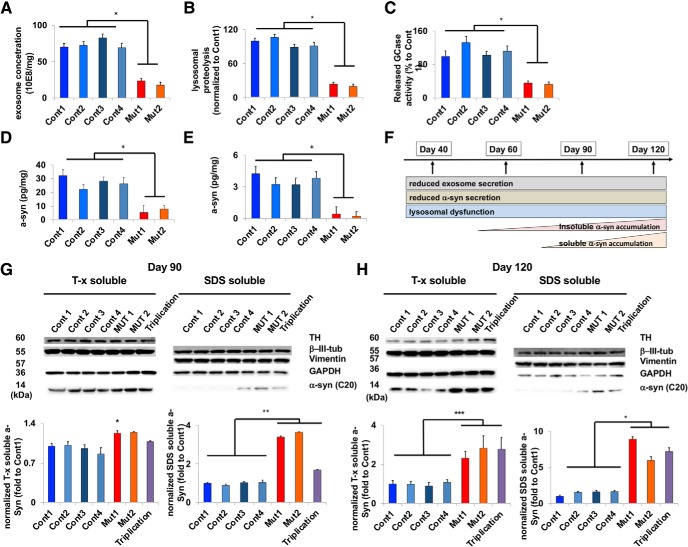
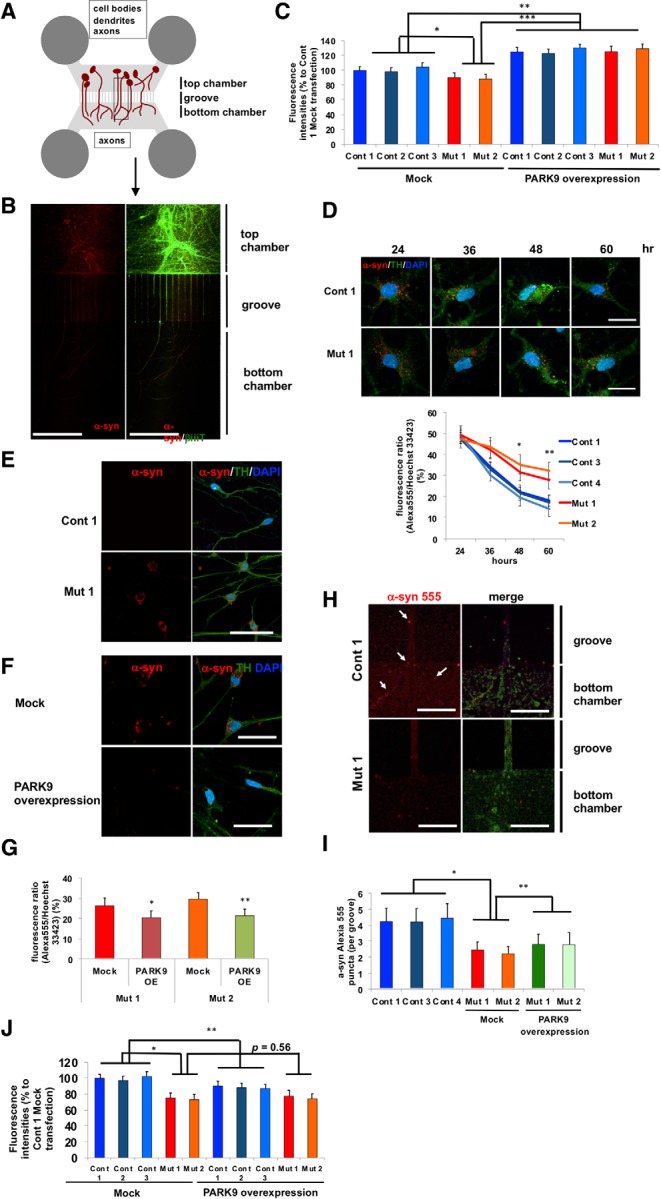
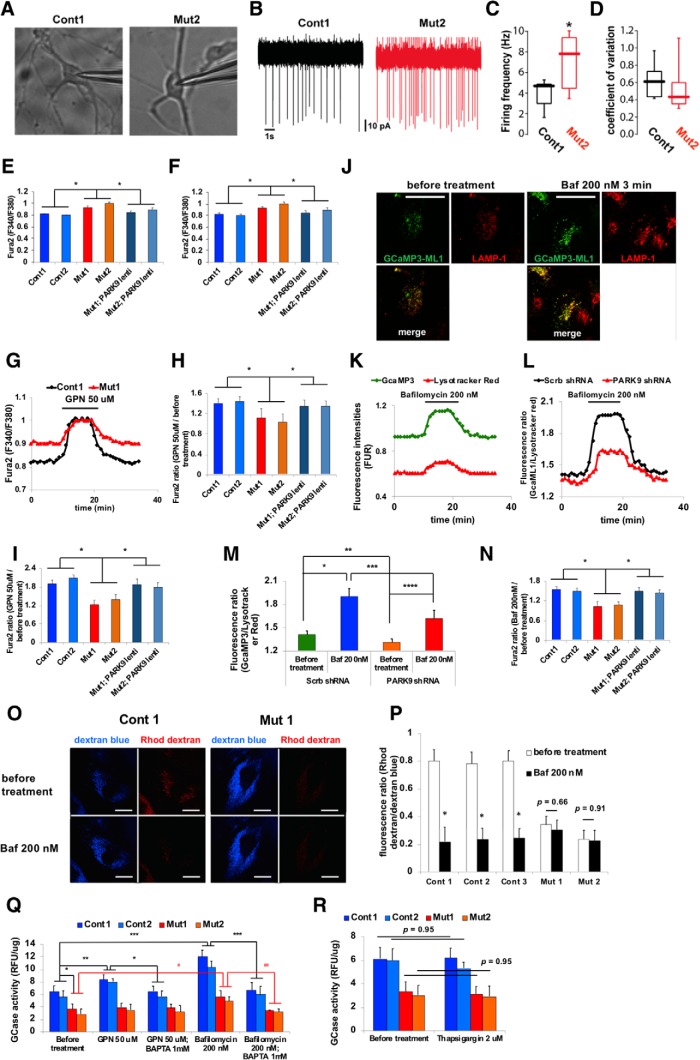
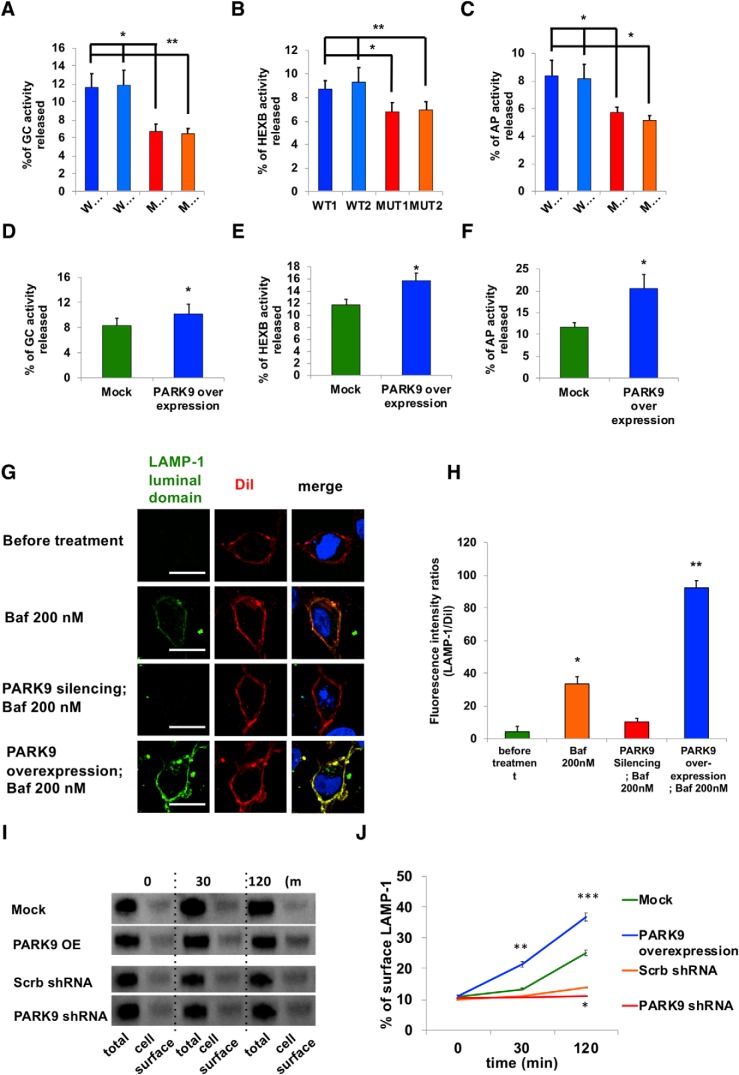
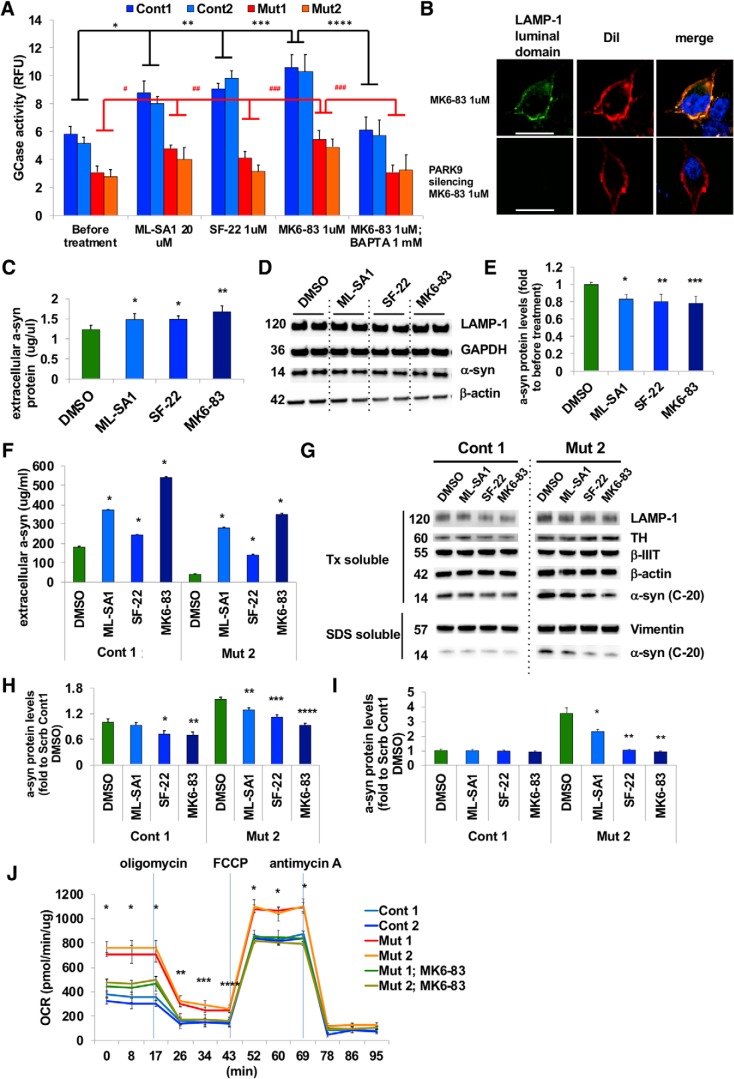
The accumulation of misfolded proteins is a common pathological feature of many neurodegenerative disorders, including synucleinopathies such as Parkinson's disease (PD), which is characterized by the presence of α-synuclein (α-syn)-containing Lewy bodies. However, although recent studies have investigated α-syn accumulation and propagation in neurons, the molecular mechanisms underlying α-syn transmission have been largely unexplored. Here, we examined a monogenic form of synucleinopathy caused by loss-of-function mutations in lysosomal ATP13A2/PARK9. These studies revealed that lysosomal exocytosis regulates intracellular levels of α-syn in human neurons. Loss of PARK9 function in patient-derived dopaminergic neurons disrupted lysosomal Ca2+ homeostasis, reduced lysosomal Ca2+ storage, increased cytosolic Ca2+, and impaired lysosomal exocytosis. Importantly, this dysfunction in lysosomal exocytosis impaired α-syn secretion from both axons and soma, promoting α-syn accumulation. However, activation of the lysosomal Ca2+ channel transient receptor potential mucolipin 1 (TRPML1) was sufficient to upregulate lysosomal exocytosis, rescue defective α-syn secretion, and prevent α-syn accumulation. Together, these results suggest that intracellular α-syn levels are regulated by lysosomal exocytosis in human dopaminergic neurons and may represent a potential therapeutic target for PD and other synucleinopathies.SIGNIFICANCE STATEMENT Parkinson's disease (PD) is the second most common neurodegenerative disease linked to the accumulation of α-synuclein (α-syn) in patient neurons. However, it is unclear what the mechanism might be. Here, we demonstrate a novel role for lysosomal exocytosis in clearing intracellular α-syn and show that impairment of this pathway by mutations in the PD-linked gene ATP13A2/PARK9 contributes to α-syn accumulation in human dopaminergic neurons. Importantly, upregulating lysosomal exocytosis by increasing lysosomal Ca2+ levels was sufficient to rescue defective α-syn secretion and accumulation in patient neurons. These studies identify lysosomal exocytosis as a potential therapeutic target in diseases characterized by the accumulation of α-syn, including PD.

Keywords: Kufor–Rakeb syndrome; Parkinson's disease; TRPML1; alpha synuclein; dopaminergic neuron; lysosomal exocytosis.


Figures

Figure 1.
Figure 1.
Differentiated from induced pluripotent stem cells (Figure 1-1), PARK9 patient DA neurons (Figure 1-2) develop pathogenic phenotypes including lysosomal dysfunction and time-dependent α-syn accumulation (Figure 1-3). A, Number of exosomes secreted from four control and two PARK9 mutant DA neurons were analyzed at day 40 after the initiation of differentiation. The number of exosomes was normalized by total protein in cell lysates (n = 3, *p = 0.0001). B, Lysosomal proteolysis measured by radioactive pulse chase in four control and two PARK9 mutant DA neurons at day 40 after the initiation of differentiation (n = 3, *p = 0.0001). C, β-glucocerebrosidase (GCase) activity in the secreted media taken from four control and two PARK9 mutant DA neurons at day 40 after the initiation of differentiation. The activity in the media was normalized by the activity in cells and is shown as a percentage of control 1 (n = 3, *p = 0.0001). D, ELISA to quantify α-syn in the media taken from four control and two PARK9 mutant DA neurons at day 40 after the initiation of differentiation (n = 3, *p = 0.0001). E, α-syn ELISA for detecting α-syn proteins in exosomes taken from 4 control and 2 PARK9 mutant DA neurons at day 40 after the initiation of differentiation (n = 3, *p = 0.0001). F, Sequential pathological cascade observed in long-term cultures of iPSC-derived PARK9 DA neurons from day 40 to day 120 after the initiation of differentiation (Figure 1-3). GI, Immunoblot analysis of α-syn proteins in four control, two PARK9 mutant, and SNCA triplication DA neurons 90 d (G) and 120 d (H) after the initiation of differentiation. After normalization to β-iii-tubulin, the relative α-syn levels are shown as fold changes compared with control 1 (n = 3, *p = 0.0087, **p = 0.0001, ***p = 0.004). Statistical analysis was conducted using one-way ANOVA with Tukey's post hoc test unless otherwise stated.
Figure 2.
Figure 2.
Defective α-syn secretion from both the soma and axons in PARK9 patient DA neurons (Figure 2-1). A, Schematic image of a microfluidic device in which two sets of chambers are connected through 450 μm microgroove groove. Neurons were cultured in the top chambers and extend their axons through grooves into the bottom chamber (Figure 2-1 A–C). B, Representative images of DA neurons cultured with Alexia Fluor-555-labeled α-syn fibrils in microfluidic devices (Figure 2-1 D–E). DA neurons were stained with β-iii-tubulin and visualized as α-syn fibrils conjugated with Alexa Fluor 555. A merged image is shown on the right. C, Fluorescence intensities in the media taken from the top chambers of microfluidic devices. DA neurons were infected with empty lentivirus (left) or lentivirus expressing human PARK9 (right) (Fig. 3-1) (n = 3, *p = 0.0276, **p = 0.0001, ***p = 0.0001). After culturing in media containing α-syn fibrils for 24 h, media was changed to fresh media. After 24 h, the media was collected and fluorescence intensities were analyzed. D, Fluorescence intensities of α-syn fibrils in three control and two PARK9 DA mutant neurons. After culturing in media containing α-syn fibrils for 24 h, the media was replaced with fresh media. The fluorescence intensities were measured at 24, 36, 48, and 60 h (n = 3, *p = 0.0158, **p = 0.0265). E, Representative images of DA neurons (Cont 1 and Mut 1) cultured in media containing Alexa Fluor 555-labeled α-syn fibrils for 24 h and subsequently cultured in fresh media for a week. F, Representative images of PARK9 mutant DA neurons (Mut 1) transfected with empty lentivirus (top) or PARK9 expressing lentivirus (bottom) and subsequently cultured with Alexa Fluor 555-labeled α-syn fibrils. G, Quantification of total α-syn fluorescence intensity in DA neurons (n = 3, *p = 0.0350, **p = 0.0255, Student's t test). H, Representative images of the axons of control (top) and PARK9 mutant (bottom) DA neurons in the bottom chambers of microfluidic devices after adding α-syn fibrils to the top chamber. Arrows show α-syn fibrils. I, Number of α-syn fibrils in each axon of four control and two mutant DA neurons (n = 10–20, *p = 0.0106, **p = 0.0354). J, Fluorescence intensities in the media taken from the bottom chambers of the microfluidic devices. DA neurons were infected with empty lentivirus (left) or lentivirus expressing human PARK9 (right) (n = 3, *p = 0.0016, **p = 0.0354, ***p = 0.0001). After culturing in media containing α-syn fibrils for 24 h, the media was changed to fresh media for another 24 h before the media was collected and fluorescence intensities were analyzed (n = 3, *p < 0.05). Statistical analysis was conducted using one-way ANOVA with Tukey's post hoc test unless otherwise stated. Scale bars: B, 200 μm; DF, 50 μm; H, 10 μm.
Figure 3.
Figure 3.
PARK9 patient DA neurons exhibit dysfunctional lysosomal Ca2+ homeostasis (Figure 3-1). AD, Spontaneous firing rate of DA neurons taken from control and PARK9 patients. A, Representative images of DA neurons from control individuals (left), PARK9 patients (right) during cell-attached patch-clamp recordings. B, Representative cell-attached recordings from control (top) and PARK9 patient-derived neurons (bottom). C, Box plots showing the distribution of spiking rates in control (n = 10) and PARK9 DA (n = 10) neurons (control median = 4.61 Hz vs PARK9 median = 7.25 Hz; *p = 0.021, unpaired t test with Welch's correction). D, Box plots showing the distribution of coefficient of variation in control (n = 10) and PARK9 DA (n = 10) neurons (control median = 6.1 vs PARK9 median = 4.2; *p = 0.1051, Mann–Whitney test). E, F, Cytosolic Ca2+ levels were measured using Fura-2 AM Ca2+ indicator. The intracellular Ca2+ concentration was measured in two control, two PARK9 mutant, and two PARK9 mutant fibroblasts that were transfected with lentivirus expressing PARK9 (Figure 3-1A) (E) and in iPSC-derived DA neurons (Figure 3-1B) (F) (n = 10, *p = 0.0001). GI, Ca2+ release from control and PARK9 mutant fibroblasts and DA neurons. G, Change of cytosolic Ca2+ concentration by GPN treatment was monitored by Fura-2 AM fluorescence ratios at 340 nm/380 nm. H, Fura-2 AM fluorescence ratios were shown before and after GPN treatment in two controls and two PARK9 mutant fibroblasts (n = 10, *p = 0.002). I, Ca2+ release from lysosomes was decreased in PARK9 mutant DA neurons. Fura-2 AM ratios were measured before and after GPN treatment (n = 10, *p = 0.0001). JN, Ca2+ release from lysosomes was analyzed with the lysosome targeted Ca2+ sensor GCamP3-ML1. J, Representative images of GCamp3-ML1 expressing H4 cells labeled with LAMP-1 before and after Baf1 treatment. K, GCamp3-ML1 and LysoTracker intensities were monitored during Baf1 treatment. L, Ratios of green (GCamp3-ML1) to red (LysoTracker red) fluorescence were monitored during Baf1 treatment. M, Ratios of green to red fluorescence under Baf1 treatment were analyzed in H4 cells transfected with Scrb shRNA or the shRNA against human PARK9 (n = 30–50/cells, *p = 0.0005, **p = 0.0422, ***p = 0.0303, ****p = 0.0063). N, Ratios of green to red fluorescence under Baf1 treatment were analyzed in control and PARK9 mutant fibroblasts and two PARK9 mutant fibroblasts transfected with lentivirus expressing PARK9 (Figure 3-1C). (n = 30–50/cells, *p = 0.0001). O, P, Ca2+ levels in lysosomes were measured using the Ca2+ dye rhodamine dextran. O, Representative images of control and mutant fibroblasts labeled with rhodamine dextran and Cascade blue. P, Quantification of rhodamine dextran and Cascade blue fluorescence intensities before and after Baf1 treatment in control and PARK9 mutant fibroblasts (n = 10 cells, *p = 0.0001, Student's t test). Q, Effect of PARK9 deficiency on Ca2+-dependent lysosomal exocytosis. GCase activity was measured in the media before and after 50 μm GPN or 200 nm Baf1 treatment. Treatment with the Ca2+ chelator 1,2-bis(o-aminophenoxy)ethane-N,N,N′,N′-tetraacetic acid (BAPTA) diminished the effect of GPN and Baf1 (n = 3, *p = 0.0135, **p = 0.0442, ***p = 0.0008, #p = 0.0347, ##p = 0.0023). R, Effect of Ca2+ release from the endoplasmic reticulum (ER) on lysosomal exocytosis was analyzed. GCase activity was measured from the media of two control or two PARK9 mutant fibroblasts before (left) and after 2 μm thapsigargin treatment (right) (n = 3, p = 0.95). Statistical analysis was conducted using one-way ANOVA with Tukey's post hoc test unless otherwise stated. Scale bar, 20 μm in J and O.
Figure 4.
Figure 4.
PARK9 regulation of lysosomal exocytosis. AC, Activities of three lysosomal acid hydrolases in media were measured in PARK9 mutant and control fibroblasts. A, GCase activity in media normalized to activity in cell lysates (n = 3, *p = 0.0103, **p = 0.0093). B, β-hexosaminidase activity in media normalized to activity in cell lysates (n = 3, *p = 0.0417, **p = 0.0462). C, Acid phosphatase activity in media normalized to activity in cell lysates (n = 3, *p = 0.0279, **p = 0.0181). DF, Activities of lysosomal acid hydrolases released into media were increased in PARK9-overexpressing H4 cells. D, GCase activity in media normalized to activity in cell lysates (n = 3, *p = 0.036, Student's t test). E, β-hexosaminidase activity in media normalized to activity in cell lysates (n = 3, *p = 0.0101, Student's t test). F, Acid phosphatase activity in media normalized to activity in cell lysates (n = 3, *p = 0.0111, Student's t test). G, LAMP-1 surface staining in PARK9-knockdown and PARK9-overexpressing H4 cells. LAMP-1 expression (green fluorescence) on the plasma membrane marked by Dil (red fluorescence) was visualized at steady-state (top) and after 30 min of Baf1 treatment (top middle). LAMP-1 expression on the plasma membrane was also visualized in PARK9-silenced H4 cells with Baf1 treatment (bottom middle) and PARK9-overexpressing H4 cells with Baf1 treatment (bottom). H, Fluorescence intensity ratios (LAMP-1/Dil) are shown (n = 3, *p = 0.0001, **p = 0.0002, Student's t test). I, Cell surface biotinylation assay to analyze the effect of PARK9 expression levels on Baf1-induced cell surface LAMP1. Although overexpression of PARK9 led to increased expression, depletion of PARK9 resulted in reduced LAMP1 expression on the cell surface. J, Quantification of biotinylated LAMP1 proteins against total LAMP-1 proteins (n = 3, *p = 0.0005, **p = 0.0021, ***p = 0.0034, Student's t test). Statistical analysis was conducted using one-way ANOVA with Tukey's post hoc test unless otherwise stated. Values are shown as mean ± SEM. Scale bars, 20 μm in G.
Figure 5.
Figure 5.
Ca2+-dependent lysosomal exocytosis rescues α-syn secretion in PARK9 patient DA neurons (Figure 5-1). A, Effect of TRPML1 channel agonists on lysosomal exocytosis was analyzed in control and PARK9 mutant fibroblasts. The extracellular and intracellular GCase activities were measured before and after 20 μm ML-SA1, 1 μm SF-22, and 1 μm MK6–83 treatments (Figure 5-1) (n = 3, *p = 0.0103, **p = 0.0045, ***p = 0.0054, ***p = 0.0106, #p = 0.0270, ##p = 0.0444, ###p = 0.0002). B, Effect of the TRPML1 channel agonist ML-SA1 (20 μm) on LAMP1 surface staining in H4 cells transfected with Scrb shRNA (top) or shRNA against PARK9 transfected (bottom). 1,1′-Dioctadecyl-3,3,3′,3′-Tetramethylindocarbocyanine Perchlorate (Dil) was used as a plasma membrane marker. C, α-syn levels from the media taken from H4 cells measured by highly sensitive ELISA (n = 3, *p = 0.0348, **p = 0.0011). D, Immunoblot analysis of α-syn levels in H4 cells after treatment with DMSO, ML-SA1, SF-22, or MK6–83 for 24 h. E, Quantification of α-syn levels. After normalization to GAPDH, the relative α-syn levels in treated cells were divided by α-syn levels in cells treated with DMSO (far left) (n = 3, *p = 0.0133, **p = 0.0077, ***p = 0.0046). F, α-syn levels from the media taken from control or PARK9 mutant DA neurons measured by highly sensitive ELISA (n = 3, *p = 0.0001). G, Immunoblot analysis of α-syn levels in DA neurons at day 90 after treatment with DMSO, ML-SA1, SF-22, or MK6–83 for 24 h. H, I, Quantification of α-syn levels. After normalization to β-iii-tubulin (H, Triton-X-soluble fraction) or vimentin (I, SDS-soluble fraction), the relative α-syn levels in the treated cells were normalized to α-syn levels before treatment (green bars) (H, n = 3, *p = 0.0415, **p = 0.0221, ***p = 0.0011, ****p = 0.0001; I, n = 3, *p = 0.0071, **p = 0.0006). J, Mitochondrial respiration analysis using two control, two PARK9 mutant DA neurons and two PARK9 mutant DA neurons pretreated with 1 μm MK6–83 (n = 3, *p = 0.0303). Statistical analysis was conducted using one-way ANOVA with Tukey's post hoc test. Scale bars represent 20 μm for B.

References

    1. Bae M, Patel N, Xu H, Lee M, Tominaga-Yamanaka K, Nath A, Geiger J, Gorospe M, Mattson MP, Haughey NJ (2014) Activation of TRPML1 clears intraneuronal abeta in preclinical models of HIV infection. J Neurosci 34:11485–11503. 10.1523/JNEUROSCI.0210-14.2014 - DOI - PMC - PubMed
    1. Bento CF, Ashkenazi A, Jimenez-Sanchez M, Rubinsztein DC (2016) The Parkinson's disease-associated genes ATP13A2 and SYT11 regulate autophagy via a common pathway. Nat Commun 7:11803. 10.1038/ncomms11803 - DOI - PMC - PubMed
    1. Bliederhaeuser C, Grozdanov V, Speidel A, Zondler L, Ruf WP, Bayer H, Kiechle M, Feiler MS, Freischmidt A, Brenner D, Witting A, Hengerer B, Fändrich M, Ludolph AC, Weishaupt JH, Gillardon F, Danzer KM (2016) Age-dependent defects of alpha-synuclein oligomer uptake in microglia and monocytes. Acta Neuropathol 131:379–391. 10.1007/s00401-015-1504-2 - DOI - PubMed
    1. Borghi R, Marchese R, Negro A, Marinelli L, Forloni G, Zaccheo D, Abbruzzese G, Tabaton M (2000) Full length alpha-synuclein is present in cerebrospinal fluid from Parkinson's disease and normal subjects. Neurosci Lett 287:65–67. 10.1016/S0304-3940(00)01153-8 - DOI - PubMed
    1. Brahic M, Bousset L, Bieri G, Melki R, Gitler AD (2016) Axonal transport and secretion of fibrillar forms of alpha-synuclein, Abeta42 peptide and HTTExon 1. Acta Neuropathol 131:539–548. 10.1007/s00401-016-1538-0 - DOI - PMC - PubMed

Publication types

MeSH terms

LinkOut - more resources