. 2019 Jul 10;39(28):5466-5480.
doi: 10.1523/JNEUROSCI.2752-18.2019. Epub 2019 May 16.

Regulation of Neuronal Survival and Axon Growth by a Perinuclear cAMP Compartment

Affiliations

Regulation of Neuronal Survival and Axon Growth by a Perinuclear cAMP Compartment

Tomasz Boczek et al. J Neurosci. .

Abstract

cAMP signaling is known to be critical in neuronal survival and axon growth. Increasingly the subcellular compartmentation of cAMP signaling has been appreciated, but outside of dendritic synaptic regulation, few cAMP compartments have been defined in terms of molecular composition or function in neurons. Specificity in cAMP signaling is conferred in large part by A-kinase anchoring proteins (AKAPs) that localize protein kinase A and other signaling enzymes to discrete intracellular compartments. We now reveal that cAMP signaling within a perinuclear neuronal compartment organized by the large multivalent scaffold protein mAKAPα promotes neuronal survival and axon growth. mAKAPα signalosome function is explored using new molecular tools designed to specifically alter local cAMP levels as studied by live-cell FRET imaging. In addition, enhancement of mAKAPα-associated cAMP signaling by isoform-specific displacement of bound phosphodiesterase is demonstrated to increase retinal ganglion cell survival in vivo in mice of both sexes following optic nerve crush injury. These findings define a novel neuronal compartment that confers cAMP regulation of neuroprotection and axon growth and that may be therapeutically targeted in disease.SIGNIFICANCE STATEMENT cAMP is a second messenger responsible for the regulation of diverse cellular processes including neuronal neurite extension and survival following injury. Signal transduction by cAMP is highly compartmentalized in large part because of the formation of discrete, localized multimolecular signaling complexes by A-kinase anchoring proteins. Although the concept of cAMP compartmentation is well established, the function and identity of these compartments remain poorly understood in neurons. In this study, we provide evidence for a neuronal perinuclear cAMP compartment organized by the scaffold protein mAKAPα that is necessary and sufficient for the induction of neurite outgrowth in vitro and for the survival of retinal ganglion cells in vivo following optic nerve injury.

Keywords: FRET imaging; cAMP; neuroprotection; phosphodiesterase; signal transduction; signalosome.


Figures

Figure 1.
Figure 1.
Perinuclear localization of mAKAPα at nesprin-1α is required for primary hippocampal neuron neurite outgrowth. A, Structure of mAKAPα and expressed proteins. The three spectrin repeats (SRs) required for nuclear envelope targeting are indicated (Kapiloff et al., 1999). Binding sites are shown for those mAKAP binding partners for which there is evidence of direct binding: PDK1 (3-phosphoinositide-dependent kinase-1; Michel et al., 2005), AC5 (adenylyl cyclase 5; Kapiloff et al., 2009), MEF2 (Vargas et al., 2012), PLCε (phospholipase Cε; Zhang et al., 2011), nesprin-1α (Pare et al., 2005a), RyR2 (ryanodine receptor; Marx et al., 2001), CaN (calcineurin; Li et al., 2010), PDE4D3 (Dodge et al., 2001), RSK3 (p90 ribosomal S6 kinase 3; Passariello et al., 2013), PKA (Kapiloff et al., 1999), and PP2A (protein phosphatase 2A; Dodge-Kafka et al., 2010). B, Hippocampal neurons stained with α-nesprin (green) and α-MAP2 antibodies (red) and DAPI nuclear stain (blue) with grayscale single channel images. C, Displacement of mAKAP by mAKAP-SR-GFP. Neurons expressing a mAKAP-DsRed fusion protein (red in composite and shown separately as grayscale image) and either GFP (green) or mAKAP-SR-GFP (green) and stained with DAPI (blue). Scale bar, 10 μm. n = 3 for B and C. D, Neurons expressing mAKAP-SR-GFP or GFP control were cultured in defined media in the presence or absence of 40 mm KCl for 2 d. Grayscale images of GFP fluorescence are shown. Scale bar, 100 μm. E, Quantification of axon length. The length of the longest neurite was measured. Colors represent paired data for four independent experiments. **p ≤ 0.01.
Figure 2.
Figure 2.
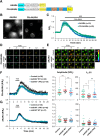
Characterization of a new perinuclear PKA FRET sensor. A, AKAR4 is a FRET biosensor that exhibits increased signal upon phosphorylation of the LRRATLVD PKA peptide substrate (Depry et al., 2011). PN-AKAR4 is an AKAR4-nesprin-1α fusion protein. Nesprin-1α (dark blue) contains 5 spectrin repeats (SRs) and a transmembrane KASH domain that localizes the protein to the nuclear envelope. B, Grayscale CFP images of Cos-7 cells expressing AKAR4 or PN-AKAR4. Scale bar, 10 μm. C, Average normalized FRET ratio signal ± SEM. (R/R0) following stimulation with 10 μm FSK and 100 μm IBMX and then inhibition with 10 μm H89. D, E, Pseudocolored images showing FRET ratio R (net FRET ÷ background-subtracted donor signal) for representative tracings for F and G. Color hue and not intensity is indicative of R, as shown on the color scale. F, G, Cos-7 cells expressing sensor and either mAKAPα WT or PKA binding mutant (mAKAPΔPKA) were stimulated with 10 μm FSK for 2 min (bar on graph). Average tracings (R/R0 ± SEM) and the peak amplitude and half-time of signal decay (t1/2) for individual tracings are shown; red bars indicate mean. *p ≤ 0.05, **p ≤ 0.01.
Figure 3.
Figure 3.
PN-AKAR4 is an mAKAPα-dependent PKA sensor in hippocampal neurons. A, Grayscale CFP images of PN-AKAR4 and AKAR4 sensors in neurons. Scale bar, 100 μm. B, Colocalization of mAKAPα-DsRed and PN-AKAR4 (CFP and YFP channels). Scale bar, 10 μm. C, D, Pseudocolored images showing FRET ratio R (net FRET ÷ background-subtracted donor signal) for representative tracings for EG, The AKAR4 soma and neurite measurements were obtained from the same images by measuring the respective areas of the cells. Color hue and not intensity is indicative of R, as shown on the color scale. EG, Neurons were infected with adenovirus for PN-AKAR4 or AKAR4 and for mAKAP or control shRNA and stimulated with 10 μm FSK for 2 min (horizontal bars). Average tracings (R/R0 ± SEM) and the peak amplitude and half-time of signal decay (t1/2) for individual tracings are shown; red bars indicate mean. *p ≤ 0.05, **p ≤ 0.01.
Figure 4.
Figure 4.
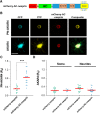
cAMP can be elevated selectively at the nuclear envelope. A, In mCherry-AC-nesprin, mCherry and the constitutively active catalytic domain of ADCY10 are fused to the N-terminus of full-length nesprin-1α. B, Images of hippocampal neurons expressing mCherry-AC-nesprin and PN-AKAR4 or AKAR4 (CFP and YFP channels). Scale bar, 20 μm. C, D, Baseline FRET ratio (R0 = net FRET ÷ Donor) for PN-AKAR4 (n = 14,16) and AKAR4 (n = 9–19) was measured using hippocampal neurons expressing mCherry-AC-nesprin or control mCherry-nesprin; red bars indicate mean. ***p ≤ 0.001.
Figure 5.
Figure 5.
Elevated perinuclear cAMP is sufficient to promote neurite outgrowth. A, Hippocampal neurons expressing GFP and either mCherry-nesprin control or mCherry-AC-nesprin were cultured in defined media in the absence or presence of KCl for 2 d. Grayscale images of GFP fluorescence are shown. Scale bar, 100 μm. B, The length of the longest neurite was measured. n = 4–8 independent neuronal cultures. *p ≤ 0.05, **p ≤ 0.01, ***p ≤ 0.001.
Figure 6.
Figure 6.
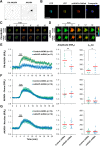
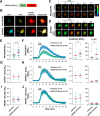
cAMP can be selectively depleted at the nuclear envelope. A, PDE4D3 contains a unique N-terminal “4D3” peptide, two upstream conserved region (UCR1 and UCR2) and a C-terminal catalytic domain (Carlisle Michel et al., 2004). PKA phosphorylates Ser-13 and Ser-54 increasing mAKAP binding and catalytic activity, respectively. ERK binds the KIM and FQF motifs and phosphorylates Ser-579, inhibiting activity (MacKenzie et al., 2000). In mCherry-PDE-nesprin, mCherry and a mutant PDE4D catalytic domain (K455/K456/S579/F597/Q598/F599 all to alanine, PDE*) are fused to the N-terminus of full-length nesprin-1α. B, Images of hippocampal neurons expressing mCherry-PDE-nesprin and PN-AKAR4 or AKAR4 (CFP and YFP channels). Scale bar, 20 μm. C, D, Pseudocolored images showing FRET ratio R (net FRET ÷ background-subtracted donor signal) for representative tracings for F, H, and J. The AKAR4 soma and neurite measurements were obtained from the same images by measuring the respective areas of the cells. Color hue and not intensity is indicative of R, as shown on the color scale. E, G, I, Baseline FRET ratio (R0 = net FRET ÷ Donor) was measured using neurons expressing PN-AKAR4 or AKAR4 and mCherry-PDE-nesprin or control mCherry-nesprin; red bars indicate mean. F, H, J, FRET tracings were obtained following stimulation with 10 μm FSK for 2 min (horizontal bars). Average tracings (R/R0 ± SEM) and the peak amplitude and half-time of signal decay (t1/2) for individual tracings are shown. *p ≤ 0.05, ***p ≤ 0.001.
Figure 7.
Figure 7.
Perinuclear cAMP is required for neurite outgrowth in hippocampal neurons. A, Neurons expressing GFP and either mCherry-nesprin control or mCherry-PDE-nesprin were cultured in defined media in the absence or presence of KCl for 2 d. Grayscale images of GFP fluorescence are shown. Scale bar, 100 μm. B, The length of the longest neurite was measured. n = 4–10 independent neuronal cultures. *p ≤ 0.05, ***p ≤ 0.001.
Figure 8.
Figure 8.
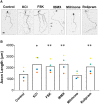
Pharmacological induction of neurite outgrowth. A, Hippocampal neurons transfected with a GFP expression plasmid were treated with 40 mm KCl, 10 μm FSK, 100 μm IBMX, 20 μm milrinone, or 10 μm rolipram for 2 d. Grayscale images of GFP fluorescence are shown. Scale bar, 100 μm. B, Mean length of the longest neurite. Colors represent paired data for four independent experiments. *p value versus control. *p ≤ 0.05, **p ≤ 0.01.
Figure 9.
Figure 9.
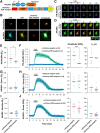
Displacement of PDE4D3 from mAKAPα increases perinuclear cAMP. A, 4D3(E)-mCherry includes the PDE4D3 isoform-specific N-terminal peptide with a Ser13Glu substitution in fusion to mCherry. B, Images of hippocampal neurons expressing the diffusely localized 4D3(E)-mCherry polypeptide and PN-AKAR4 or AKAR4 (CFP and YFP channels). Scale bar, 20 μm. C, D, Pseudocolored images showing FRET ratio R (net FRET ÷ background-subtracted donor signal) for representative tracings for F, H, and J. The AKAR4 soma and neurite measurements were obtained from the same images by measuring the respective areas of the cells. Color hue and not intensity is indicative of R, as shown on the color scale. E, G, I, Baseline FRET ratio (R0 = net FRET ÷ Donor) was measured using hippocampal neurons expressing PN-AKAR4 or AKAR4 and 4D3(E)-mCherry or control mCherry; red bars indicate mean. F, H, J, Tracings were obtained following stimulation for 2 min with 10 μm forskolin (bar on graphs showing average R/R0 ± SEM). Peak amplitude and half-time of signal decay (t1/2) for individual tracings are shown on right. *p ≤ 0.05, **p ≤ 0.01.
Figure 10.
Figure 10.
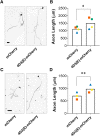
Displacement of PDE4D3 from mAKAPα promotes hippocampal and RGC neurite extension. A, Grayscale images of mCherry fluorescence for hippocampal neurons transfected with mCherry or 4D3(E)-mCherry expression plasmids and cultured for 2 d in defined media. Scale bar, 100 μm. B, Mean lengths of the longest neurite are shown for four independent experiments (different colors). C, D, Same as A,B, except for RGCs. *p ≤ 0.05, **p ≤ 0.01.
Figure 11.
Figure 11.
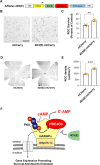
PDE4D3 anchoring disruption increases RGC survival after optic nerve crush. A, 4D3(E)-mCherry was expressed in vivo using the gene therapy vector AAV2sc.4D3(E). B, Retinas isolated 2 weeks after optic nerve crush were stained for the RGC marker RBPMS (shown in grayscale). Scale bar, 100 μm. C, Quantification of RBPMS-stained cells showing increased RGC survival after AAV2.4D3(E) injection. n = 5,6 mice. D, E, Same as in B and C except performed by a different investigator. n = 4,5 mice. **p ≤ 0.01, ***p ≤ 0.001. F, Model for regulation of perinuclear cAMP by mAKAPα signalosomes. mAKAPα binds the cAMP-specific, PKA-activated phosphodiesterase PDE4D3 that will oppose local PKA signaling in response to cAMP. The 4D3(E) peptide will displace PDE4D3 from mAKAPα potentiating local PKA signaling that promotes neuroprotection and neurite extension.

References

    1. Aglah C, Gordon T, Posse de Chaves EI (2008) cAMP promotes neurite outgrowth and extension through protein kinase A but independently of erk activation in cultured rat motoneurons. Neuropharmacology 55:8–17. 10.1016/j.neuropharm.2008.04.005 - DOI - PubMed
    1. Auricchio A, Smith AJ, Ali RR (2017) The future looks brighter after 25 years of retinal gene therapy. Hum Gene Ther 28:982–987. 10.1089/hum.2017.164 - DOI - PubMed
    1. Averaimo S, Nicol X (2014) Intermingled cAMP, cGMP and calcium spatiotemporal dynamics in developing neuronal circuits. Front Cell Neurosci 8:376. 10.3389/fncel.2014.00376 - DOI - PMC - PubMed
    1. Averaimo S, Assali A, Ros O, Couvet S, Zagar Y, Genescu I, Rebsam A, Nicol X (2016) A plasma membrane microdomain compartmentalizes ephrin-generated cAMP signals to prune developing retinal axon arbors. Nat Commun 7:12896. 10.1038/ncomms12896 - DOI - PMC - PubMed
    1. Carlisle Michel JJ, Dodge KL, Wong W, Mayer NC, Langeberg LK, Scott JD (2004) PKA-phosphorylation of PDE4D3 facilitates recruitment of the mAKAP signalling complex. Biochem J 381:587–592. 10.1042/BJ20040846 - DOI - PMC - PubMed

Publication types

MeSH terms