. 2019 May 17;364(6441):685-689.
doi: 10.1126/science.aav8130.

Single-cell genomics identifies cell type-specific molecular changes in autism

Affiliations

Single-cell genomics identifies cell type-specific molecular changes in autism

Dmitry Velmeshev et al. Science. .

Abstract

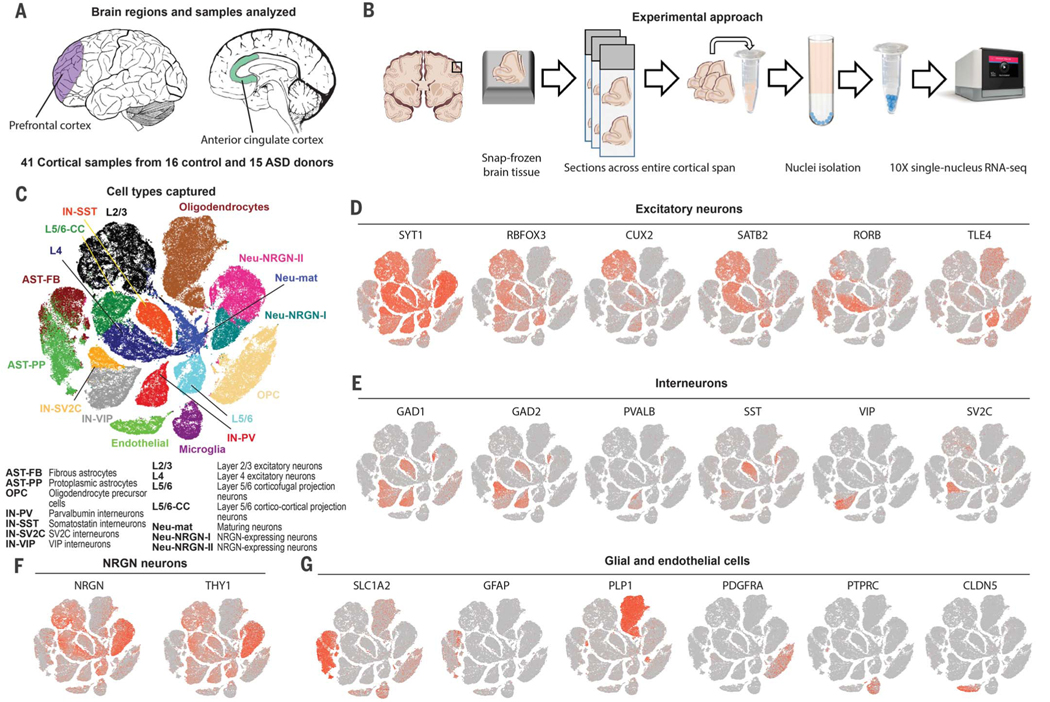
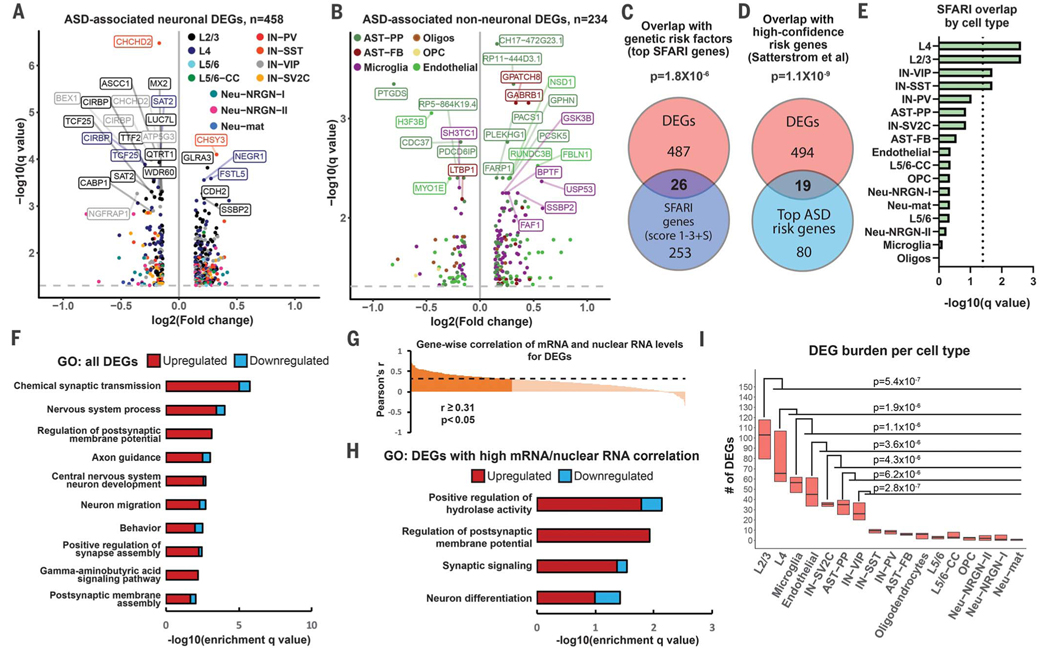
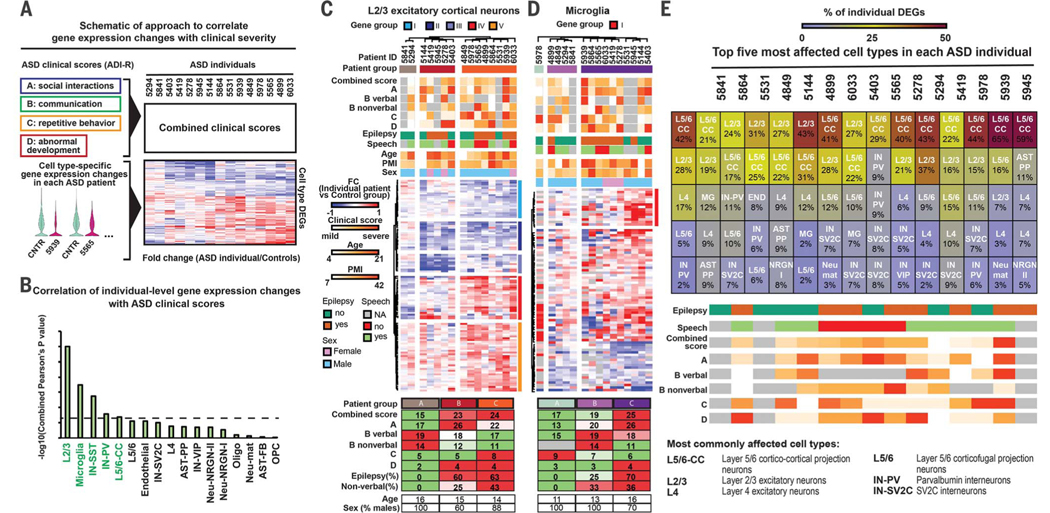
Despite the clinical and genetic heterogeneity of autism, bulk gene expression studies show that changes in the neocortex of autism patients converge on common genes and pathways. However, direct assessment of specific cell types in the brain affected by autism has not been feasible until recently. We used single-nucleus RNA sequencing of cortical tissue from patients with autism to identify autism-associated transcriptomic changes in specific cell types. We found that synaptic signaling of upper-layer excitatory neurons and the molecular state of microglia are preferentially affected in autism. Moreover, our results show that dysregulation of specific groups of genes in cortico-cortical projection neurons correlates with clinical severity of autism. These findings suggest that molecular changes in upper-layer cortical circuits are linked to behavioral manifestations of autism.


Figures

Fig. 1.
Fig. 1.. Overview of the experimental approach and snRNA-seq dataset.
(A) Cortical regions analyzed with snRNA-seq including the PFC and ACC regions. (B) Experimental approach to snap-frozen tissue sample processing and nuclei isolation. (C) Unbiased clustering of snRNA-seq data. Cell types were annotated according to expression of known marker genes. (D) Expression of excitatory neuronal subtype markers. (E) Inhibitory neuronal subtype marker expression. (F) Markers of NRGN-expressing neurons. (G) Markers of glial cell types and endothelial cells.
Fig. 2.
Fig. 2.. Cell type–specific gene expression changes in ASD.
(A and B) Volcano plots for cell type–specific genes differentially expressed in neuronal (A) and non-neuronal cells (B). (C) Overlap between DEGs and top ASD genetic risk factors from the SFARI database (gene scores 1 to 3 and syndromic). (D) Overlap between cell type–specific DEGs and high-confidence ASD genetic risk factors based on whole-exome sequencing (35,584 ASD subjects). (E) Overlap between SFARI genes and DEGs; dotted line indicates statistical significance (q < 0.05). (F) Top biological pathways enriched for DEGs identified across all analyzed cell types. Bars represent numbers of up- and down-regulated genes in each GO term. (G) Correlation between mRNA and nuclear RNA for DEGs in the same tissue samples. (H) GO analysis for DEGs with significant mRNA–nuclear RNA correlation. (I) Burden analysis on downsampled data. P values were calculated by comparing numbers of DEGs between cell types (Mann-Whitney U test).
Fig. 3.
Fig. 3.. Gene expression changes across specific cell types in ASD.
(A) Schematic of cortical neurons with known layer localization. Color boxes refer to cell types identified in Fig. 1C. (B) Hierarchical clustering based on log-transformed relative (fold) changes [versus control (CNTR)] of DEGs in each cell type. (C) Violin plots for top genes differentially expressed in L2/3 neurons in ASD. Genes dysregulated in sporadic epilepsy are indicated in orange. Fold changes (ASD versus control) are indicated under gene names. (D) Violin plots for top genes differentially expressed in L4 neurons in ASD. (E) GO analysis of genes differentially expressed specifically in PFC and ACC. (F and G) Examples of top region-specific DEGs dysregulated in L2/3 and L4 neurons. Asterisk denotes statistically significant (q < 0.05) change in gene expression between ASD and control in either the PFC or ACC.
Fig. 4.
Fig. 4.. Correlation of cell type–specific gene dysregulation in ASD patients with clinical severity.
(A) Strategy for correlating individual-level DEGs and clinical severity. ADI-R subscores were ranked and combined. ASD cases were compared to the combined control profiles in each cell type to generate individual fold changes. (B) Cell types ranked by correlation of DEGs with combined clinical scores. Cell type DEGs in green were significantly (P < 0.05) correlated with clinical severity. (C and D) Hierarchical clustering of ASD patients based on individual fold changes in gene expression level in L2/3 neurons (C) and microglia (D). Average clinical scores, prevalence of epilepsy, proportion of nonverbal subjects, and age and gender composition are shown below the heat maps. (E) Analysis of cell types most enriched for transcriptional changes in individual ASD patients.

Comment in

References

    1. Voineagu I. et al., Nature 474, 380–384 (2011). - PMC - PubMed
    1. Parikshak NN et al., Nature 540, 423–427 (2016). - PMC - PubMed
    1. Gupta S. et al., Nat. Commun 5, 5748 (2014). - PMC - PubMed
    1. Lake BB et al., Science 352, 1586–1590 (2016). - PMC - PubMed
    1. Lake BB et al., Nat. Biotechnol 36, 70–80 (2018). - PMC - PubMed

Publication types

LinkOut - more resources