. 2019 Jul;180(3):1389-1405.
doi: 10.1104/pp.18.01515. Epub 2019 May 16.

TPX2-LIKE PROTEIN3 Is the Primary Activator of α-Aurora Kinases and Is Essential for Embryogenesis

Affiliations

TPX2-LIKE PROTEIN3 Is the Primary Activator of α-Aurora Kinases and Is Essential for Embryogenesis

Joanna Boruc et al. Plant Physiol. 2019 Jul.

Abstract

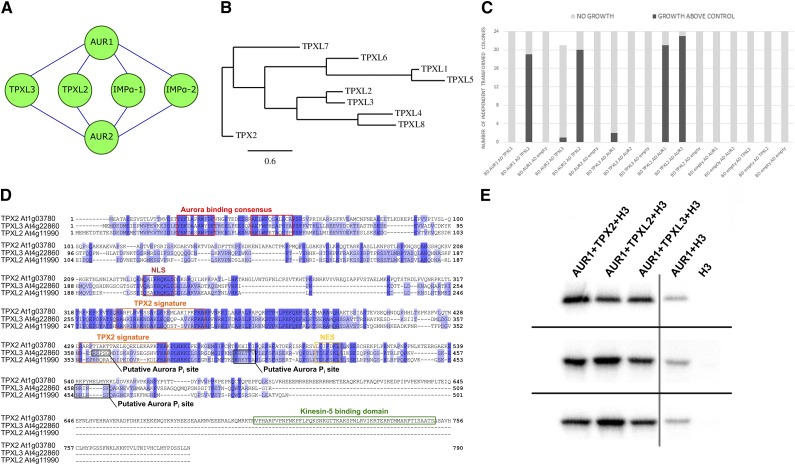
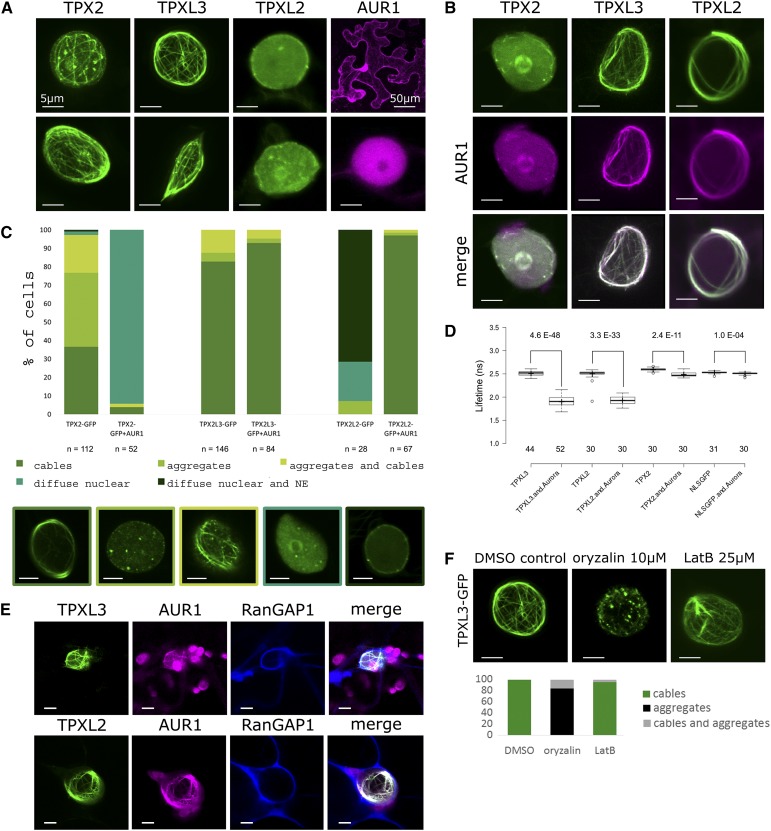
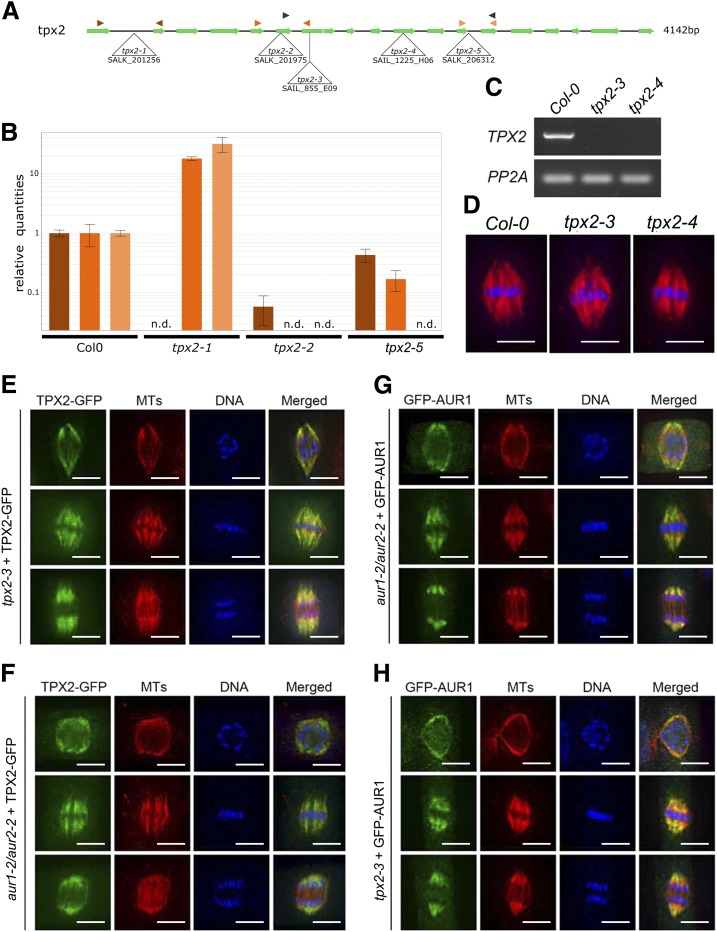
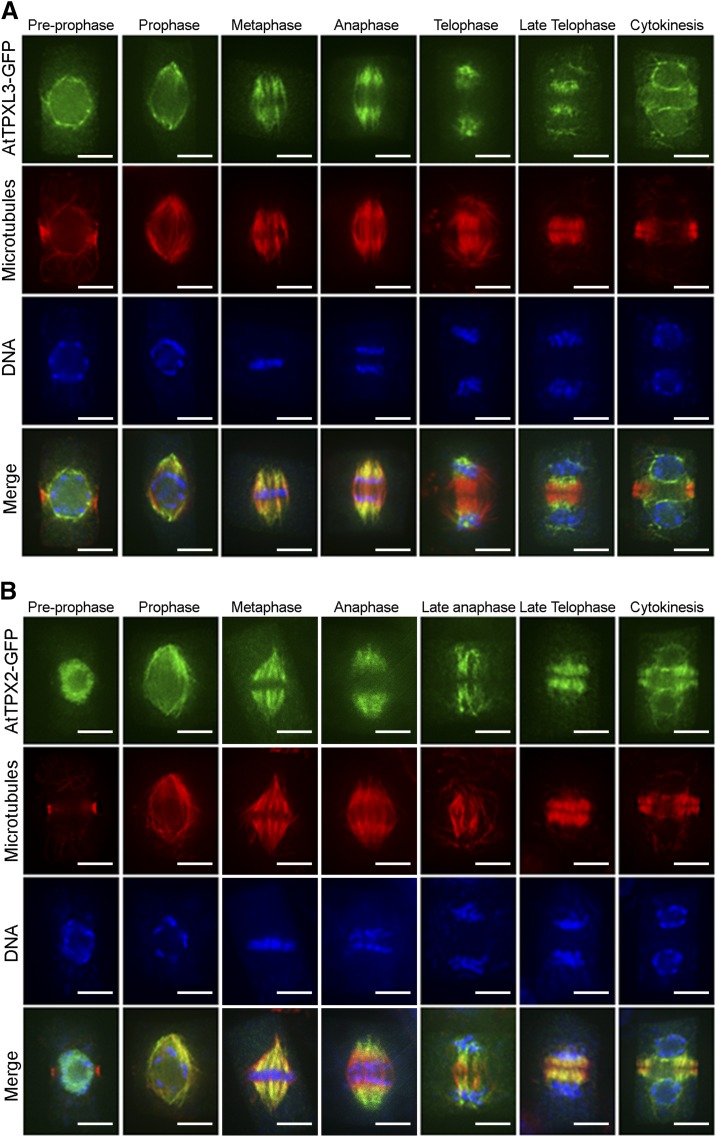
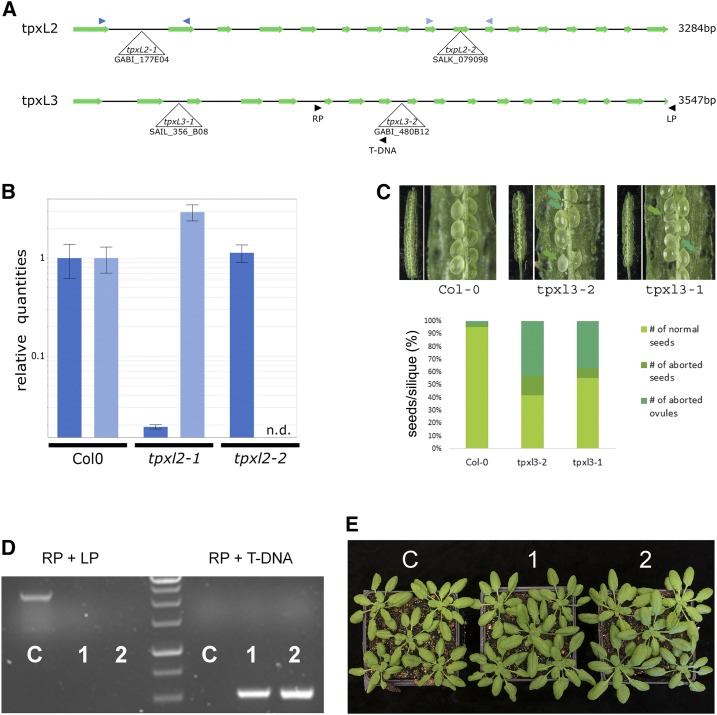
Aurora kinases are key regulators of mitosis. Multicellular eukaryotes generally possess two functionally diverged types of Aurora kinases. In plants, including Arabidopsis (Arabidopsis thaliana), these are termed α- and β-Auroras. As the functional specification of Aurora kinases is determined by their specific interaction partners, we initiated interactomics analyses using both Arabidopsis α-Aurora kinases (AUR1 and AUR2). Proteomics results revealed that TPX2-LIKE PROTEINS2 and 3 (TPXL2/3) prominently associated with α-Auroras, as did the conserved TPX2 to a lower degree. Like TPX2, TPXL2 and TPXL3 strongly activated the AUR1 kinase but exhibited cell-cycle-dependent localization differences on microtubule arrays. The separate functions of TPX2 and TPXL2/3 were also suggested by their different influences on AUR1 localization upon ectopic expressions. Furthermore, genetic analyses showed that TPXL3, but not TPX2 and TPXL2, acts nonredundantly to enable proper embryo development. In contrast to vertebrates, plants have an expanded TPX2 family and these family members have both redundant and unique functions. Moreover, as neither TPXL2 nor TPXL3 contains the C-terminal Kinesin-5 binding domain present in the canonical TPX2, the targeting and activity of this kinesin must be organized differently in plants.


Figures

Figure 1.
Figure 1.
Arabidopsis TPXL2 and TPXL3 are interactors and activators of AUR1 and AUR2. A, Cytoscape representation of the AUR1 and AUR2 interactions detected using the TAP-tag assay on the Arabidopsis cell suspension culture. Next to two members of the importin protein family, two TPXLs were copurified with both Aurora kinases. B, Phylogenetic tree of TPX2 and eight TPXLs showing the evolutionary relationship among these nine Arabidopsis proteins. TPXL2 and TPXL3 form a subfamily. C, Quantification of the Y2H assay (data shown in Supplemental Fig. S1). A total of 21–24 independent double-transformed yeast colonies from two independent yeast transformations were scored for their interaction based on their capacity for growth on selective medium. The obtained results confirm the interaction between both alpha Aurora kinases and TPXL2, whereas TPXL3 hardly interacts with the α-Aurora in this assay. D, Protein sequence alignment of TPX2, TPXL2, and TPXL3 showing that in contrast to TPX2, TPX2L and TPXL3 lack the Kinesin-5 binding domain. The Aurora binding consensus motif (red), NLS (light brown), nuclear export signal (NES, yellow), TPX2 signature (orange), Kinesin-5 binding domain (green), and the putative Aurora phosphorylation sites (Pi; black) are marked with colored boxes. E, In vitro kinase assay preformed in triplicates (top, middle, and bottom row) showing the phosphorylation level of recombinant Histone H3-6xHIS in the absence or presence of AUR1 and/or the N-terminal fragments of the TPX(L) proteins. The phosphorylation activity of recombinant Aurora1 is dramatically increased in the presence of the N-terminal TPX2, TPXL2, or TPXL3 fragments containing the predicted Aurora binding domain (amino acids 1–100). The gray line indicates the division between two parts of the kinase assay gel.
Figure 2.
Figure 2.
TPX proteins interact with AUR1 in planta and initiate intranuclear MT nucleation/polymerization. A–C, Representative localizations (A and B) and quantification of the observed localization patterns (C, n = number of nuclei) for TPX2, TPXL3, and TPXL2 with and without AUR1 in N. benthamiana leaf epidermal cells. Single expression of TPX2 and TPXL3, but not TPXL2, causes the formation of intranuclear aggregates and cables resembling cytoskeletal filaments. AUR1 is diffuse nuclear and cytoplasmic (A and C). Coexpression of TPX2, TPXL2, and TPXL3 with AUR1 differently affects TPX/L localization. AUR1 has a negative impact on the bundling activity of TPX2, is recruited to the bundles formed by TPXL3 and activates the bundling activity of TPXL2 (B and C). Images below (C) represent the different classes of localizations observed. Left to right: cables (TPX2-GFP); aggregates (TPX2-GFP); aggregates and cables (TPX2-GFP); diffuse nuclear (TPX2-GFP and AUR1); diffuse nuclear and NE (TPX2L2-GFP). D, FLIM analysis of cotransformed N. benthamiana epidermal cells. Coexpression of TPX-GFP with AUR1-mRFP reduces the donor lifetime. The reduction in lifetime values is the most pronounced for TPXL2 and TPXL3 (from 2.5 to 1.9 ns); the lifetime decrease of TPX2 is less dramatic (from 2.59 to 2.48). The lifetime of NLS-GFP hardly changes when combined with AUR1 (from 2.53 to 2.51). Numbers represent Student’s t test P values (top) and the number of nuclei analyzed (bottom). E, Triple localization of TPXL3 or TPXL2 (green), AUR1 (magenta), and the NE marker RanGAP1 (blue) in N. benthamiana epidermal cells shows that the cable-like structures form inside the nuclei outlined by RanGAP1. F, The intranuclear cables marked by the TPX proteins are MTs. TPXL3-GFP localization to the cable-like intranuclear structures is sensitive to a 1-h treatment of 10-μm oryzalin (n = 25) and changes from intranuclear cables into a predominantly aggregated pattern in nuclei when compared to the DMSO control (n = 20). LatB does not affect the localization of TPXL3-GFP (1 H, 25 μM, n = 21). All scale bars = 5 μm, except for the top-right corner image in (A), which is = 50 μm.
Figure 3.
Figure 3.
Mutant analysis reveals TPX2 as nonessential. A, Schematic overview of the gene model for TPX2 with indication of the positions of the T-DNA insertion alleles analyzed. Primer pairs used for RT-qPCR and RT-PCR analysis are indicated by color-coded arrowhead pairs. B, RT-qPCR analysis of homozygous tpx2-1, tpx2-2, and tpx2-5 mutants using the three different primer pairs shown in (A). Error bars represent se. The graph shows the absence of full-length transcripts over the T-DNA positions (n.d., not detected). C, Using the primers marked by the black arrowheads in (A), RT-PCR of homozygous tpx2-3 and tpx2-4 mutants show the absence of transcript compared to wild type (Col-0). The constitutively expressed PP2A gene was set as the positive control. D, Similar spindle MT arrays are formed in metaphase cells in the control (Col-0) and homozygous tpx2-3 and tpx2-4 plants. The immunofluorescent images have MTs pseudo-colored in red and DNA in blue. E and F, TPX2-GFP localization upon expression in the null tpx2-3 mutant (E) and in homozygous aur1-2/aur2-2 double mutant cells (F). Representative cells are at late prophase (top row), metaphase (middle row), and anaphase (bottom row). TPX2-GFP is pseudo-colored in green, MTs in red, and DNA in blue. TPX2-GFP localizes to the prospindle MTs in prophase and K-fiber MTs at metaphase and anaphase. No obvious difference was detected between the control and aur1-2/aur2-2 mutant cells. G and H, GFP-AUR1 localization in complemented aur1-2/aur2-2 (G) and in tpx2-3 mutant cells (H). Representative cells are at late prophase (top row), metaphase (middle row), and anaphase (bottom row). GFP-AUR1 is pseudo-colored in green, MTs in red, and DNA in blue. GFP-AUR1 localizes to the prospindle MTs in prophase and K-fiber MTs at metaphase and anaphase. No obvious difference was detected between the control and tpx2 mutant cells. Images shown are representative examples chosen out of >10 individual images for each cell cycle phase. Scale bars = 5 μm.
Figure 4.
Figure 4.
TPX2 and TPXL3 localize differentially in dividing Arabidopsis root cells. A and B, TPXL3-GFP (A) and TPX2-GFP (B) localization in dividing Arabidopsis root cells obtained via immunofluorescence with antibodies against GFP (green), MTs (red), and DNA (blue) in cells from prophase to telophase. Before NEBD, TPXL3 largely accumulates at the NE, while TPX2 is mostly nuclear. Both proteins are not detectable at the PPB. After NEBD, both TPX2 and TPXL3 decorate the two “polar caps” of the prophase spindle as well as spindle MTs and the shortening K-fibers at anaphase. In late anaphase and telophase, when midzone MTs develop into the two mirrored sets of the early phragmoplast array, TPX2 association with the phragmoplast-forming MTs is much more pronounced than that of TPXL3, which remains heavily enriched at the former spindles poles and subsequently localizes to the reformed NE with a strong bias toward the part facing the reforming daughter nuclei. Scale bars = 5 μm.
Figure 5.
Figure 5.
Mutant analysis revealed TPXL2 as nonessential whereas TPXL3 is essential for embryo development. A, Schematic overview of the gene models for TPXL2 (top) and TPXL3 (bottom) with indication of the positions of the T-DNA insertion alleles analyzed. Primers used for RT-qPCR and genotyping analysis are indicated by color-coded arrowhead pairs. B, RT-qPCR analysis of homozygous tpxl2 mutants showing the absence of full-length transcripts over the T-DNA positions (n.d., not detected). Error bars = se. C, Representative silique pictures and quantification of seed development of selfed tpxl3-1 (+/−) and tpxl3-2 (+/−) plants grown together with control plants (Col-0). Both TPXL3 alleles show a high percentage of aborted ovules and some aborted seeds. The quantification shows the combined result of different siliques from different plants. For both Col-0 and tpxl3-2, 20 siliques were analyzed (from two different plants each), whereas for tpxl3-1, we analyzed 30 siliques (from three different plants). D and E, Introducing TPXL3-GFP into tpxl3-2(+/−) mutants allowed identification of homozygous tpxl3-2 mutants (two independent lines are shown; “1” and “2”), which develop similarly to the wild-type controls (“C”). Genotyping results revealed the absence of wild-type (LP + RP) fragment (∼2.5-kb) and the presence of the T-DNA specific fragment (RP + T-DNA; ∼0.5-kb) in two independent lines carrying the TPXL3-GFP transgene (“1” and “2”) in contrast to control plants (“C”).

References

    1. Alfaro-Aco R, Thawani A, Petry S (2017) Structural analysis of the role of TPX2 in branching microtubule nucleation. J Cell Biol 216: 983–997 - PMC - PubMed
    1. Barnett J. (1991) Microtubules in interphase nuclei of Aesculus hippocastanum L. Ann Bot (Lond) 68: 159–165
    1. Barr AR, Gergely F (2007) Aurora-A: The maker and breaker of spindle poles. J Cell Sci 120: 2987–2996 - PubMed
    1. Bayliss R, Sardon T, Vernos I, Conti E (2003) Structural basis of Aurora-A activation by TPX2 at the mitotic spindle. Mol Cell 12: 851–862 - PubMed
    1. Bayliss R, Sardon T, Ebert J, Lindner D, Vernos I, Conti E (2004) Determinants for Aurora-A activation and Aurora-B discrimination by TPX2. Cell Cycle 3: 404–407 - PubMed

Publication types

MeSH terms

Substances