. 2019 May 16;10(1):2192.
doi: 10.1038/s41467-019-09823-5.

Yin Yang 1 sustains biosynthetic demands during brain development in a stage-specific manner

Affiliations

Yin Yang 1 sustains biosynthetic demands during brain development in a stage-specific manner

Luis Zurkirchen et al. Nat Commun. .

Abstract

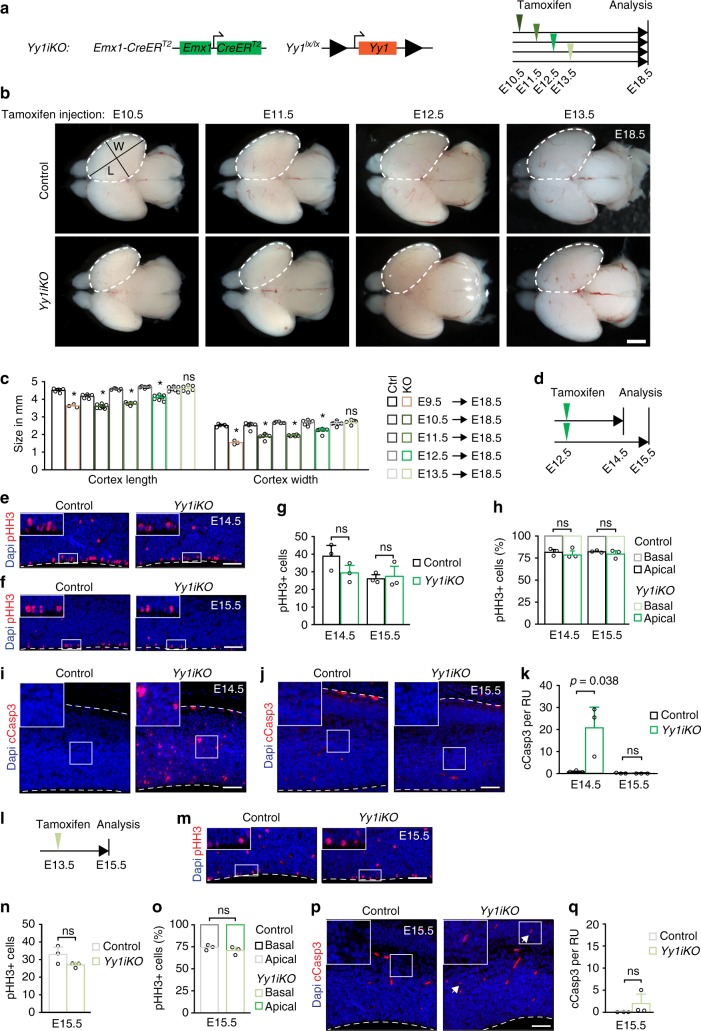
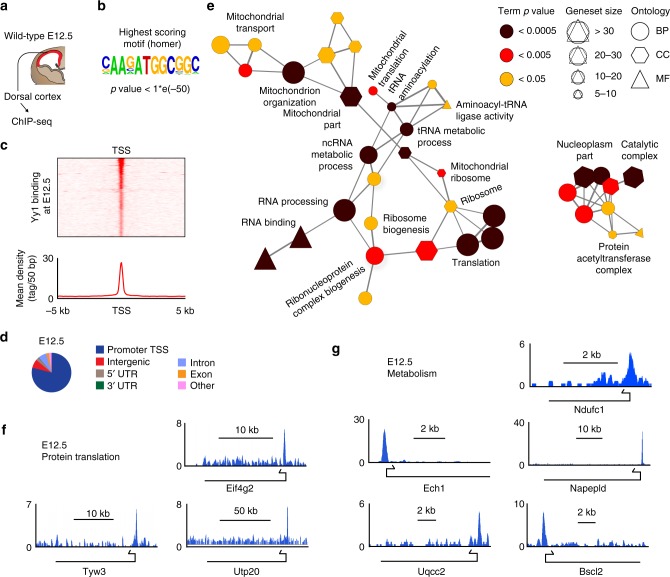
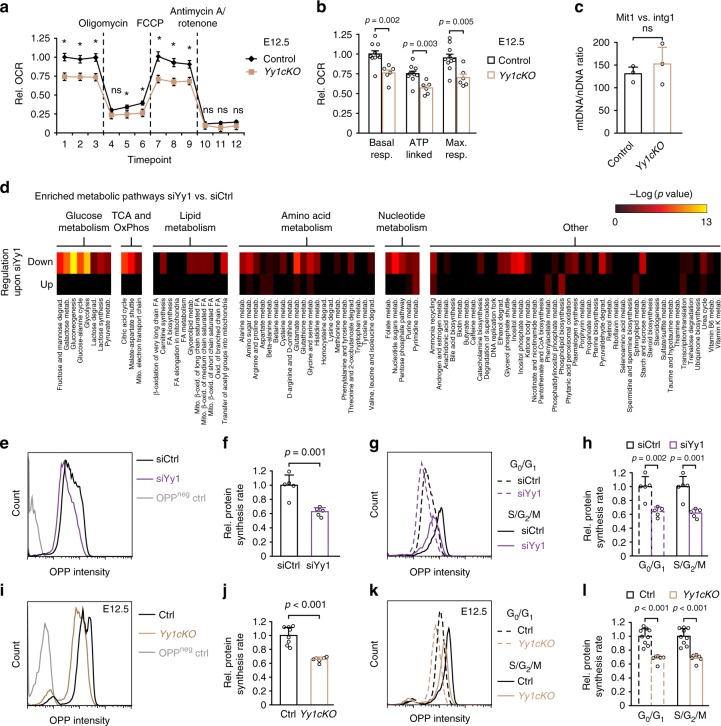
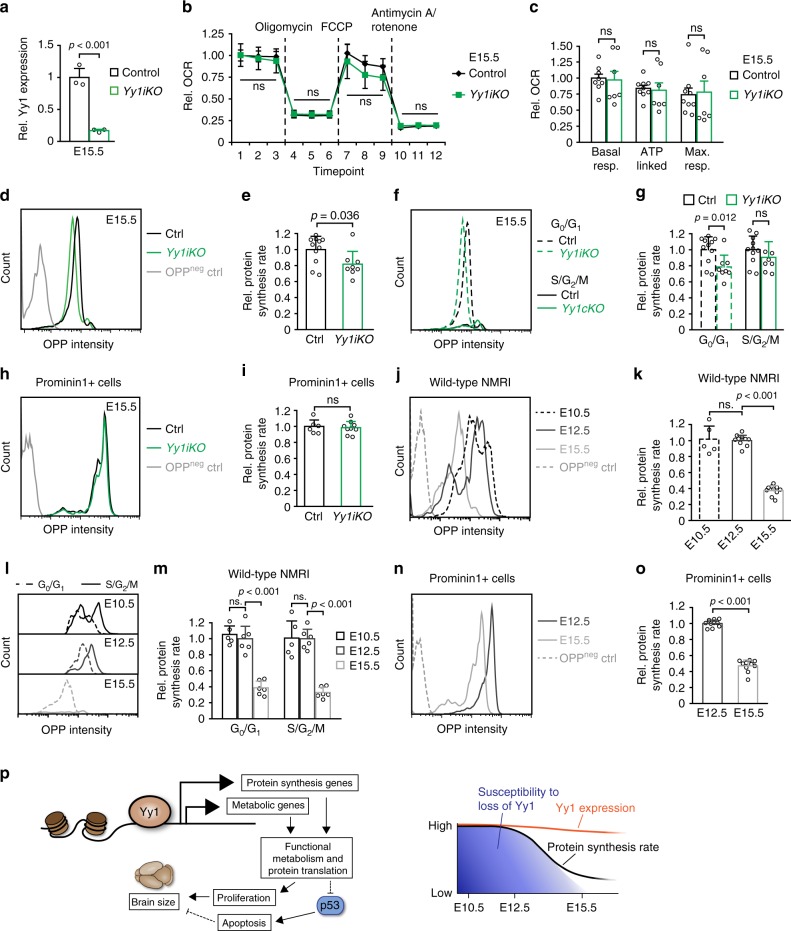
The transcription factor Yin Yang 1 (YY1) plays an important role in human disease. It is often overexpressed in cancers and mutations can lead to a congenital haploinsufficiency syndrome characterized by craniofacial dysmorphisms and neurological dysfunctions, consistent with a role in brain development. Here, we show that Yy1 controls murine cerebral cortex development in a stage-dependent manner. By regulating a wide range of metabolic pathways and protein translation, Yy1 maintains proliferation and survival of neural progenitor cells (NPCs) at early stages of brain development. Despite its constitutive expression, however, the dependence on Yy1 declines over the course of corticogenesis. This is associated with decreasing importance of processes controlled by Yy1 during development, as reflected by diminished protein synthesis rates at later developmental stages. Thus, our study unravels a novel role for Yy1 as a stage-dependent regulator of brain development and shows that biosynthetic demands of NPCs dynamically change throughout development.


Conflict of interest statement

The authors declare no competing interests.

Figures

Fig. 1
Fig. 1
Yy1 maintains proliferation and cell survival at early stages of cortex development. a Genotype of Yy1cKO mice with conditional ablation of Yy1 in the dorsal cortex. b Deletion of Yy1 leads to decreased cortex (ctx) size at E18.5. cf Loss of Yy1 decreases the number of pHH3+ cells at E12.5 (c, e). At E15.5, the number of mitotic cells is comparable to control embryos (d, e). The ratio of apical vs. basal pHH3+ cells does not change upon knockout of Yy1 (f). The number of pHH3+ cells is normalized to 600 μm ventricular zone length (E12.5 and E15.5) and normalized to cortical thickness (E15.5). gi The percentage of CyclinD1+ cells decreases upon ablation of Yy1 at E12.5 (g, i), but not at E15.5 (h, i). jl The percentage of CyclinB1+ cells is not affected in Yy1cKO embryos. mo Immunohistochemistry for cleaved Caspase 3 (cCasp3) shows that the number of apoptotic cells transiently increases at E12.5 in Yy1cKO embryos. Radial unit (RU) = 100 µm. p Experimental outline for knockdown experiments. q Efficient knockdown of Yy1 in isolated E11.5 cortical progenitor cells decreases CyclinD1 protein levels without affecting CyclinB1 protein levels. r Cell cycle analysis by flow cytometry reveals that knockdown of Yy1 increases the number of cells in G1 cell cycle phase. s Flow cytometric analysis of the apoptotic marker Annexin V. Knockdown of Yy1 in isolated E11.5 cortical progenitor cells increases the number of Annexin V+ cells. Nuclei are counterstained with DAPI. Scale bars represent 1 mm (b), 100 μm (mn), 50 μm (c, d), 20 μm (g, h, j, k). Comparisons were performed using the two-tailed unpaired Student’s t test. Data are the mean ± standard deviation. *p < 0.05. ns = not significant
Fig. 2
Fig. 2
Ablation of Yy1 after E12.5 does not influence cortical development. a Genotype of mice and experimental strategy used to induce ablation of Yy1 at different developmental stages. b Later stage tamoxifen-induced ablation of Yy1 ameliorates the decrease in cortex size compared with Yy1cKO cortices (Fig. 1b). c Measurement of cortical length (L) and width (W) as indicated in b. For representative picture of E18.5 Yy1cKO cortex, see Fig. 1b. *p < 0.05. d Experimental strategy to ablate Yy1 at E12.5 in Yy1iKO embryos (for Fig. 2e–k). eh Immunostaining and quantification for pHH3+ cells at E14.5 (e, g) and E15.5 (f, g) in E12.5-ablated Yy1iKO embryos. h depicts the ratio of apical vs. basal pHH3+ cells. The number of pHH3+ cells is normalized to 600 μm ventricular zone length. ik Ablation of Yy1 at E12.5 elicits cleavage of Caspase 3 (cCasp3) at E14.5 (i, k) but not at E15.5 (j, k). Note that red signals visible at E15.5 are blood cells. l Experimental strategy to ablate Yy1 at E13.5 in Yy1iKO embryos (for Fig. 2m–q). mo The total number and ratio of apical vs. basal pHH3+ cells remains unchanged upon late ablation of Yy1 at E13.5. The number of pHH3+ cells is normalized to 600 μm ventricular zone length. p, q Ablation of Yy1 at E13.5 only induces cell death in a minority of cells (indicated by arrows, remaining red signals are blood cells). Nuclei are counterstained with DAPI. Scale bars represent 1 mm (b), 50 µm (e, f, i, j, m, p). Comparisons were performed using ANOVA (Tukey’s multiple comparisons test) (c) and two-tailed unpaired Student’s t test (g, h, k, n, o, q). Data are the mean ± standard deviation. ns = not significant
Fig. 3
Fig. 3
Loss of Yy1 induces p53-dependent apoptosis. a Accumulation of p53 protein in Yy1cKO embryos at E12.5. b qRT-PCR of p53 mRNA levels reveals no difference upon loss of Yy1. c Genotype of Yy1 Trp53 double knockout (Yy1Trp53dKO). d, e Double knockout of Yy1 and Trp53 partially rescues cortical size at E18.5. Cortical length (L) and width (W) measurements from Control and Yy1cKO from Fig. 2c were reused for illustrative reasons. Representative images of control and Yy1cKO cortices are shown in Fig. 1b. *p < 0.01. f Knockout of Trp53 in the context of Yy1 ablation completely abolishes emergence of cleaved Caspase 3+ cells. gi Trp53 Yy1 double knockout does not restore the number of mitotic pHH3+ cells. The ratio of apical vs basal pHH3+ cell does not change (i). The numbers of pHH3+ cells are normalized to 600 μm ventricular zone length. j, k Loss of Trp53 does not rescue the number of CyclinD1+ cells in Yy1 mutant embryos. Nuclei are counterstained with DAPI. Scale bars resemble 1 mm (d), 50 µm (f, g), 20 µm (a, j). Comparisons were performed using the two-tailed unpaired Student’s t test (b, h, i, k) and ANOVA (Tukey’s multiple comparisons test) (e). Data are the mean ± standard deviation. ns = not significant
Fig. 4
Fig. 4
Yy1 regulates the expression of metabolic genes. a RNA-seq comparing Yy1cKO versus control cortex tissue at E11.5 identified 1554 differentially expressed genes (|log2 fold change| > 0.3, p < 0.05, FDR < 0.01). b Gene Ontology (GO) term network analysis on the basis of differentially regulated genes. Each node represents an enriched GO term (adjusted p value (Corrected with Bonferroni step down procedure) < 0.05). Nodes are interconnected when the gene overlap is > 50%, based on the kappa score. BP, biological process; MF, molecular function; CC, cellular component. A fully labeled version of the network is given in Supplementary Fig. 6. ce qRT-PCR validation for differentially regulated genes comparing control vs Yy1cKO cortical tissue at E12.5 confirms RNA-seq results. Comparisons were performed using the two-tailed unpaired Student’s t test. Data are the mean ± standard deviation
Fig. 5
Fig. 5
Yy1 directly binds to metabolic genes. a Genome-wide binding of Yy1 to DNA regions was analyzed by chromatin immunoprecipitation against Yy1 followed by sequencing (ChIP-seq) of cortex cells derived at E12.5. Statistical analysis of the enriched regions identified 464 binding events at E12.5 (FDR < 0.001), present in at least 1 of 2 replicas. b Homer motif discovery revealed a known Yy1-binding motif as the highest scoring motif (p < 1*e-50). c Read cluster profile reveals preferential binding of Yy1 close to the transcription start site (TSS) of target genes. d Distribution of binding sites to different genomic locations. Yy1 binds preferentially to the promoter region of the transcription start site (TSS) of genes. e Gene Ontology (GO) term network analysis on the basis of Yy1-bound target genes at E12.5. Each node represents an enriched GO term (adjusted p value (Corrected with Bonferroni step down procedure) < 0.05). Nodes are interconnected when the gene overlap is > 50%, based on the kappa score. BP, biological process; MF, molecular function; CC, cellular component. A fully labeled version of the network is given in Supplementary Fig. 8. f, g Genomic snapshots depicting Yy1-binding events at metabolic genes (g) and genes involved in protein translation (f). kb, kilo bases
Fig. 6
Fig. 6
Yy1 controls cortical metabolism and protein translation rate. a, b Oxygen consumption rate (OCR) measurement of isolated cortical cells at E12.5 using a Seahorse Extracellular Flux Analyzer reveals impaired mitochondrial bioenergetics upon ablation of Yy1. Injection of electron transport chain inhibitors are indicated after measurement 3 (oligomycin, ATP synthase inhibitor), 6 (FCCP, mitochondrial uncoupler) and 9 (Antimycin A/rotenone, complex III & I inhibitors). Parameters derived from a are indicated in b: basal respiration, ATP-linked OCR, and maximum respiration capacity. Data represented relative to first basal respiration measurement of controls and as a mean of n = 9 (control), n = 6 (Yy1cKO) error bars indicate standard error of the mean. c qRT-PCR for mitochondrial DNA content shows no difference between Yy1cKO and control cortex tissue. Graphs present mitochondrial (Mit1) versus nuclear (intergenic region, intg1) DNA ratio. d Metabolomic alterations in isolated E11.5 NPCs upon knockdown of Yy1 for 48 h. Heatmap shows enrichment of metabolic pathways which are downregulated or upregulated upon treatment with siYy1. Abbreviations: oxidative phosphorylation (OxPhos), β-oxidation (β-Ox), fatty acid (FA), metabolism (metab.), mitochondrial (mito.), degradation (degrad.). eh Knockdown of Yy1 reduces protein translation rate. OP-puro (OPP) intensity histogram of representative siRNA-treated samples pulsed with OPP for 30 min and OPP-negative control (e). Quantification of mean fluorescent OPP intensity (f). OPP incorporation in siRNA-treated cortex cells in G0G1 (DNA content = 2c) and S/G2/M (DNA content > 2c) phases of the cell cycle (g, h). DNA content was determined using propidium iodide. i–l Reduced protein translation rate in Yy1cKO cells at E12.5. OP-puro (OPP) intensity histogram of representative E12.5 control and Yy1cKO cells pulsed with OPP for 30 min and OPP-negative control (i). Quantification of mean fluorescent OPP intensity (j). OPP incorporation in cortical cells in G0G1 (DNA content = 2c) and S/G2/M (DNA content > 2c) phases of the cell cycle (k, l). DNA content was determined using propidium iodide. Comparisons were performed using the two-tailed unpaired Student’s t test. Data are the mean ± standard deviation (c, f, h, j, l) and ± standard error of the mean (a, b). *p < 0.05. ns = not significant
Fig. 7
Fig. 7
Yy1 controls a similar gene set throughout cortex development. a Genome-wide binding of Yy1 to DNA regions was analyzed by chromatin immunoprecipitation followed by deep sequencing (ChIP-seq) of cortex cells derived at E15.5. Statistical analysis of the enriched regions identified 246 binding events at E15.5 (FDR < 0.001), present in at least 1 of 2 replicas. b Homer motif discovery revealed the known Yy1-binding motif as the highest scoring motif (p < 1*e-50). ce Read cluster profile and distribution of binding sites to different genomic locations at E15.5. Yy1 binds preferentially to the promoter region of the transcription start site (TSS) of genes. f Analysis of overlap between E12.5 and E15.5 ChIP-seq data. g RNA-seq comparing E15.5 Yy1iKO vs control (each n = 3 embryos) radial glia cells from the dorsal cortex which were isolated by microdissection and subsequent Prominin1-based (CD133-FITC) FACS. A total of 1080 genes were downregulated (660 genes) or upregulated (420 genes) upon induced knockout of Yy1 (|log2 fold change| > 0.32, p < 0.05, FDR < 0.05). h RNA-seq expression of genes at E11.5 and E15.5, which are bound by at E12.5 and E15.5, upon knockout of Yy1. *p < 0.05
Fig. 8
Fig. 8
Stage-dependent requirements for biosynthesis in NPCs. a Efficient reduction of Yy1 mRNA at E15.5 upon tamoxifen-induced (TM) ablation at E12.5. b, c Oxygen consumption rate (OCR) measurement of isolated cortical cells at E15.5 using a Seahorse Extracellular Flux Analyzer reveals that mitochondrial bioenergetics are not altered upon ablation of Yy1 at E12.5. Injection of electron transport chain inhibitors are indicated after measurement 3 (oligomycin, ATP synthase inhibitor), 6 (FCCP, mitochondrial uncoupler), and 9 (Antimycin A/rotenone, complex III & I inhibitors). Parameters derived from b are indicated in c: basal respiration, ATP-linked OCR and maximum respiration capacity. Data represented relative to first basal respiration measurement of controls and as mean of n = 9 (control), n = 7 (Yy1iKO), error bars indicate standard error of the mean. dg Protein translation rate is only mildly affected in Yy1iKO cells at E15.5 upon recombination at E12.5. OP-puro (OPP) intensity histogram of representative E15.5 control and Yy1iKO cells pulsed with OPP for 30 min and OPP negative control (d). Quantification of mean fluorescent OPP intensity (e). OPP incorporation in cortical cells in G0G1 (DNA content = 2c) and S/G2/M (DNA content > 2c) phases of the cell cycle (f, g). DNA content was determined using propidium iodide. Note that the protein translation rate of cycling progenitor cells is not significantly altered between control and Yy1iKO embryos. h, i TM-induced ablation of Yy1 at E12.5 does not alter OPP incorporation in Prominin1+ RG cells at E15.5. jo Reduced protein translation rate of E15.5 vs E12.5 and E10.5 wild-type cortical cells. OP-puro (OPP) intensity histogram of representative E10.5, E12.5, and E15.5 cells pulsed with OPP for 30 min and OPP-negative control (j). Quantification of mean fluorescent OPP intensity (k). OPP incorporation in cortical cells in G0G1 (DNA content = 2c) and S/G2/M (DNA content > 2c) phases of the cell cycle (lm). DNA content was determined using propidium iodide. The reduction of OPP incorporation is also apparent in Prominin1+ RG cells of E15.5 vs E12.5 (no). Comparisons were performed using the two-tailed unpaired Student’s t test. Data are the mean ± standard deviation (a, e, g, i, k, m, o) and ± standard error of the mean (b, c). ns = not significant. p Schematic drawing summarizing the results. The transcription factor Yy1 binds and regulates genes involved in metabolism and protein synthesis. Functional biosynthesis sustains proliferation and survival of NPCs and eventually leads to correct brain development. Despite constitutive expression of Yy1, cortical NPCs exhibit a stage-dependent susceptibility to loss of Yy1, which coincides with decreased protein translation rates at later developmental stages

References

    1. Gabriele M, et al. Yy1 haploinsufficiency causes an intellectual disability syndrome featuring transcriptional and chromatin dysfunction. Am. J. Hum. Genet. 2017;100:907–925. doi: 10.1016/j.ajhg.2017.05.006. - DOI - PMC - PubMed
    1. Donohoe ME, et al. Targeted disruption of mouse Yin Yang 1 transcription factor results in targeted disruption of mouse Yin Yang 1 transcription factor results in peri-implantation lethality. Mol. Cell Biol. 1999;19:7237–7244. doi: 10.1128/MCB.19.10.7237. - DOI - PMC - PubMed
    1. Weintraub AS, et al. YY1 is a structural regulator of enhancer-promoter loops. Cell. 2017;171:1573–1588.e28. doi: 10.1016/j.cell.2017.11.008. - DOI - PMC - PubMed
    1. Beagan JA, et al. YY1 and CTCF orchestrate a 3D chromatin looping switch during early neural lineage commitment. Genome Res. 2017;27:1139–1152. doi: 10.1101/gr.215160.116. - DOI - PMC - PubMed
    1. Blättler SM, et al. Defective mitochondrial morphology and bioenergetic function in mice lacking the transcription factor Yin Yang 1 in skeletal muscle. Mol. Cell Biol. 2012;32:3333–3346. doi: 10.1128/MCB.00337-12. - DOI - PMC - PubMed

Publication types