. 2020 Jan;27(1):210-226.
doi: 10.1038/s41418-019-0349-y. Epub 2019 May 16.

Exosomal miRNA-19b-3p of tubular epithelial cells promotes M1 macrophage activation in kidney injury

Affiliations

Exosomal miRNA-19b-3p of tubular epithelial cells promotes M1 macrophage activation in kidney injury

Lin-Li Lv et al. Cell Death Differ. 2020 Jan.

Abstract

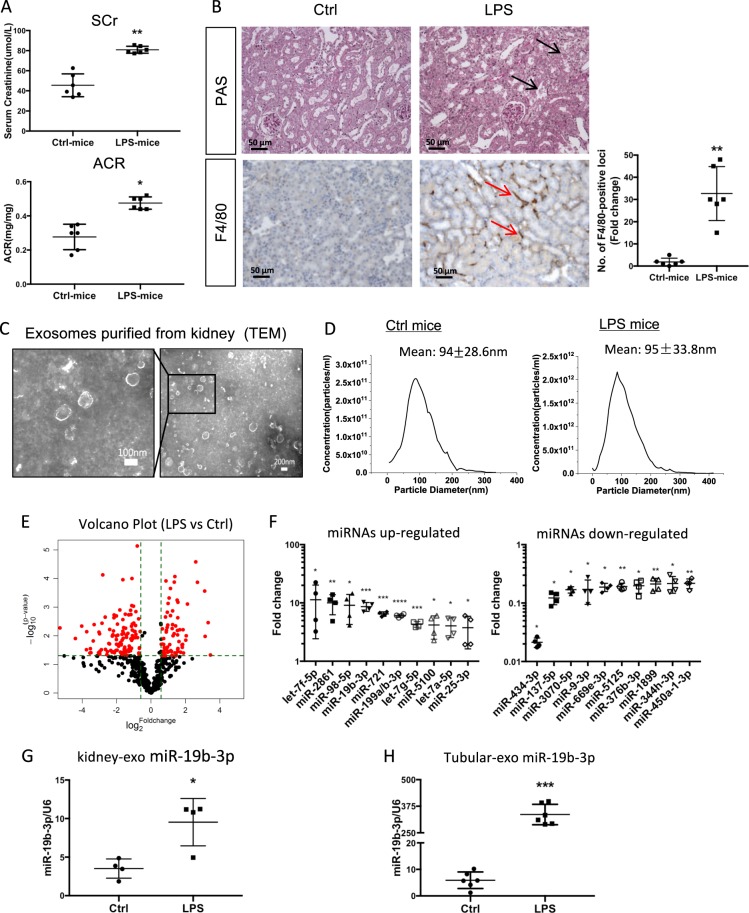
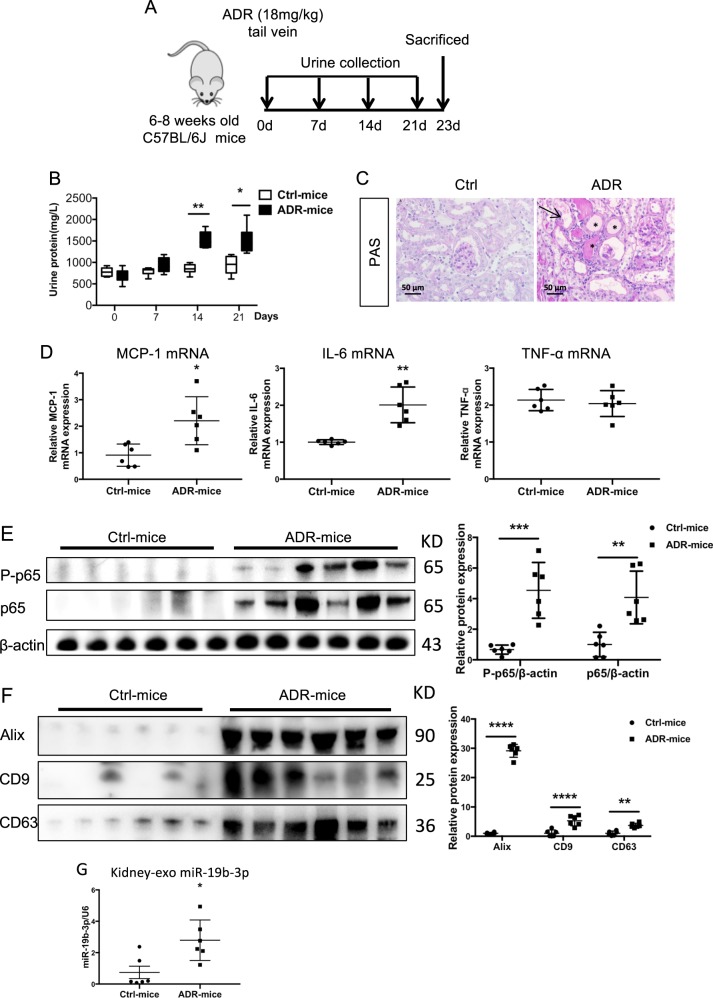
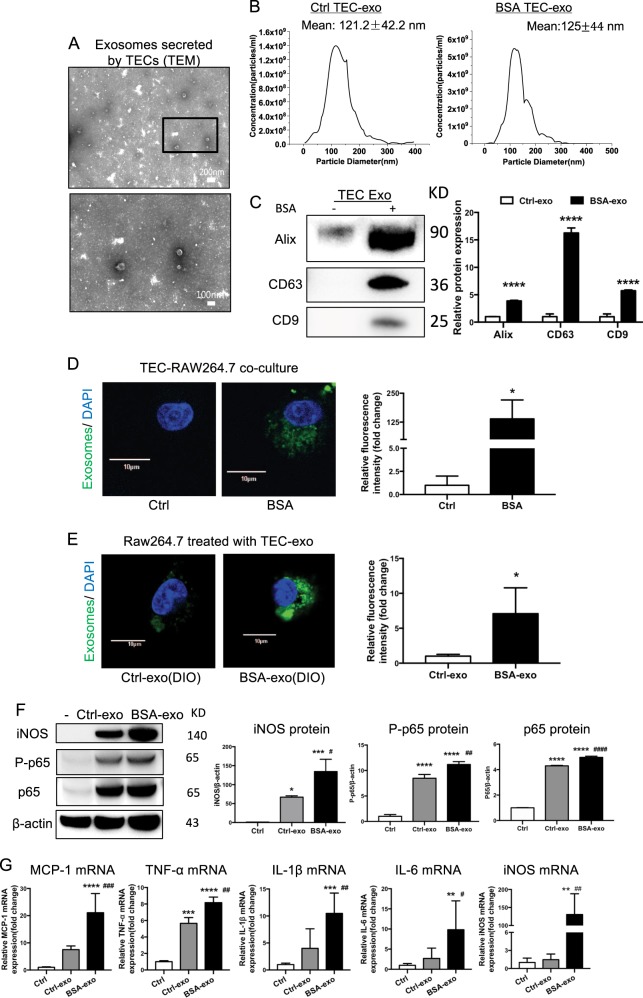
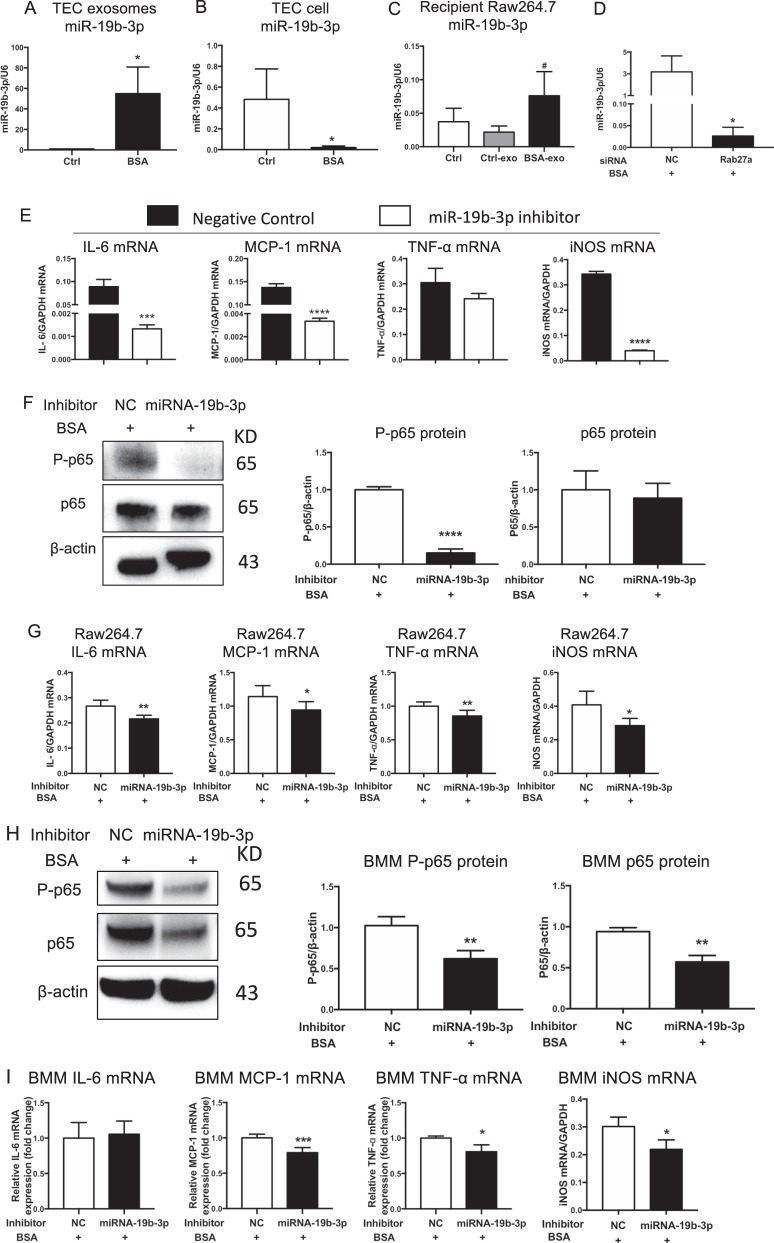
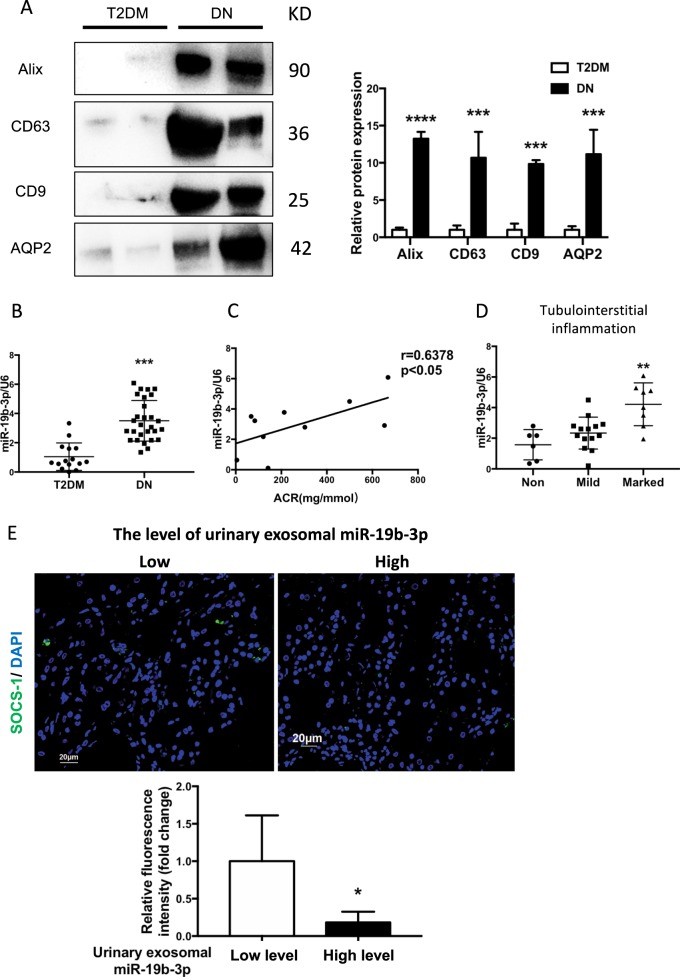
Tubulointerstitial inflammation is a common characteristic of acute and chronic kidney injury. However, the mechanism by which the initial injury of tubular epithelial cells (TECs) drives interstitial inflammation remains unclear. This paper aims to explore the role of exosomal miRNAs derived from TECs in the development of tubulointerstitial inflammation. Global microRNA(miRNA) expression profiling of renal exosomes was examined in a LPS induced acute kidney injury (AKI) mouse model and miR-19b-3p was identified as the miRNA that was most notably increased in TEC-derived exosomes compared to controls. Similar results were also found in an adriamycin (ADR) induced chronic proteinuric kidney disease model in which exosomal miR-19b-3p was markedly released. Interestingly, once released, TEC-derived exosomal miR-19b-3p was internalized by macrophages, leading to M1 phenotype polarization through targeting NF-κB/SOCS-1. A dual-luciferase reporter assay confirmed that SOCS-1 was the direct target of miR-19b-3p. Importantly, the pathogenic role of exosomal miR-19b-3p in initiating renal inflammation was revealed by the ability of adoptively transferred of purified TEC-derived exosomes to cause tubulointerstitial inflammation in mice, which was reversed by inhibition of miR-19b-3p. Clinically, high levels of miR-19b-3p were found in urinary exosomes and were correlated with the severity of tubulointerstitial inflammation in patients with diabetic nephropathy. Thus, our studies demonstrated that exosomal miR-19b-3p mediated the communication between injured TECs and macrophages, leading to M1 macrophage activation. The exosome/miR-19b-3p/SOCS1 axis played a critical pathologic role in tubulointerstitial inflammation, representing a new therapeutic target for kidney disease.


Conflict of interest statement

The authors declare that they have no conflict of interest.

Figures

Fig. 1
Fig. 1
MiRNA profile of renal exosomes in LPS-induced AKI model. a Serum levels of creatinine (Scr, **p = 0.0015 vs Ctrl-mice) and urine albumin-to-creatinine ratios (ACR, *p = 0.0249 vs Ctrl-mice) in LPS-induced acute kidney injury model at 24 h. b Histologic and immunohistologic changes in LPS-induced mice, with PAS staining and F4/80 immunostaining, respectively. Tubular injury (black arrow) and F4/80 positive macrophages in tubulointerstitium were indicated (red arrow). The fold change of the numbers of F4/80 positive loci between two groups were calculated. **p = 0.0073 vs Ctrl-mice. Scale bar, 50 μm. c Representative electron micrograph of exosomes purified from the kidneys. Scale bars, 200 and 100 nm. d The size of renal exosomes analyzed by NTA. The mean vesicle diameter was 94 ± 28.6 nm and 95 ± 33.8 nm for control and LPS mice. e The volcano plot of miRNAs analyzed by miRCURY LNA Arrays (Exiqon, Denmark) from kidney exosomes. The volcano plot was constructed with log2 expression of fold change and the corresponding tempered log2 p-value of all miRNAs. The vertical lines correspond to 2.0-fold up and down, respectively, and the horizontal line represents a p-value of 0.05. f Top ten miRNAs increased or decreased in renal exosomes from LPS-treated mice vs control mice. Data show fold change in kidney-exosomes of LPS-mice vs of Ctrl-mice. g Expression of miR-19b-3p in the renal exosomes of LPS-injected or control mice validated by real time RT-PCR (*p = 0.0461 vs Ctrl-mice). h Expression of miR-19b-3p in the tubule-derived exosomes from LPS-injected or control mice (***p = 0.0004 vs Ctrl-mice). Data presented as mean ± SD or mean ± S.E.M. of individuals included in each group. P values were calculated using unpaired Student’s t-test. (n = 6 for each group of mice. In the miRNA array analysis, exosome samples from four mice for each group were included for the screening.). Exo exosomes
Fig. 2
Fig. 2
miR-19b-3p increased in kidney exosomes in adriamycin-induced proteinuric disease model. a A schematic review of in vivo experiment. b Proteinuria in mice at 0,7,14 and 21 days. Adriamycin (ADR) mice developed severe proteinuria 2 weeks after injection. (**p = 0.0012 for 14 days and *p = 0.01 for 21 days vs Ctrl-mice) c Histologic (PAS staining) changes at 23 days after injection of ADR or PBS. ADR induced significant tubular injury and protein cast, which were pointed by arrows and stars. Scale bar, 50 μm. d mRNA expression of inflammatory cytokines in the kidney by real-time PCR. ADR mice showed significant upregulation of MCP-1(*p = 0.0267 vs Ctrl-mice), IL-6 (**p = 0.0033 vs Ctrl-mice) in the kidney. e Representative western blotting results from three independent experiments and quantification of P-p65(***p = 0.0002 vs Ctrl-mice), p65(**p = 0.0019 vs Ctrl-mice). f Representative western blotting and quantification of exosomal markers (Alix, CD9 and CD63) in renal exosomes (****p < 0.0001, **p = 0.0046 vs Ctrl-mice). g Expression of miR-19b-3p in the renal exosomes of ADR-injected or control mice (*p = 0.0463 vs Ctrl-mice). Data presented as mean ± S.E.M. of individuals included in each group. p values were calculated using unpaired Student’s t-test (n = 6 for each group of mice). Exo exosomes, Ctrl control
Fig. 3
Fig. 3
Increasing internalization of TEC-derived exosomes promoted M1 macrophage activation. a Representative electron micrograph images of exosomes isolated from TEC conditioned medium. Scale bar, 200 and 100 nm. b Shown are size distribution of exosomes isolated from TECs conditioned medium by nanoparticle analysis (NTA). c Representative western blotting and quantification of exosomal markers (including Alix, CD9 and CD63) in TEC-derived exosomes with or without BSA (****p < 0.0001 vs exosomes from control TECs). d DiO-labeled TECs were co- cultured with recipient Raw264.7 macrophages using transwell system in the absence/presence of BSA for 24 h Relative fluorescence intensity was quantified to identify the uptake of exosomes. (*p = 0.012 vs Ctrl). Scale bar, 10 μm. e Exosomes were purified from DiO-labeled TECs and were then applied to recipient Raw264.7 macrophages. Relative fluorescence intensity was calculated (*p = 0.0461 vs Ctrl-exosomes). f Representative western blotting and quantification of iNOS, P-p65, p65 in recipient Raw264.7 macrophages treated with TEC-derived exosomes in the absence or presence of BSA. g Inflammatory cytokine mRNA (MCP-1, IL1β, TNF-α, IL6) and iNOS mRNA expression in recipient RAW264.7 macrophages were detected by real-time PCR. **p < 0.01; ***p < 0.001; ****p < 0.0001 compared with cells without exosomes; #p < 0.05; ##p < 0.01; ###p < 0.001 compared with cells with Ctrl-exo. Ctrl exo exosomes from TECs without BSA, p values were calculated using one-way ANOVA test. Bornferroni-corrected α threshold was used for statistical significance of multiple comparison. BSA-exo exosomes from TECs with BSA treatment. Data presented as mean ± S.E.M. of three independent experiments
Fig. 4
Fig. 4
TECs exosomes promoted M1 macrophage activation via miR-19b-3p. a–c Expression of miR-19b-3p in TEC-derived exosomes (*p = 0.0225 vs Ctrl TEC-derived exosomes), TEC cells (*p = 0.0491 vs Ctrl TECs) and recipient Raw264.7 macrophages treated with TEC-derived exosomes (#p = 0.0495 vs Ctrl Raw264.7 macrophages), respectively. d Expression of miR-19b-3p in TEC-derived exosomes with Rab27a silencing. *p = 0.0269 vs NC. e Inflammatory cytokines and iNOS expression in macrophages treated with exosomes from TECs transfected with miR-19b-3p inhibitor or NC. Exosomes were purified and applied to recipient Raw264.7 macrophages. Upregulation of IL6, MCP-1 and iNOS mRNA was remarkably reversed in TEC-exo with miR-19b-3p inhibitor. ***p = 0.0007; ****p < 0.0001 vs cells with NC inhibitor. f, g Raw264.7 macrophages were transfected with NC or miR-19b-3p inhibitor in the presence of BSA. f Representative western blotting of three independent experiments, and quantification of P-p65(****p < 0.0001 versus NC) and p65 in Raw264.7 macrophages. g Inflammatory cytokine (IL6, **p = 0.0025; MCP-1, *p = 0.0463; TNF- α, **p = 0.0072 vs NC) and iNOS mRNA expression (**p = 0.0299 vs NC) in Raw264.7 macrophages was detected by RT-PCR. h, i Bone marrow-derived macrophages (BMMs) were transfected with NC or miR-19b-3p inhibitor in the presence of BSA. h Representative western blotting of three independent experiments, and quantification of P-p65(**p = 0.0089 versus BMMs with NC inhibitor), p65(**p = 0.0023 versus BMMs with NC inhibitor) in BMMs after transfection. I Inflammatory cytokine (IL6; MCP-1, ***p = 0.00045; TNF- α, p = 0.0277 vs NC) and iNOS (*p = 0.014 vs NC) mRNA expression in BMMs was detected by RT-PCR. NC negative control, Ctrl exo exosomes from TECs without BSA, BSA-exo exosomes from TECs with BSA treatment. Data presented as mean ± S.E.M. of three independent experiments. p values were calculated using unpaired Student’s t-test
Fig. 5
Fig. 5
Exosomal miR-19b-3p activates NF- κB in macrophage via targeting SOCS-1. a Shown are miR-19b-3p binding sites in the SOCS-1 3′ UTR. The binding sequence of miR-19b-3p are located at nucleotide 292 to 299 from the 3′ UTR as predicted in TargetScan Release 7.0. b mRNA and protein expression of SOCS-1 in recipient Raw264.7 macrophages treated with TEC-exo by RT-PCR and western blot analysis. Representative blots and quantification showed significant repression of SOCS1 in BSA-exo group. *p = 0.0344; **p = 0.0026 vs Ctrl; #p = 0.0261; ##p = 0.0054 vs Ctrl-exo. c, d Overexpression of miR-19b-3p in Raw264.7 macrophages and BMMs induced significant reduction of SOCS-1 protein revealed by western blot. **p = 0.0035; ****p < 0.0001 vs macrophages with NC mimic. e, f Inhibition of miR-19b-3p in Raw264.7 macrophages and BMMs induced significant upregulation of SOCS-1 protein. *p = 0.0129; **p = 0.0058 vs Raw264.7 macrophages with NC inhibitor, **p = 0.0049 and 0.0019 vs BMMs with NC inhibitor. NC negative control. BSA. g Luciferase reporter assay was performed with constructs with negative control(NC), SOCS-1 3′ untranslated region(UTR) or SOCS-1 3′ -UTR-mutant. 293T cells were transfected with these constructs and the miR-19b-3p overexpressed plasmid. *p = 0.032, compared with the NC + miR-19b-3p group. h The expression of SOCS-1 in macrophages treated with exosomes from TECs transfected with miR-19b-3p inhibitor or NC. *p = 0.0416, compared with cells with NC inhibitor. Data presented as mean ± S.E.M. of three independent experiments. p values were calculated using unpaired Student’s t-test for two groups comparison. For multiple comparison, p-values were calculated using one-way ANOVA test, Bornferroni-corrected α threshold was used for statistical significance
Fig. 6
Fig. 6
TEC exosomes promoted tubulointerstitial inflammation through miR-19b-3p in vivo. TECs were cultured and treated with BSA or PBS for 24 h after transfection of NC or miR-19b-3p inhibitor. Exosome was transferred to BALB/c mice through renal injection. Mice were euthanized 24 h after injection (n = 6 for each group). a Histologic (PAS staining) changes and F4/80 positive macrophage infiltration in the kidney. The number of F4/80 positive loci were quantified. **p = 0.0036 vs mice with Ctrl-exo and ##p = 0.0036 vs mice with NC inhibitor. b RT-PCR analysis showed mRNA expression of renal inflammatory cytokines (IL-6, MCP-1) in the kidney. BSA-exo NC group showed significant upregulation of IL-6(****p < 0.0001 vs mice with Ctrl-exo, ####p < 0.0001 vs with NC inhibitor) MCP-1(***p = 0.0002 vs mice with Ctrl-exo, ####p < 0.0001 vs with NC inhibitor) mRNA, while miR-19b-3p inhibitor reverse the upregulation significantly. Scale bar, 50 μm. For multiple comparison, p-values were calculated using one-way ANOVA test, Bornferroni-corrected α threshold was used for statistical significance. Ctrl control, NC negative control
Fig. 7
Fig. 7
Increased exosomal miR-19b-3p in urine from patients with diabetic nephropathy (DN) were associated with the severity of tubulointersitial inflammation. a Representative western blotting and quantification of exosomal markers (Alix, CD9 and CD63) and tubular marker AQP2 in urinary exosomes from T2DM and DN patients. Alix, ****p < 0.0001; CD63, ***p = 0.0003; CD9, ***p = 0.0009; AQP2, ***p = 0.0002 vs T2DM patients. b Urinary exosome miR-19b-3p in DN patients. The expression of miR-19b-3p in urinary exosomes of DN patients (n = 28) was significantly higher than type 2 diabetes (T2DM) patients (n = 15). ***p = 0.001 compared with T2DM patients. c Plots of correlation between miR-19b-3p in urinary exosomes and urinary ACR in DN patients (r = 0.6378, p < 0.05). d The level of miR-19b-3p in urinary exosomes of DN patients with normal (0, n = 6), mild (<25%, n = 14) or marked (>25%, n = 8) interstitial inflammation. Patients with marked interstitial inflammation showed the highest levels of urinary exosomal miR-19b-3p (**p = 0.0089 vs DN patients without tubulointerstitial inflammation). e Immunofluorescence of renal biopsies from patients with DN by using anti-SOCS-1(green). DN patients with lower level of miR-19b-3p in urinary exosomes shows higher expression of SOCS-1 in the tubulointerstitium(left). Relative fluorescence intensity of SOCS-1 was shown in lower panel (*p = 0.012). p values were calculated using unpaired Student’s t-test for two groups comparison. For multiple comparison, p-values were calculated using one-way ANOVA test, Bornferroni-corrected α threshold was used for statistical significance. Scale bar, 20 μm
Fig. 8
Fig. 8
Working model. Tubular epithelial cells (TECs) secrete exosomes containing miR-19b-3p upon injury, which are internalized by macrophages. And miR-19b-3p enhance NF-Κb activity through directly targeting SOCS-1, promoting the M1 macrophage activation. The communication between TECs and macrophages via exosomal-miR-19b-3p augmented the initial injury signal from TECs and promoted the development of tubulointerstitial inflammation

References

    1. Liu BC, Tang TT, Lv LL, Lan HY. Renal tubule injury: a driving force toward chronic kidney disease. Kidney Int. 2018;93:568–79. doi: 10.1016/j.kint.2017.09.033. - DOI - PubMed
    1. Bonventre JV. Dedifferentiation and proliferation of surviving epithelial cells in acute renal failure. J Am Soc Nephrol. 2003;14:55S–61. doi: 10.1097/01.ASN.0000067652.51441.21. - DOI - PubMed
    1. Smith SF, Hosgood SA, Nicholson ML. Ischemia-reperfusion injury in renal transplantation: 3 key signaling pathways in tubular epithelial cells. Kidney Int. 2019;95:50–56. doi: 10.1016/j.kint.2018.10.009. - DOI - PubMed
    1. Tan RJ, Zhou D, Liu Y. Signaling crosstalk between tubular epithelial cells and interstitial fibroblasts after kidney injury. Kidney Dis. 2016;2:136–44. doi: 10.1159/000446336. - DOI - PMC - PubMed
    1. Wang Y, Harris DC. Macrophages in renal disease. J Am Soc Nephrol. 2011;22:21–27. doi: 10.1681/ASN.2010030269. - DOI - PubMed

Publication types

MeSH terms