. 2019 Apr 1;6(Pt 3):373-386.
doi: 10.1107/S2052252519002756. eCollection 2019 May 1.

Long-wavelength native-SAD phasing: opportunities and challenges

Affiliations

Long-wavelength native-SAD phasing: opportunities and challenges

Shibom Basu et al. IUCrJ. .

Abstract

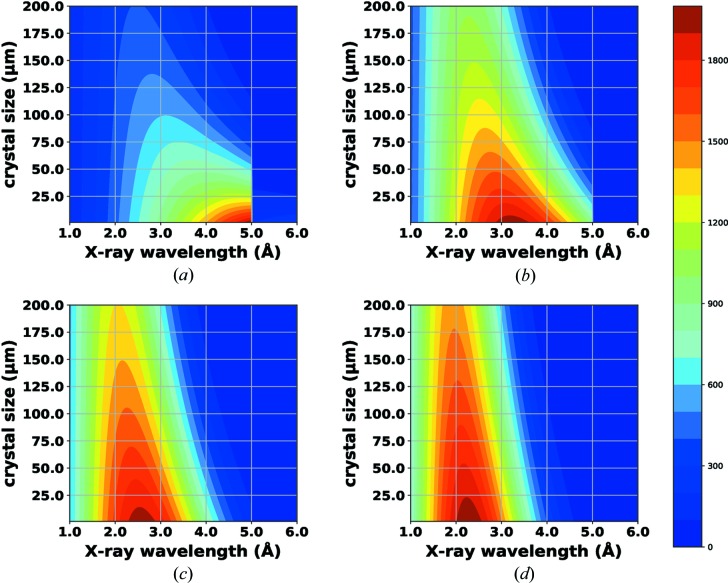
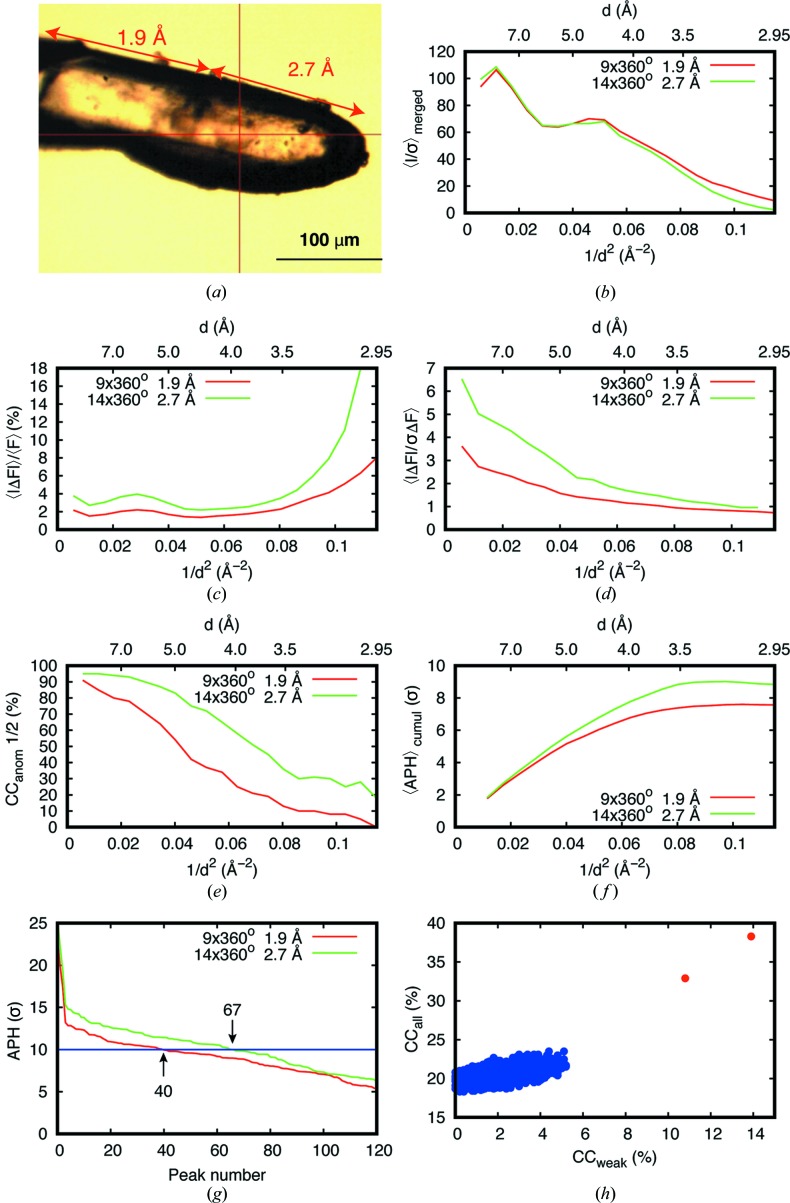
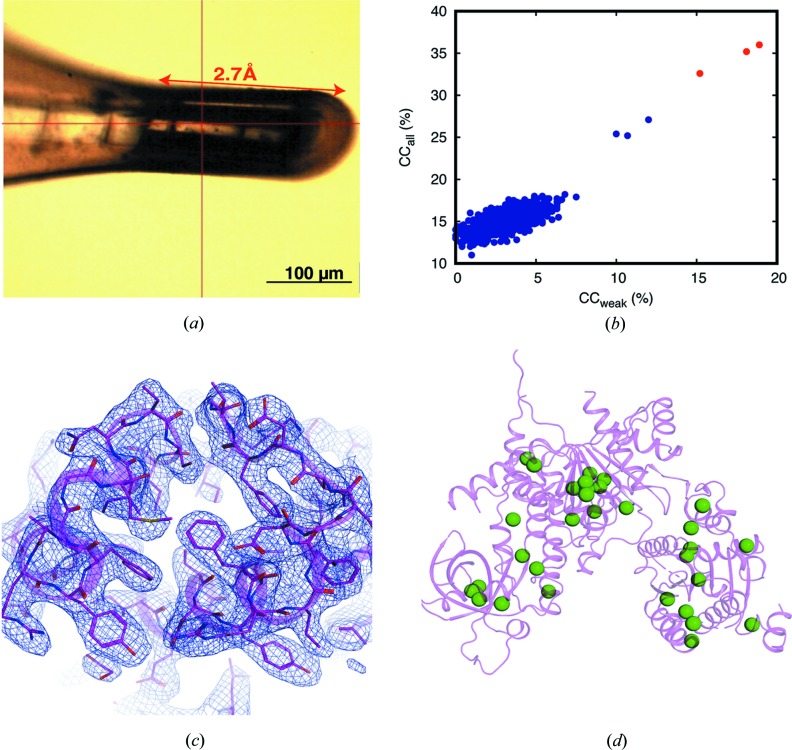
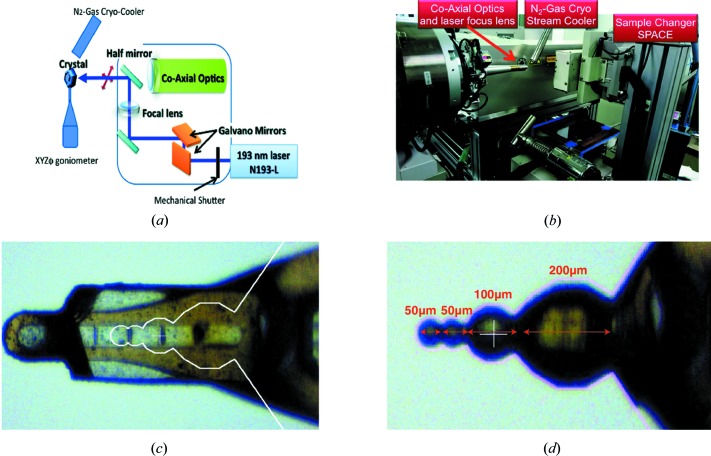
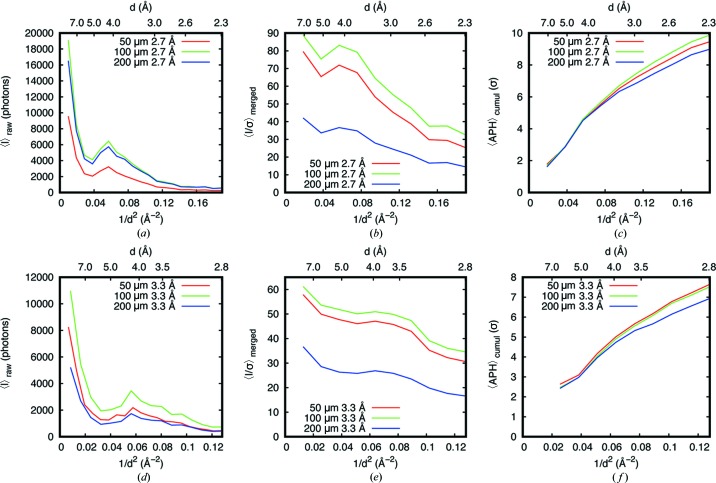
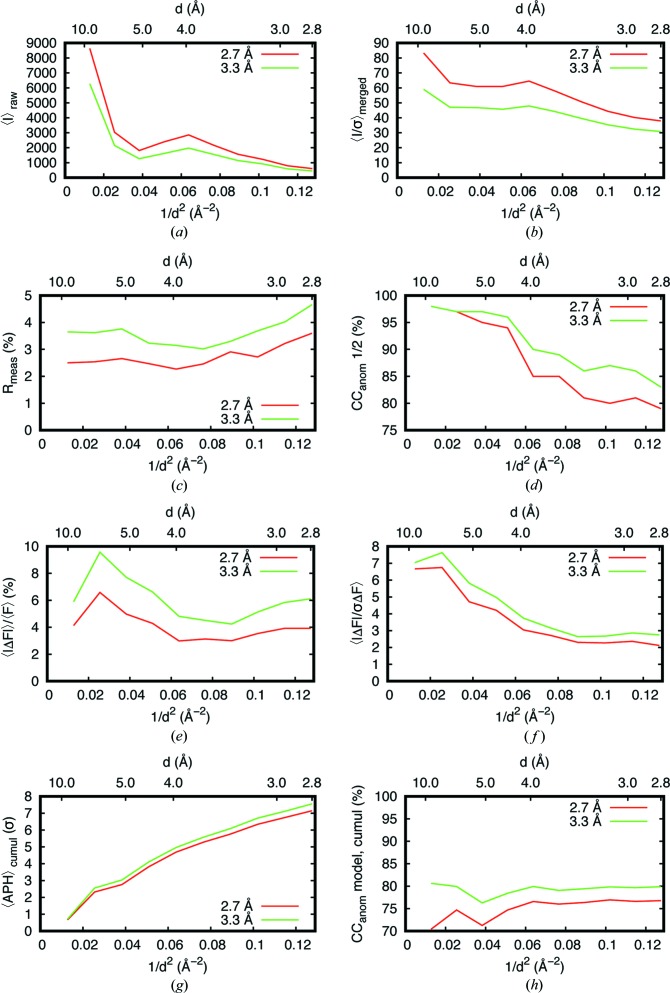
Native single-wavelength anomalous dispersion (SAD) is an attractive experimental phasing technique as it exploits weak anomalous signals from intrinsic light scatterers (Z < 20). The anomalous signal of sulfur in particular, is enhanced at long wavelengths, however the absorption of diffracted X-rays owing to the crystal, the sample support and air affects the recorded intensities. Thereby, the optimal measurable anomalous signals primarily depend on the counterplay of the absorption and the anomalous scattering factor at a given X-ray wavelength. Here, the benefit of using a wavelength of 2.7 over 1.9 Å is demonstrated for native-SAD phasing on a 266 kDa multiprotein-ligand tubulin complex (T2R-TTL) and is applied in the structure determination of an 86 kDa helicase Sen1 protein at beamline BL-1A of the KEK Photon Factory, Japan. Furthermore, X-ray absorption at long wavelengths was controlled by shaping a lysozyme crystal into spheres of defined thicknesses using a deep-UV laser, and a systematic comparison between wavelengths of 2.7 and 3.3 Å is reported for native SAD. The potential of laser-shaping technology and other challenges for an optimized native-SAD experiment at wavelengths >3 Å are discussed.

Keywords: Se/S-SAD; UV-laser cutting; absorption correction; anomalous scattering factor; crystal shaping; native-SAD phasing; single-wavelength anomalous dispersion; spherical crystals; structure determination.


Figures

Figure 1
Figure 1
2D contour plots of theoretical anomalous diffraction efficiency for S atoms (shown as a heat map) as a function of X-ray wavelength (x axis) and crystal thickness (y axis). (a) In an ideal experimental condition with ‘naked’ crystals. (b) The absorption of 50 µm of solvent around the crystal is included. (c) The absorption of 100 mm of air in the scattering path between the crystal and the detector surface is included. (d) Both the 50 µm solvent layer and the 100 mm of air are included.
Figure 2
Figure 2
Measurement and comparison of T2R-TTL crystal collected at 1.9 and 2.7 Å. (a) The crystal mounted on an elliptical Actiloop and the presence of minimum solvents around the crystal. The data-collection positions for each wavelength are marked with red lines with arrows. (b) I/σ(I) values plotted against resolution for datasets collected at both wavelengths. (c)–(f) 〈|ΔF|〉/〈F〉, 〈|ΔF|/σ(ΔF)〉, CCanom(1/2) and average anomalous peak height (〈APH〉) values are plotted against the diffraction resolution. (g) The anomalous peak heights (APH) are plotted for both wavelengths with dose-equivalent datasets. (h) CCall versus CCweak plot from the SHELXD solution for the 14 × 360° datasets at 2.7 Å.
Figure 3
Figure 3
Measurement and native-SAD phasing for Sen1 protein using 2.7 Å. (a) The crystal mounted on an elliptical ActiLoop with the data-collection region marked with a red double-headed arrow. (b) The CCall versus CCweak plot shows the successful substructure determination by SHELXD. (c) Experimental phasing map of a selected region of Sen1 after density modification (shown in blue), contoured at 1.0σ along with the Cα trace, produced by CRANK2 (shown as a light-pink colored cartoon representation). (d) A cartoon representation of Sen1 protein, with anomalous scatterers (i.e. S atoms) highlighted as green spheres.
Figure 4
Figure 4
Deep-UV-laser machine setup and laser shaping of lysozyme crystal into spheres of different diameters. (a) Schematic diagram of the deep-UV-laser machine along with focusing optics, goniometer and cryojet. (b) Top-view of the real-life setup of the deep-UV-laser system at SPring-8, Japan. (c) Original large lysozyme crystal of 800 × 500 × 400 µm (before laser cutting) and the white contour was a template made for a spherical shape with precise diameters of each of the spheres, including the error margin for the laser-cutting process. (d) The same crystal after laser cutting with a deep-UV laser of wavelength 193 nm. The size of each sphere is written in red and the diameters are marked with corresponding red lines. There are four spheres – two of 50 µm, one of 100 µm and one of 200 µm diameter. The part of the crystal on the extreme right is the ‘unshaped’ region, along with the base of the original loop. A supplementary movie of the laser-cutting process is also available in the Supporting information.
Figure 5
Figure 5
Comparison of data statistics among different spheres of different diameters at wavelengths of 2.7 and 3.3 Å. (a) and (b) Observed diffracted intensities and I/σ(I) over resolution shells at 2.7 Å. (c) Cumulative average anomalous peak height 〈APH〉 as a function of resolution at 2.7 Å. (d) and (e) Observed diffracted intensities and I/σ(I) over resolution shells at 3.3 Å. (f) Cumulative 〈APH〉 as a function of resolution at 3.3 Å.
Figure 6
Figure 6
Comparison of data statistics between wavelengths of 2.7 and 3.3 Å on a 50 µm diameter lysozyme sphere. (a)–(f) Observed diffracted intensities (〈I〉), I/σ(I), R meas, CCanom(1/2), 〈|ΔF|〉/〈F〉 and 〈|ΔF|/σ(ΔF)〉 over resolution shells. (g) and (h) Cumulative average anomalous peak height 〈APH〉 and correlation coefficient between the observed anomalous difference and the calculated anomalous difference from a refined model as a function of resolution.

References

    1. Afonine, P. V., Grosse-Kunstleve, R. W., Echols, N., Headd, J. J., Moriarty, N. W., Mustyakimov, M., Terwilliger, T. C., Urzhumtsev, A., Zwart, P. H. & Adams, P. D. (2012). Acta Cryst. D68, 352–367. - PMC - PubMed
    1. Alag, R., Bharatham, N., Dong, A., Hills, T., Harikishore, A., Widjaja, A. A., Shochat, S. G., Hui, R. & Yoon, H. S. (2009). Protein Sci. 18, 2115–2124. - PMC - PubMed
    1. Arndt, U. W. (1984). J. Appl. Cryst. 17, 118–119.
    1. Aurelius, O., Duman, R., El Omari, K., Mykhaylyk, V. & Wagner, A. (2017). Nucl. Instrum. Methods Phys. Res. B, 411, 12–16. - PMC - PubMed
    1. Austin, H. P., Allen, M. D., Donohoe, B. S., Rorrer, N. A., Kearns, F. L., Silveira, R. L., Pollard, B. C., Dominick, G., Duman, R., El Omari, K., Mykhaylyk, V., Wagner, A., Michener, W. E., Amore, A., Skaf, M. S., Crowley, M. F., Thorne, A. W., Johnson, C. W., Woodcock, H. L., McGeehan, J. E. & Beckham, G. T. (2018). Proc. Natl Acad. Sci. 115, E4350–E4357. - PMC - PubMed