. 2019 Apr 27;6(Pt 3):473-491.
doi: 10.1107/S2052252519003774. eCollection 2019 May 1.

Quantitative disentanglement of nanocrystalline phases in cement pastes by synchrotron ptychographic X-ray tomography

Affiliations

Quantitative disentanglement of nanocrystalline phases in cement pastes by synchrotron ptychographic X-ray tomography

Ana Cuesta et al. IUCrJ. .

Abstract

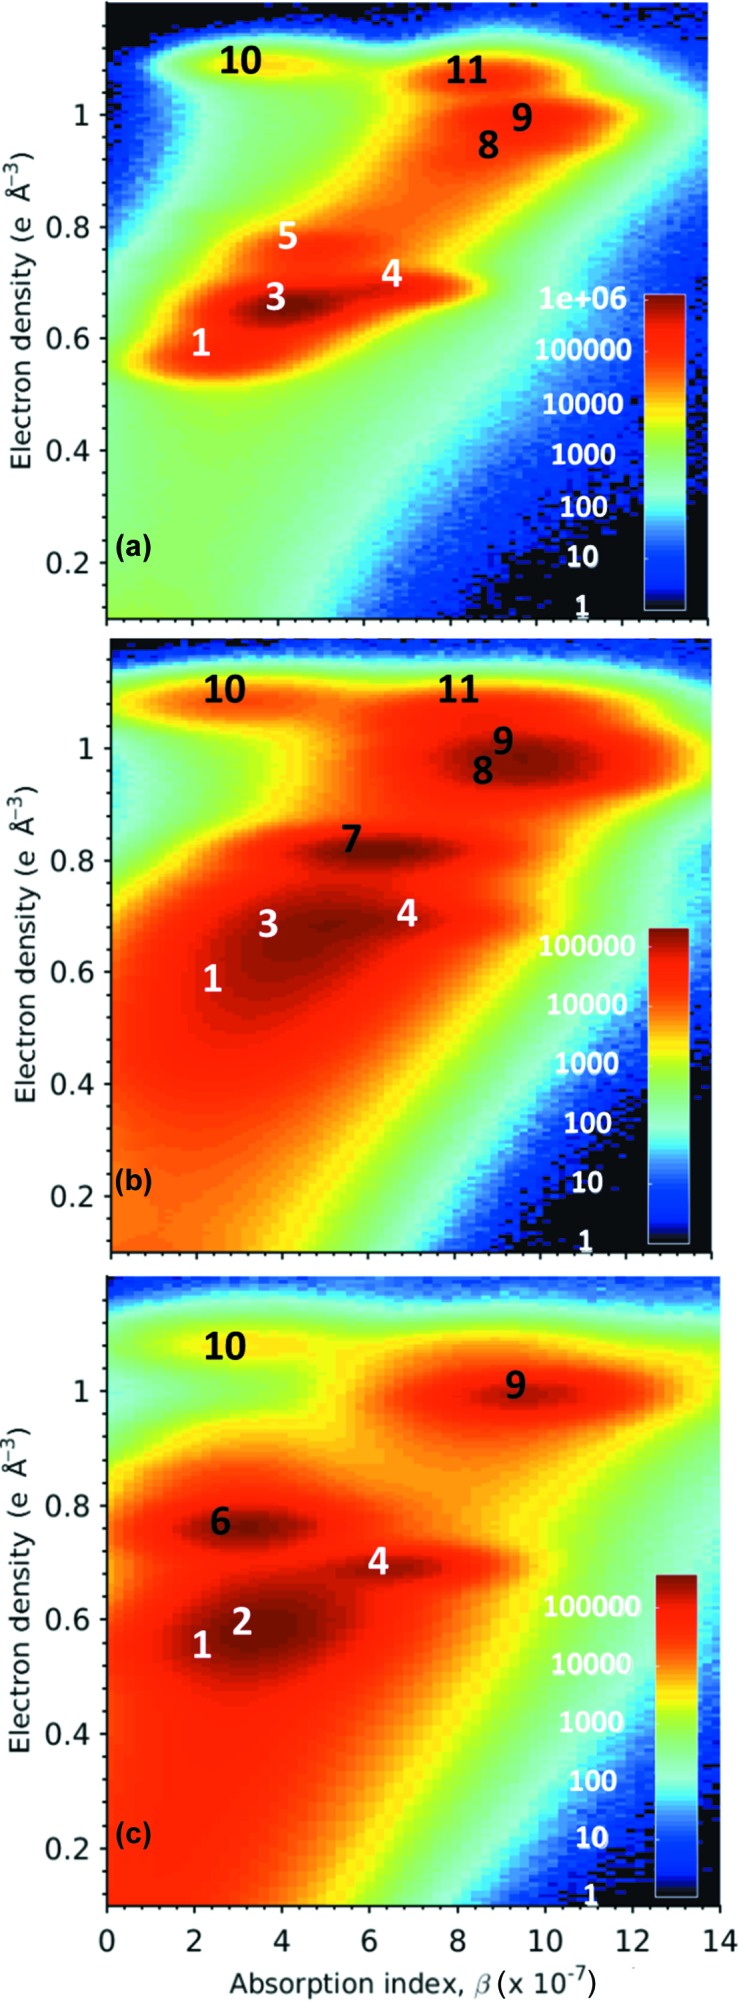
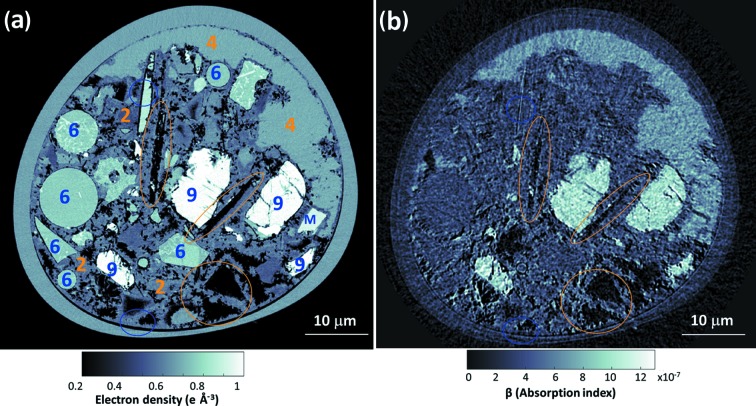
Mortars and concretes are ubiquitous materials with very complex hierarchical microstructures. To fully understand their main properties and to decrease their CO2 footprint, a sound description of their spatially resolved mineralogy is necessary. Developing this knowledge is very challenging as about half of the volume of hydrated cement is a nanocrystalline component, calcium silicate hydrate (C-S-H) gel. Furthermore, other poorly crystalline phases (e.g. iron siliceous hydrogarnet or silica oxide) may coexist, which are even more difficult to characterize. Traditional spatially resolved techniques such as electron microscopy involve complex sample preparation steps that often lead to artefacts (e.g. dehydration and microstructural changes). Here, synchrotron ptychographic tomography has been used to obtain spatially resolved information on three unaltered representative samples: neat Portland paste, Portland-calcite and Portland-fly-ash blend pastes with a spatial resolution below 100 nm in samples with a volume of up to 5 × 104 µm3. For the neat Portland paste, the ptychotomographic study gave densities of 2.11 and 2.52 g cm-3 and a content of 41.1 and 6.4 vol% for nanocrystalline C-S-H gel and poorly crystalline iron siliceous hydrogarnet, respectively. Furthermore, the spatially resolved volumetric mass-density information has allowed characterization of inner-product and outer-product C-S-H gels. The average density of the inner-product C-S-H is smaller than that of the outer product and its variability is larger. Full characterization of the pastes, including segmentation of the different components, is reported and the contents are compared with the results obtained by thermodynamic modelling.

Keywords: C-S-H gels; Portland cement; X-ray imaging; amorphous hydrogarnet; density measurements; microstructure determination; nanocrystalline components; synchrotron ptychographic tomography; thermodynamic modelling.


Figures

Figure 1
Figure 1
Selected slices of the PXCT tomograms for neat PC paste after five months of hydration at room temperature. (a) A horizontal slice of the electron-density dataset, (b) the corresponding slice of the absorption dataset, (c) a vertical slice of the electron-density dataset and (d) the corresponding slice of the absorption dataset. Some regions are identified as different component phases, based on the electron-density values, using the labelling system shown in Table 1 ▸. The highlighted regions with the HD_C-S-H/portlandite (phases 3/4 in orange circles) pair and MgO/C4AF (phases 10/11 in blue squares) pair are discussed in the text.
Figure 2
Figure 2
VOI histograms of the electron densities for (a) neat PC paste, (b) PC–CC blend paste and (c) PC–FA blend paste, after five months of hydration. Air and water porosity regions are indicated. Corresponding component phases are assigned to the different peaks using the labelling system shown in Table 1 ▸.
Figure 3
Figure 3
Bivariate histograms of absorption indexes (β) and electron densities for (a) neat PC paste, (b) PC–CC blend and (c) PC–FA blend, after five months of hydration. Corresponding component phases are assigned to the different peaks according to the labelling system given in Table 1 ▸.
Figure 4
Figure 4
Selected slices of the PXCT tomograms for PC–CC blend paste after five months of hydration at room temperature. (a) A vertical slice of the electron-density dataset and (b) the same slice of the absorption dataset. Some regions are identified as different component phases based on the electron-density values, using the labelling system given in Table 1 ▸. 3-Ip refers to phase 3 (C-S-H gel) with the inner-product morphology. 3-Op refers to phase 3 (C-S-H gel) with the outer-product morphology.
Figure 5
Figure 5
Selected slices of the PXCT tomograms for PC–FA blend paste after five months of hydration at room temperature. (a) Horizontal slice of the electron-density dataset and (b) same slice of the absorption dataset. Some regions are identified as different component phases, based on the electron-density values, using the labelling system in Table 1 ▸. Air porosity that is likely to be caused by portlandite dissolution is highlighted in pale brown. Tiny empty spaces, that are likely to be caused by chemical shrinkage, are highlighted in blue.
Figure 6
Figure 6
(a) A partially reacted C4AF particle surrounded by hydrated component phases from the electron-density tomogram of the neat PC paste. The different phases and a line to show the electron-density values are also shown. (b) Electron-density values corresponding to the yellow line in (a), with horizontal lines showing the average values of the electron densities obtained for the component phases using ten different particles, data from Table 3 ▸. It clearly shows, as an example, how phase 5 encloses the unreacted fraction of the C4AF particle. From the electron-density value and its spatial arrangement, phase 5 is concluded to be Fe–Al siliceous hydrogarnet.
Figure 7
Figure 7
(a) A partially reacted C2S particle within hydrated component phases from the electron-density tomogram of the neat PC paste. The component phases and a line to show the variation of the electron-density values are also displayed. (b) Electron-density values corresponding to the highlighted line are shown together with the horizontal lines described in Fig. 6 ▸.
Figure 8
Figure 8
Partially reacted C3S particles [plots (a) and (c)] within hydrated component phases from the electron-density tomogram of the PC–CC blend paste. The component phases and the lines to show the variation of the electron-density values are also displayed. Electron-density values corresponding to the highlighted lines in panels (a) and (c) are shown in the panels (b) and (d), respectively. Horizontal lines show the average values of the electron densities obtained for the component phases using ten different particles, data from Table 4 ▸.
Figure 9
Figure 9
(a) Unreacted spherical FA particle within hydrated component phases from the electron-density tomogram of the PC–FA blend paste. The component phases and a line to show the variation of the electron density values are also displayed. (b) Electron-density values corresponding to the highlighted line are also shown together with horizontal lines showing the average values of the electron densities obtained for the component phases using ten different particles, data from Table 5 ▸. (c) Segmented volumes of the region shown in panel (a). Colour codes: red, air porosity; light blue, water porosity; yellow, C-S-H gel (and AFt); light green, CH; light pink, FA; and brown, C2S.
Figure 10
Figure 10
Selected views of the 3D renderings of the segmented volumes showing the components for (a) neat PC paste, (b) PC–CC blend paste and (c) PC–FA blend paste. Colour codes for the different component phases are given at the bottom.

References

    1. Abràmoff, M. D., Magalhães, P. J. & Ram, S. J. (2004). Biophotonics Int. 11, 36–42.
    1. Allen, A. J., Thomas, J. J. & Jennings, H. M. (2007). Nat. Mater. 6, 311–316. - PubMed
    1. Andalibi, M. R., Kumar, A., Srinivasan, B., Bowen, P., Scrivener, K., Ludwig, C. & Testino, A. (2018). J. Mater. Chem. A, 6, 363–373.
    1. Aranda, M. A. G. (2016). Crystallogr. Rev. 22, 150–196.
    1. Artioli, G., Cerulli, T., Cruciani, G., Dalconi, M. C., Ferrari, G., Parisatto, M., Rack, A. & Tucoulou, R. (2010). Anal. Bioanal. Chem. 397, 2131–2136. - PubMed