

A Metagenomic Meta-analysis Reveals Functional Signatures of Health and Disease in the Human Gut Microbiome
- PMID: 31098399
- PMCID: PMC6517693
- DOI: 10.1128/mSystems.00332-18
A Metagenomic Meta-analysis Reveals Functional Signatures of Health and Disease in the Human Gut Microbiome
Abstract
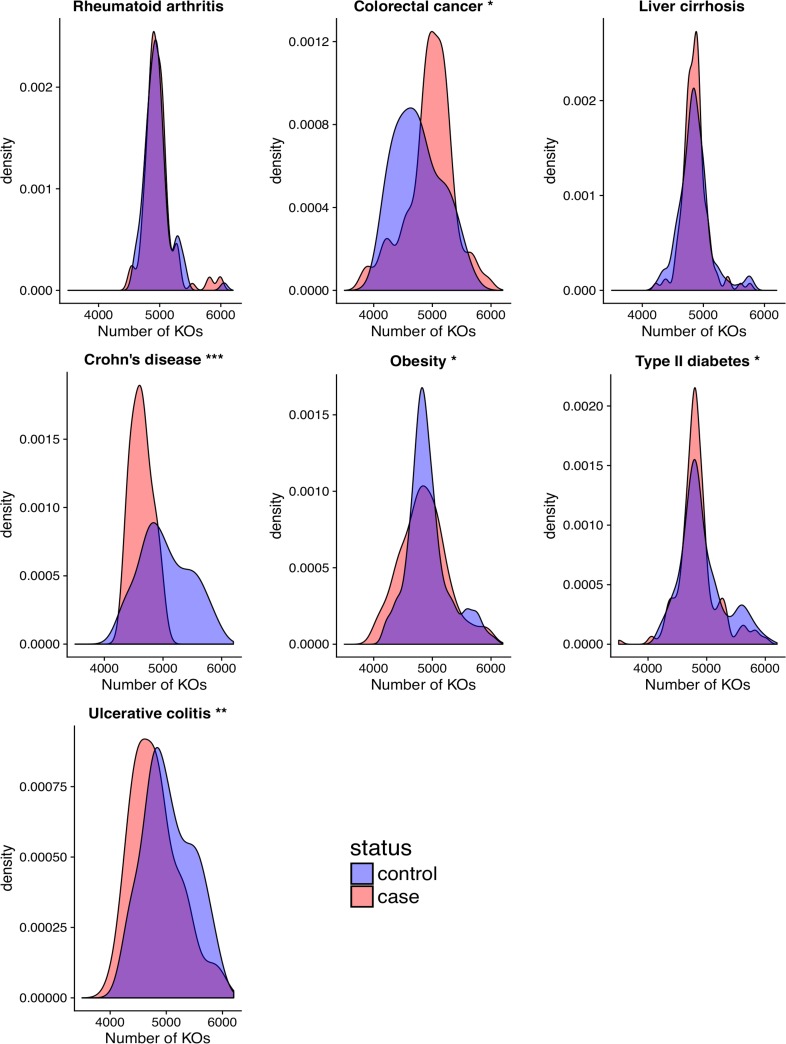
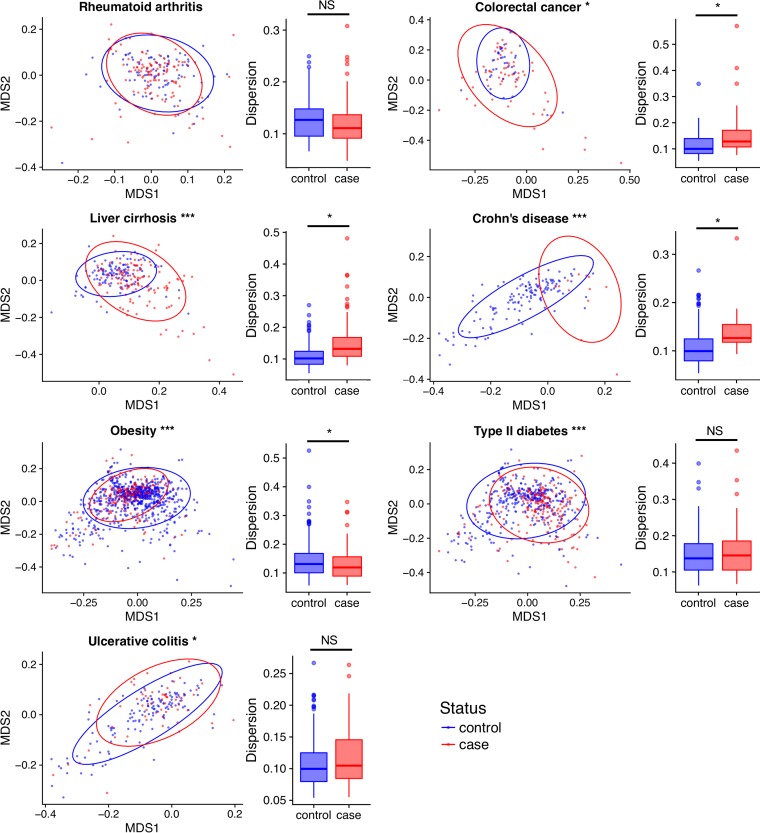
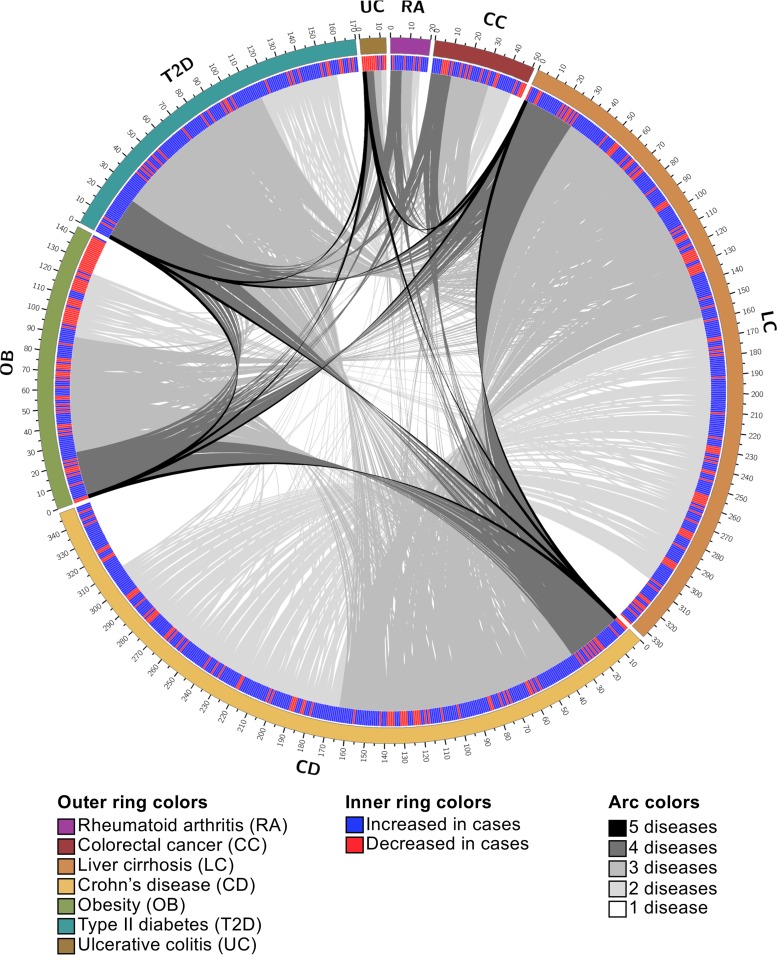
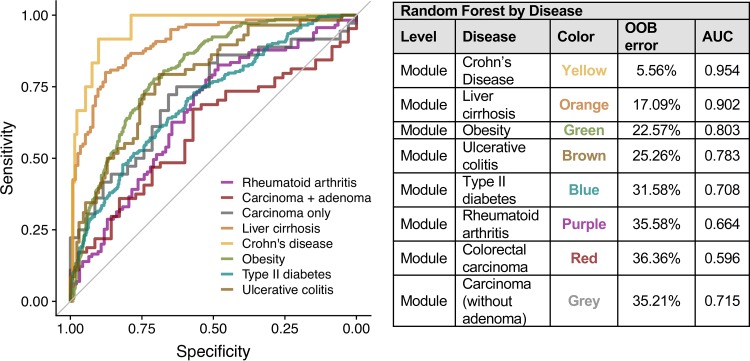
While recent research indicates that human health is affected by the gut microbiome, the functional mechanisms that underlie host-microbiome interactions remain poorly resolved. Metagenomic clinical studies can address this problem by revealing specific microbial functions that stratify healthy and diseased individuals. To improve our understanding of the relationship between the gut microbiome and health, we conducted the first integrative functional analysis of nearly 2,000 publicly available fecal metagenomic samples obtained from eight clinical studies. We identified characteristics of the gut microbiome that associate generally with disease, including functional alpha-diversity, beta-diversity, and beta-dispersion. Using regression modeling, we identified specific microbial functions that robustly stratify diseased individuals from healthy controls. Many of these functions overlapped multiple diseases, suggesting a general role in host health, while others were specific to a single disease and may indicate disease-specific etiologies. Our results clarify potential microbiome-mediated mechanisms of disease and reveal features of the microbiome that may be useful for the development of microbiome-based diagnostics. IMPORTANCE The composition of the gut microbiome associates with a wide range of human diseases, but the mechanisms underpinning these associations are not well understood. To shift toward a mechanistic understanding, we integrated distinct metagenomic data sets to identify functions encoded in the gut microbiome that associate with multiple diseases, which may be important to human health. Additionally, we identified functions that associate with specific diseases, which may elucidate disease-specific etiologies. We demonstrated that the functions encoded in the microbiome can be used to classify disease status, but the inclusion of additional patient covariates may be necessary to obtain sufficient accuracy. Ultimately, this analysis advances our understanding of the gut microbiome functions that constitute a healthy microbiome and identifies potential targets for microbiome-based diagnostics and therapeutics.
Keywords: arthritis; cancer; disease; humans; inflammatory bowel disease; liver cirrhosis; metagenomics; microbiome; obesity; type 2 diabetes.
Figures
References
Grants and funding
LinkOut - more resources
Full Text Sources
Other Literature Sources
Medical
