. 2019 Aug;39(6):833-856.
doi: 10.1007/s10571-019-00683-7. Epub 2019 May 16.

Decreased Expression of Synaptophysin 1 (SYP1 Major Synaptic Vesicle Protein p38) and Contactin 6 (CNTN6/NB3) in the Cerebellar Vermis of reln Haplodeficient Mice

Affiliations

Decreased Expression of Synaptophysin 1 (SYP1 Major Synaptic Vesicle Protein p38) and Contactin 6 (CNTN6/NB3) in the Cerebellar Vermis of reln Haplodeficient Mice

Claudia Castagna et al. Cell Mol Neurobiol. 2019 Aug.

Abstract

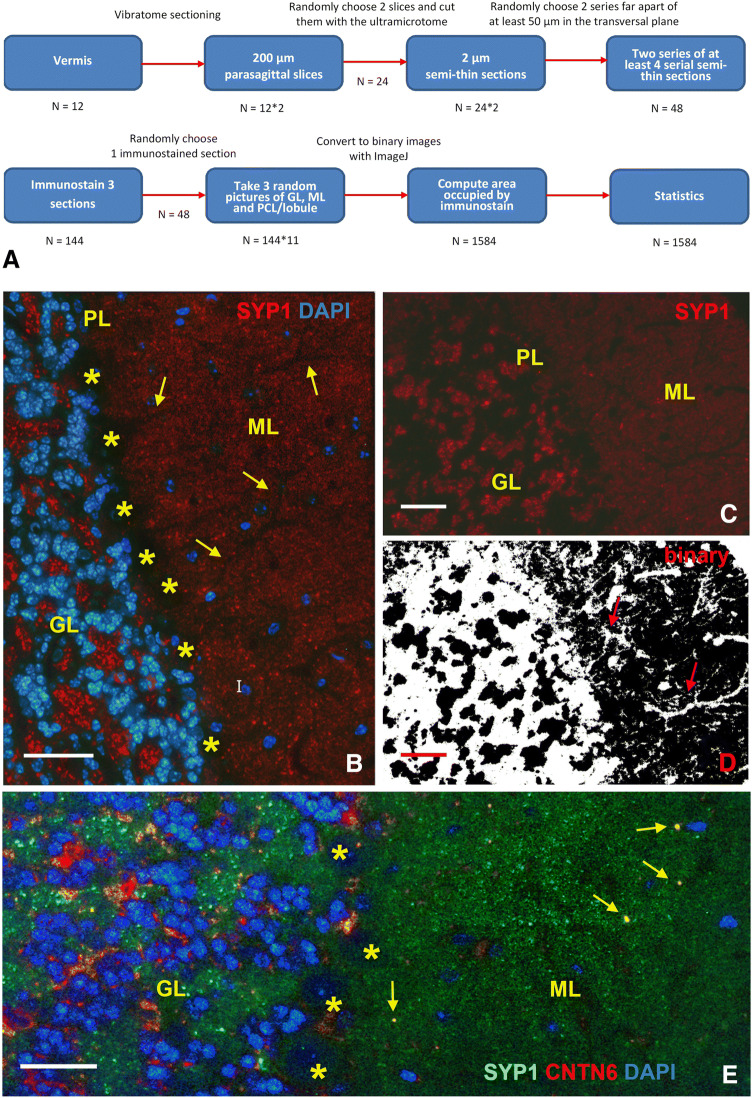
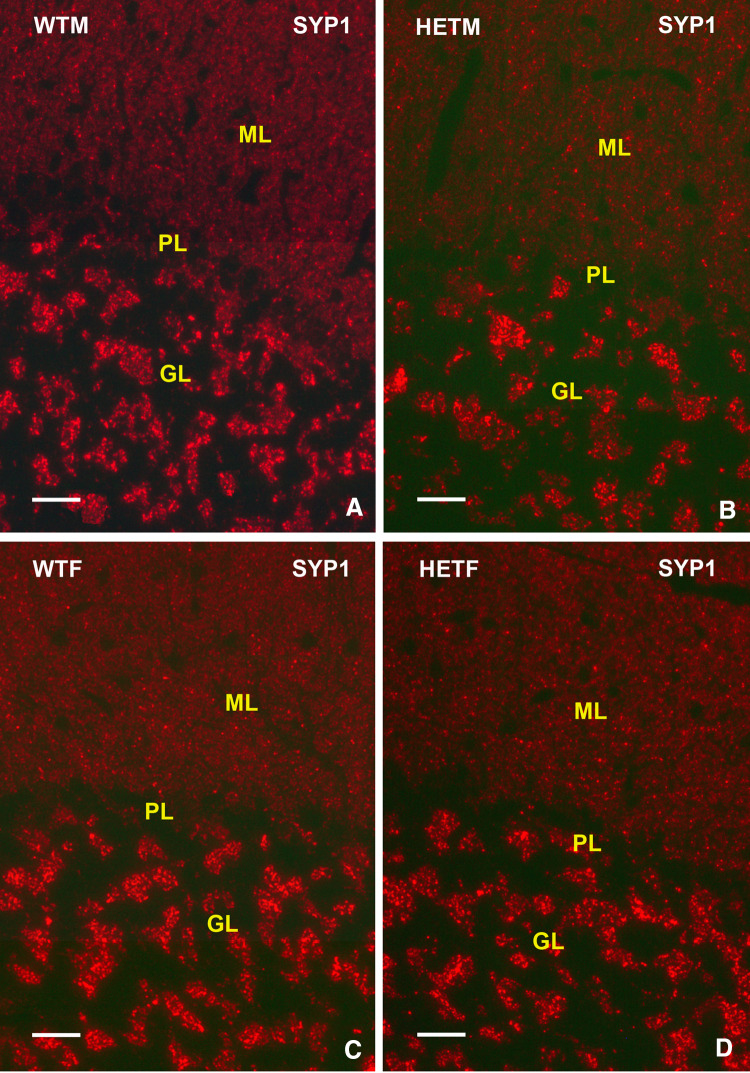
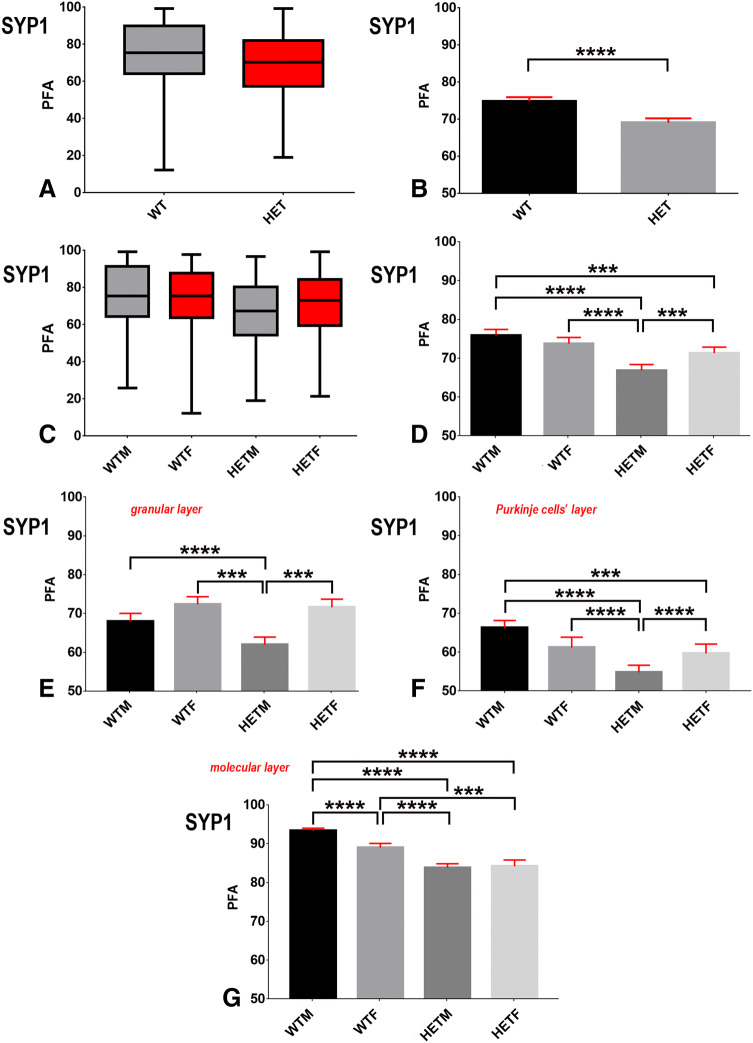
Reeler heterozygous mice (reln+/-) are seemingly normal but haplodeficient in reln, a gene implicated in autism. Structural/neurochemical alterations in the reln+/- brain are subtle and difficult to demonstrate. Therefore, the usefulness of these mice in translational research is still debated. As evidence implicated several synapse-related genes in autism and the cerebellar vermis is structurally altered in the condition, we have investigated the expression of synaptophysin 1 (SYP1) and contactin 6 (CNTN6) within the vermis of reln+/- mice. Semi-thin plastic sections of the vermis from adult mice of both sexes and different genotypes (reln+/- and reln+/+) were processed with an indirect immunofluorescence protocol. Immunofluorescence was quantified on binary images and statistically analyzed. Reln+/- males displayed a statistically significant reduction of 11.89% in the expression of SYP1 compared to sex-matched wild-type animals, whereas no differences were observed between reln+/+ and reln+/- females. In reln+/- male mice, reductions were particularly evident in the molecular layer: 10.23% less SYP1 than reln+/+ males and 5.84% < reln+/+ females. In reln+/- females, decrease was 9.84% versus reln+/+ males and 5.43% versus reln+/+ females. Both reln+/- males and females showed a stronger decrease in CNTN6 expression throughout all the three cortical layers of the vermis: 17-23% in the granular layer, 24-26% in the Purkinje cell layer, and 9-14% in the molecular layer. Altogether, decrease of vermian SYP1 and CNTN6 in reln+/- mice displayed patterns compatible with the structural modifications of the autistic cerebellum. Therefore, these mice may be a good model in translational studies.

Keywords: Cerebellum; Contactin 6; Heterozygous; Reelin; Synapses; Synaptophysin 1; Vermis.


Conflict of interest statement

The authors declare that they have no conflict of interest.

Figures

Fig. 1
Fig. 1
Method for quantitative analysis of SYP1 immunostaining. a Statistics’ plan, bd recognition of cortical layers in immunostained sections. Image in b is exemplificative of the appearance of the cerebellar cortex after SYP1 (red) and DAPI (blue) dual labeling. The synaptophysin-immunostained image in c is shown in d after it was made binary with the ImageJ software. e Double immunostaining for SYP1 (green) and CNTN6 (red) in a reln+/+ male. Note the colocalization (yellow) of the two labels in the granular layer’s glomeruli and in the molecular layer. Note also the CNTN6 + cell bodies of some Golgi cells in the granular layer. The asterisks in b and e indicate the areas occupied by the cell bodies of the Purkinje neurons that are aligned to form the PL. The arrows in b and d indicate some of the main trunks and branches forming the Purkinje neurons’ dendritic arborizations. The arrows in e show the puncta of colocalization (yellow) between SYP1 and CNTN6. CNTN6 contactin 6, GL granular layer of cerebellar cortex, ML molecular layer of cerebellar cortex, PL Purkinje cells layer of cerebellar cortex, SYP1 synaptophysin 1. Scale bars = 50 µm
Fig. 2
Fig. 2
Expression of SYP1 in different mouse reln genotypes. Exemplificative images of the pattern of distribution of SYP1 in the cerebellar cortex in reln+/+ males (a), reln+/ males (b), reln+/+ females (c), and reln+/ females (d). Note that there are no obvious difference in the pattern and intensity of immunostaining, although staining in the molecular layer of reln+/ males (b) appears slightly less intense. GL granular layer of cerebellar cortex, HETF reln+/ females, HETM reln+/ males, ML molecular layer of cerebellar cortex, PL Purkinje cells layer of cerebellar cortex, SYP1 synaptophysin 1, WTF reln+/+ females, WTM reln+/+ males. Scale bars = 50 µm
Fig. 3
Fig. 3
Expression of CNTN6 in different mouse reln genotypes. Exemplificative images of the pattern of distribution of CNTN6 in the cerebellar cortex in reln+/+ males (a), reln+/ males (b), reln+/+ females (c), and reln+/ females (d). Note that there are no obvious difference in the pattern and intensity of immunostaining. The arrows indicate immunoreactive puncta in the molecular layer, the arrow-heads the immunostained Golgi cells, the asterisks the glomeruli. GL granular layer of cerebellar cortex, HETF reln+/ females, HETM reln+/ males, ML molecular layer of cerebellar cortex, PL Purkinje cells layer of cerebellar cortex, WTF reln+/+ females, WTM reln+/+ males. Scale bars = 50 µm
Fig. 4
Fig. 4
Statistics of the expression of SYP1 in the cerebellar vermis. a, b Exploratory data analysis (a) and inferential statistics (b) on whole cerebella after grouping wild-type and heterozygous mice irrespectively of sex. A two-tailed Mann–Whitney test was performed in b as data did not pass the D’Agostino & Pearson normality test. ****P < 0.0001; c, d exploratory data analysis (c) and inferential statistics (d) of the four experimental groups defined at beginning of experimental plan. A two-tailed Mann–Whitney test was performed in d as data did not pass the D’Agostino & Pearson normality test. ****P < 0.0001, ***0.0001 < P<0.001; eg Kruskal–Wallis test followed by Dunn’s multiple comparisons test on PFAs in the granular layer (e), Purkinje cells’ layer (f) and molecular layer (g) of the cerebellar cortex after assessment that data did not pass the D’Agostino & Pearson normality test. ****P < 0.0001, ***0.0001 < P<0.001 (e, f) or = 0.0002 (g). Outliers were removed in g. Bars are 95% CI. Box-and-wisher plots display the range of data (maximum, minimum), the quartiles and the median. F females, HET heterozygous, M males, PFA percentage of fluorescent area, SYP1 synaptophysin 1, WT wild-type
Fig. 5
Fig. 5
Differences in the expression of SYP1 in specific lobules of cerebellar vermis among mouse reln genotypes. a, b Kruskal–Wallis test followed by Dunn’s multiple comparisons test on PFAs in the cerebellar cortex of vermian lobules I (a—**0.001 < P<0.01) and II (b—**0.0001 < P<0.001). c, e, f: Ordinary One-way ANOVA followed by Tukey’s multiple comparisons test on PFA in the granular layer of vermian lobule I (c—**0.001 < P<0.01) and in the Purkinje cells’ layer of vermian lobules VII (e—**P = 0.0064) and IX (f—**0.001 < P<0.01). d Kruskal–Wallis test followed by Dunn’s multiple comparisons test on PFA in the granular layer of vermian lobule II; **0.01 < P<0.001. Bars are 95% CI. F females, HET heterozygous, M males, PFA percentage of fluorescent area, SYP1 synaptophysin 1, WT wild-type
Fig. 6
Fig. 6
Expression of SYP1 in the molecular layer of lobules I–X of the cerebellar vermis in different mouse reln genotypes. ah Kruskal–Wallis test followed by Dunn’s multiple comparisons test on PFA in the molecular layer of vermian lobules I (a—*** 0.0001 < P<0.001), II (b ***0.0001 < P<0.001), III (c—**** P < 0.0001; ** 0.001 < P<0.01), IV (d—*** 0.0001 < P<0.001), V (e—**P = 0.0070), VIa (f—**P = 0.0015), VIb (g—**P = 0.0019), and VIII (h—**P = 0.0078). i, j: Ordinary One-way ANOVA followed by Tukey’s multiple comparisons test on PFA in the molecular layer of vermian lobules IX (i—** 0.001 < P<0.01) and X (j—***0.0001 < P<0.001). Bars are 95% CI. F females, HET heterozygous, M males, PFA percentage of fluorescent area, SYP1 synaptophysin 1, WT wild-type
Fig. 7
Fig. 7
Statistics of the expression of CNTN6 in the cerebellar vermis, a, b Exploratory data analysis (a) and inferential statistics (b) on whole cerebella after grouping wild-type and heterozygous mice irrespectively of sex. A two-tailed Mann–Whitney test was performed in b as data did not pass the D’Agostino & Pearson normality test. **** = P < 0.0001; c, d: exploratory data analysis (c) and inferential statistics (d) of the four experimental groups defined at beginning of experimental plan. A two-tailed Mann–Whitney test was performed in d as data did not pass the D’Agostino & Pearson normality test. **** = P < 0.0001, *** 0.0001 < P < 0.001; eg Kruskal–Wallis test followed by Dunn’s multiple comparisons test on PFAs in the granular layer (e), Purkinje cells’ layer (f) and molecular layer (g) of the cerebellar cortex after assessment that data did not pass the D’Agostino & Pearson normality test. ****P < 0.0001, ***0.0001 < P<0.001 (e, f) or = 0.0002 (g). Outliers were removed in g. Bars are 95% CI. Box-and-wisher plots display the range of data (maximum, minimum), the quartiles and the median. CNTN6 contactin 6, F females, HET heterozygous, M males, PFA percentage of fluorescent area, WT wild-type

Similar articles

Cited by

References

    1. Abel JM, Witt DM, Rissman EF (2011) Sex differences in the cerebellum and frontal cortex: roles of estrogen receptor alpha and sex chromosome genes. Neuroendocrinology 93(4):230–240 - PMC - PubMed
    1. Ago Y, Condro MC, Tan YV, Ghiani CA, Colwell CS, Cushman JD, Fanselow MS, Hashimoto H, Waschek JA (2015) Reductions in synaptic proteins and selective alteration of prepulse inhibition in male C57BL/6 mice after postnatal administration of a VIP receptor (VIPR2) agonist. Psychopharmacology 232(12):2181–2189 - PMC - PubMed
    1. Andersen TE, Finsen B, Goffinet AM, Issinger OG, Boldyreff B (2002) A reeler mutant mouse with a new, spontaneous mutation in the reelin gene. Mol Brain Res 105(1–2):153–156 - PubMed
    1. Anderson GR, Galfin T, Xu W, Aoto J, Malenka RC, Südhof TC (2012) Candidate autism gene screen identifies critical role for cell-adhesion molecule CASPR2 in dendritic arborization and spine development. Proc Natl Acad Sci USA 109(44):18120–18125 - PMC - PubMed
    1. Azevedo Frederico AC, Carvalho Ludmila RB, Grinberg LT, Farfel JM, Ferretti Renata EL, Leite Renata EP et al (2009) Equal numbers of neuronal and nonneuronal cells make the human brain an isometrically scaled-up primate brain. J Comp Neurol 513(5):532–541 - PubMed