. 2019 Jul;13(7):1534-1547.
doi: 10.1002/1878-0261.12505. Epub 2019 Jun 12.

Increased expression of the HDAC9 gene is associated with antiestrogen resistance of breast cancers

Affiliations

Increased expression of the HDAC9 gene is associated with antiestrogen resistance of breast cancers

Aurélien Linares et al. Mol Oncol. 2019 Jul.

Abstract

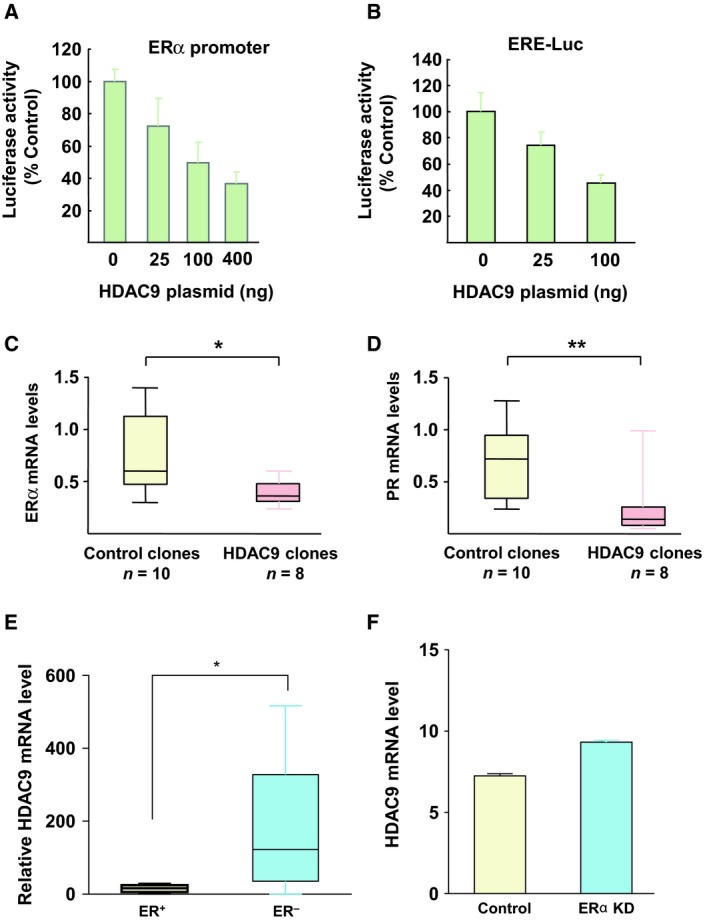
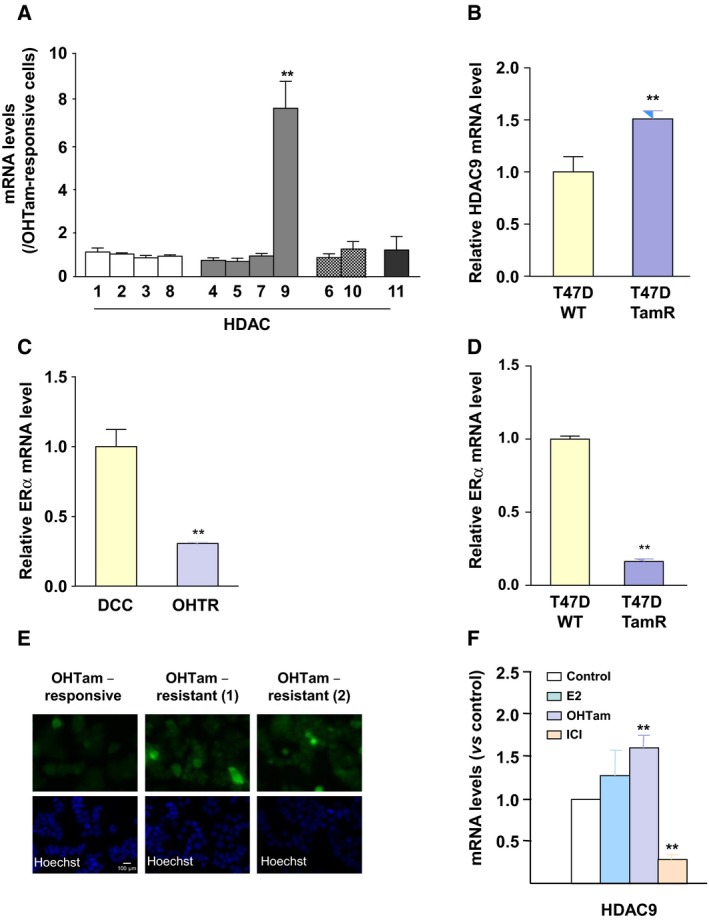
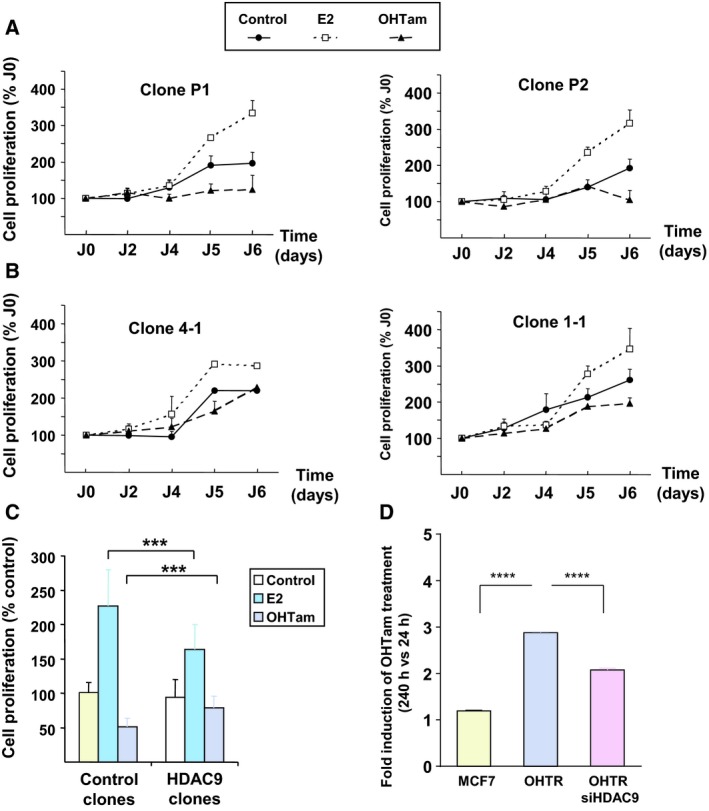
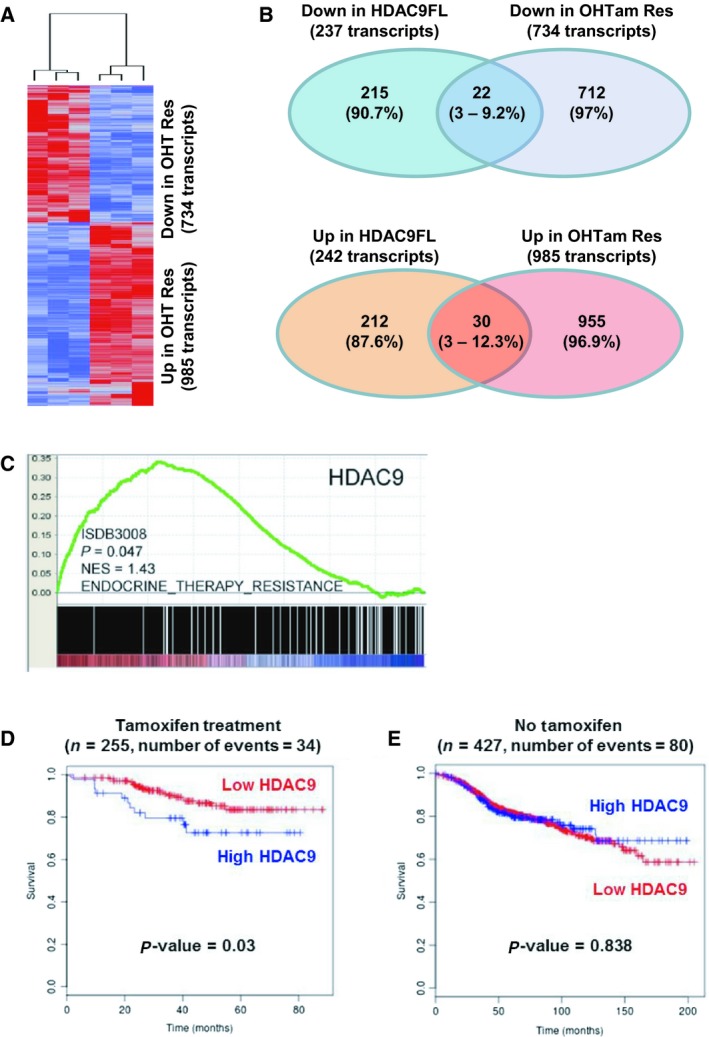
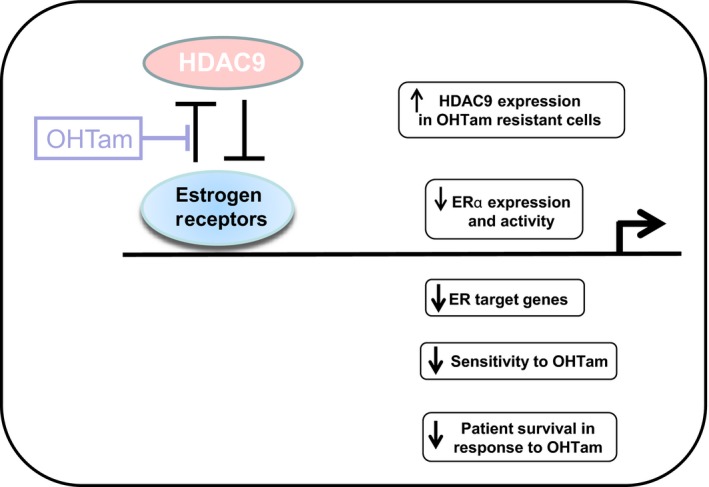
Estrogens play a pivotal role in breast cancer etiology, and endocrine therapy remains the main first line treatment for estrogen receptor-alpha (ERα)-positive breast cancer. ER are transcription factors whose activity is finely regulated by various regulatory complexes, including histone deacetylases (HDACs). Here, we investigated the role of HDAC9 in ERα signaling and response to antiestrogens in breast cancer cells. Various Michigan Cancer Foundation-7 (MCF7) breast cancer cell lines that overexpress class IIa HDAC9 or that are resistant to the partial antiestrogen 4-hydroxy-tamoxifen (OHTam) were used to study phenotypic changes in response to ER ligands by using transcriptomic and gene set enrichment analyses. Kaplan-Meier survival analyses were performed using public transcriptomic datasets from human breast cancer biopsies. In MCF7 breast cancer cells, HDAC9 decreased ERα mRNA and protein expression and inhibited its transcriptional activity. Conversely, HDAC9 mRNA was strongly overexpressed in OHTam-resistant MCF7 cells and in ERα-negative breast tumor cell lines. Moreover, HDAC9-overexpressing cells were less sensitive to OHTam antiproliferative effects compared with parental MCF7 cells. Several genes (including MUC1, SMC3 and S100P) were similarly deregulated in OHTam-resistant and in HDAC9-overexpressing MCF7 cells. Finally, HDAC9 expression was positively associated with genes upregulated in endocrine therapy-resistant breast cancers and high HDAC9 levels were associated with worse prognosis in patients treated with OHTam. These results demonstrate the complex interactions of class IIa HDAC9 with ERα signaling in breast cancer cells and its effect on the response to hormone therapy.

Keywords: antiestrogen resistance; breast cancer; cell proliferation; estrogen receptor; histone deacetylase.


Conflict of interest statement

The authors declare no conflict of interest.

Figures

Figure 1
Figure 1
Cross talk between HDAC9 and ERα signaling in breast cancer cells. (A) MCF7 cells were cotransfected with a 4‐kb fragment of the ERα promoter and increasing concentrations of full length HDAC9. Results represent the luciferase activity measured after normalization to Renilla luciferase activity and relative to the values obtained in cells not transfected with the HDAC9 plasmid (control). Data are the mean ± SD of triplicate wells and are representative of two independent experiments. (B) The same as in panel A, but with cells cotransfected with an ERE‐luciferase reporter plasmid and increasing concentrations of full length HDAC9. (C) Total RNA was extracted from control (empty vector; n = 10) and HDAC9‐overexpressing cell clones (n = 8). ERα mRNA levels were quantified using RTqPCR. Results represent the mean FC ± SD vs control MCF7 cells; *P < 0.05, **P < 0.01 (Mann–Whitney test). (D) The same as in panel C, but for PGR mRNA. (E) Total RNA was extracted from ERα‐positive or ERα‐negative breast cancer cell lines and ERα mRNA levels were quantified using RTqPCR; *P < 0.05. (F) HDAC9 expression levels in parental and MCF7 cells with silenced ERα expression (205659_at probe set) were extracted from the GEO profile GSE27473 and compared (Al Saleh et al., 2011).
Figure 2
Figure 2
HDAC9 expression in antiestrogen‐resistant breast cancer cells. (A) Total RNA was extracted from OHTam‐sensitive and OHTam‐resistant MCF7 cell lines and HDAC mRNA levels were quantified by RTqPCR. Results represent the mean ± SD of three independent cell cultures and are expressed relative to the HDAC mRNA levels of OHTam‐responsive cells, used as reference; **P < 0.01 (Mann–Whitney test compared with OHTam‐responsive cells). (B) HDAC9 mRNA levels were quantified by RTqPCR in T47D TamR cells (Mishra et al., 2018). Results are expressed relative to the HDAC mRNA levels in parental cells and represent the mean ± SD of five independent cell cultures; **P < 0.001 (t‐test compared with parental T47D cells). (C) Total RNA was extracted from OHTam‐responsive (DCC) and resistant (OHTR) MCF7 cells and ERα mRNA levels were quantified by RTqPCR. Results represent the mean ± SD of three independent cell cultures and are expressed relative to the ERα mRNA levels in DCC cells, used as reference; **P < 0.01 (Mann–Whitney test compared with DCC cells). (D) The same as in panel B for the quantification of ERα mRNA levels by RTqPCR in T47D TamR cells. (E) HDAC9 expression was analyzed by immunofluorescence in OHTam‐responsive MCF7 cells and in two sets of OHTam‐resistant MCF7 cells (1 and 2) using an anti‐HDAC9 antibody (top panel); nuclei were stained with Hoechst (bottom panel). Scale bar corresponds to 100 μm. (F) MCF7 cells were incubated with 10−8 M E2, OHTam, ICI or solvent alone (EtOH; Control) for 20 h and then HDAC9 mRNA levels were quantified by RTqPCR. Results are expressed relative to the HDAC mRNA levels in control cells and represent the mean ± SD of three independent cell cultures; **P < 0.01 (Mann‐Whitney test compared with control cells).
Figure 3
Figure 3
HDAC9 and the regulation of breast cancer cell proliferation by ER ligands. (A) Control MCF7 cell clones (empty vector; P1 and P2) were cultured in DCC medium supplemented with E2, OHTam or solvent alone (Control) for 5 days. Cell proliferation was measured with the MTT assay at days 2, 4, 5 and 6 and expressed relative to the absorbance at day 0. Results are the mean ± SD of three independent experiments, performed in triplicates. (B) The same as in A, but with MCF7‐HDAC9 cell clones (4‐1 and 1‐1). (C) Data obtained for each condition (control and MCFTHDAC9 cell clones) were pooled and compared. Data represent the mean ± SD of three independent experiments for each clone; ***P < 0.001 (Mann–Whitney test). (D) The growth of MCF7 and MCF7‐OHTR cells (transfected or not with a siRNA directed against HDAC9) was monitored using the XCELLigence system for a total duration of 10 days. The cell index corresponding to the number of viable cells was determined. The results represent, for each condition, cell proliferation measured after 240 h of culture in the presence of OHTam normalized by the values measured at 24 h (means ± SD; two independent experiments). ****P < 0.0001 (Mann‐Whitney test).
Figure 4
Figure 4
Transcriptomic analyses in MCF7 cells and expression in human breast cancer tumors. (A) The molecular signatures of OHTam‐sensitive and OHTam‐resistant MCF7 cells were visualized by hierarchical clustering of the 1719 genes that are differentially expressed in the two conditions (genes are arranged in rows and samples in columns). For each condition, a tree represents the relationship among samples and the branch lengths reflect the degree of similarity between samples according to the gene expression profile. In red, upregulated genes; in blue, downregulated genes. (B) Schematic representation showing the overlap between downregulated (top drawing) and upregulated (bottom drawing) transcripts in MCF7‐HDAC9FL and OHTam‐resistant MCF7 cells. The number (percentage) of transcripts deregulated in each condition is indicated. (C) GSEA of HDAC9 mRNA expression relative to the endocrine therapy resistance gene set in breast cancer (n = 2795 samples). (D) Kaplan–Meier analysis with the BreastMark algorithm of survival in patients with breast cancer treated with tamoxifen (n = 255 tumor samples) relative to HDAC9 expression using a low cutoff analysis (lower quartile). Disease‐free survival was considered as the survival end point and if not available, distant disease‐free survival or overall survival was used. Significance was calculated using the log rank test. (E) The same as in panel D, but for untreated patients (n = 427 tumor samples).
Figure 5
Figure 5
Effect of HDAC9 on estrogen signaling and tamoxifen response in breast cancer cells. Schematic model of the putative role of HDAC9 in estrogen signaling in human breast cancer cells. HDAC9 expression is inversely correlated with ERα expression in breast cancer and is upregulated in OHTam‐resistant breast cancer cells. HDAC9 decreases ERα expression and activity, ER target gene expression, OHTam cytotoxicity and survival of patients treated with tamoxifen.

References

    1. Al Saleh S, Al Mulla F and Luqmani YA (2011) Estrogen receptor silencing induces epithelial to mesenchymal transition in human breast cancer cells. PLoS ONE 6, e20610. - PMC - PubMed
    1. Annicotte JS, Iankova I, Miard S, Fritz V, Sarruf D, Abella A, Berthe ML, Noël D, Pillon A, Iborra F et al (2006) Peroxisome proliferator‐activated receptor gamma regulates E‐cadherin expression and inhibits growth and invasion of prostate cancer. Mol Cell Biol 26, 7561–7574. - PMC - PubMed
    1. Archer KJ, Mas VR, Maluf DG and Fisher RA (2010) High‐throughput assessment of CpG site methylation for distinguishing between HCV‐cirrhosis and HCV‐associated hepatocellular carcinoma. Mol Genet Genomics 283, 341–349. - PMC - PubMed
    1. Augereau P, Badia E, Fuentes M, Rabenoelina F, Corniou M, Derocq D, Balaguer P and Cavailles V (2006) Transcriptional regulation of the human NRIP1/RIP140 gene by estrogen is modulated by dioxin signalling. Mol Pharmacol 69, 1338–1346. - PubMed
    1. Badia E, Duchesne MJ, Semlali A, Fuentes M, Giamarchi C, Richard‐Foy H, Nicolas JC and Pons M (2000) Long‐term hydroxytamoxifen treatment of an MCF‐7‐derived breast cancer cell line irreversibly inhibits the expression of estrogenic genes through chromatin remodeling. Cancer Res 60, 4130–4138. - PubMed

Publication types

MeSH terms