

Trends in Suicide Among Youth Aged 10 to 19 Years in the United States, 1975 to 2016
- PMID: 31099867
- PMCID: PMC6537827
- DOI: 10.1001/jamanetworkopen.2019.3886
Trends in Suicide Among Youth Aged 10 to 19 Years in the United States, 1975 to 2016
Erratum in
-
Error in Supplement.JAMA Netw Open. 2019 Jun 5;2(6):e197687. doi: 10.1001/jamanetworkopen.2019.7687. JAMA Netw Open. 2019. PMID: 31225885 Free PMC article. No abstract available.
Abstract
Importance: Suicide is a leading cause of death among youth aged 10 to 19 years in the United States, with rates traditionally higher in male than in female youth. Recent national mortality data suggest this gap may be narrowing, which warrants investigation.
Objective: To investigate trends in suicide rates among US youth aged 10 to 19 years by age group, sex, race/ethnicity, and method of suicide.
Design, setting, and participants: Cross-sectional study using period trend analysis of US suicide decedents aged 10 to 19 years from January 1, 1975, to December 31, 2016. Data were analyzed for periods defined by statistically significant changes in suicide rate trends. Suicide rates were calculated using population estimates.
Main outcomes and measures: Period trends in suicide rates by sex and age group were assessed using joinpoint regression. Incidence rate ratios (IRRs) were estimated using negative binomial regression comparing male and female suicide rates within periods.
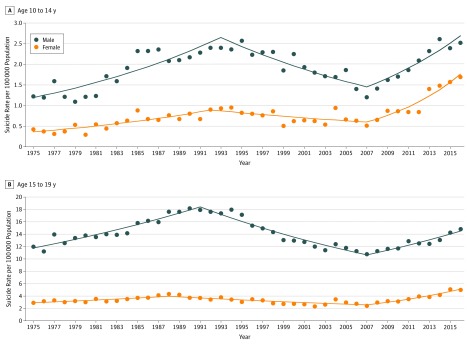
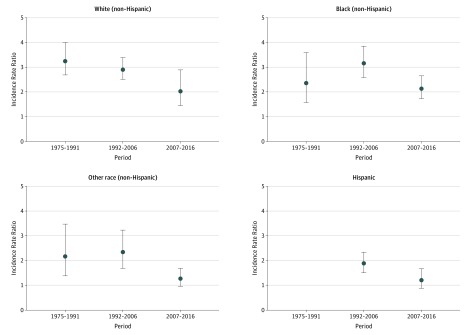
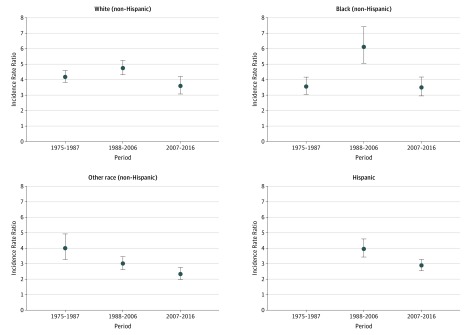
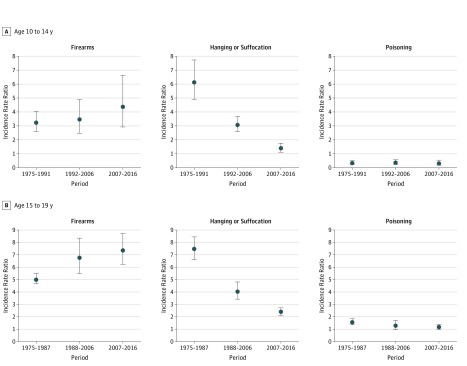
Results: From 1975 to 2016, we identified 85 051 youth suicide deaths in the United States (68 085 male [80.1%] and 16 966 female [19.9%]) with a male to female IRR of 3.82 (95% CI, 3.35-4.35). Following a downward trend until 2007, suicide rates for female youth showed the largest significant percentage increase compared with male youth (12.7% vs 7.1% for individuals aged 10-14 years; 7.9% vs 3.5% for individuals aged 15-19 years). The male to female IRR decreased significantly across the study period for youth aged 10 to 14 years (3.14 [95% CI, 2.74-3.61] to 1.80 [95% CI, 1.53-2.12]) and 15 to 19 years (4.15 [95% CI, 3.79-4.54] to 3.31 [95% CI, 2.96-3.69]). Significant declining trends in the male to female IRR were found in non-Hispanic white youth aged 10 to 14 years (3.27 [95% CI, 2.68-4.00] to 2.04 [95% CI, 1.45-2.89]) and non-Hispanic youth of other races aged 15 to 19 years (4.02 [95% CI, 3.29-4.92] to 2.35 [95% CI, 2.00-2.76]). The male to female IRR for firearms increased significantly for youth aged 15 to 19 years (χ2 = 7.74; P = .02 for sex × period interaction). The male to female IRR of suicide by hanging or suffocation decreased significantly for both age groups (10-14 years: χ2 = 88.83; P < .001 for sex × period interaction and 15-19 years: χ2 = 82.15; P < .001 for sex × period interaction). No significant change was found in the male to female IRR of suicide by poisoning across the study period.
Conclusions and relevance: A significant reduction in the historically large gap in youth suicide rates between male and female individuals underscores the importance of interventions that consider unique differences by sex. Future research examining sex-specific factors associated with youth suicide is warranted.
Conflict of interest statement
Figures
Comment in
-
Increasing Suicide Rates in Early Adolescent Girls in the United States and the Equalization of Sex Disparity in Suicide: The Need to Investigate the Role of Social Media.JAMA Netw Open. 2019 May 3;2(5):e193916. doi: 10.1001/jamanetworkopen.2019.3916. JAMA Netw Open. 2019. PMID: 31099856 No abstract available.
References
-
- Centers for Disease Control and Prevention WISQARS leading causes of death reports, national and regional, 1999-2015. http://webappa.cdc.gov/sasweb/ncipc/leadcaus10_us.html. Accessed November 3, 2018.
-
- Centers for Disease Control and Prevention WISQARS fatal injury reports, 1999-2016, for national, regional, and states. https://www.cdc.gov/injury/wisqars/index.html. Accessed November 24, 2018.
-
- Lubell KM, Kegler SR, Crosby AE, Karch D; Centers for Disease Control and Prevention . Suicide trends among youths and young adults aged 10-24 years—United States, 1990-2004. MMWR Morb Mortal Wkly Rep. 2007;56(35):-. - PubMed
Publication types
MeSH terms
Grants and funding
LinkOut - more resources
Full Text Sources
Other Literature Sources
Medical
Miscellaneous
