. 2019 May 17;15(5):e1007947.
doi: 10.1371/journal.pgen.1007947. eCollection 2019 May.

TDP-43 induces mitochondrial damage and activates the mitochondrial unfolded protein response

Affiliations

TDP-43 induces mitochondrial damage and activates the mitochondrial unfolded protein response

Peng Wang et al. PLoS Genet. .

Abstract

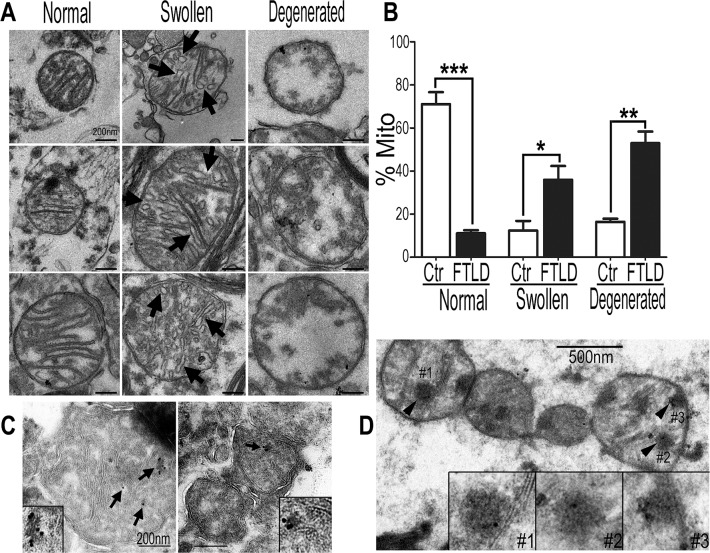
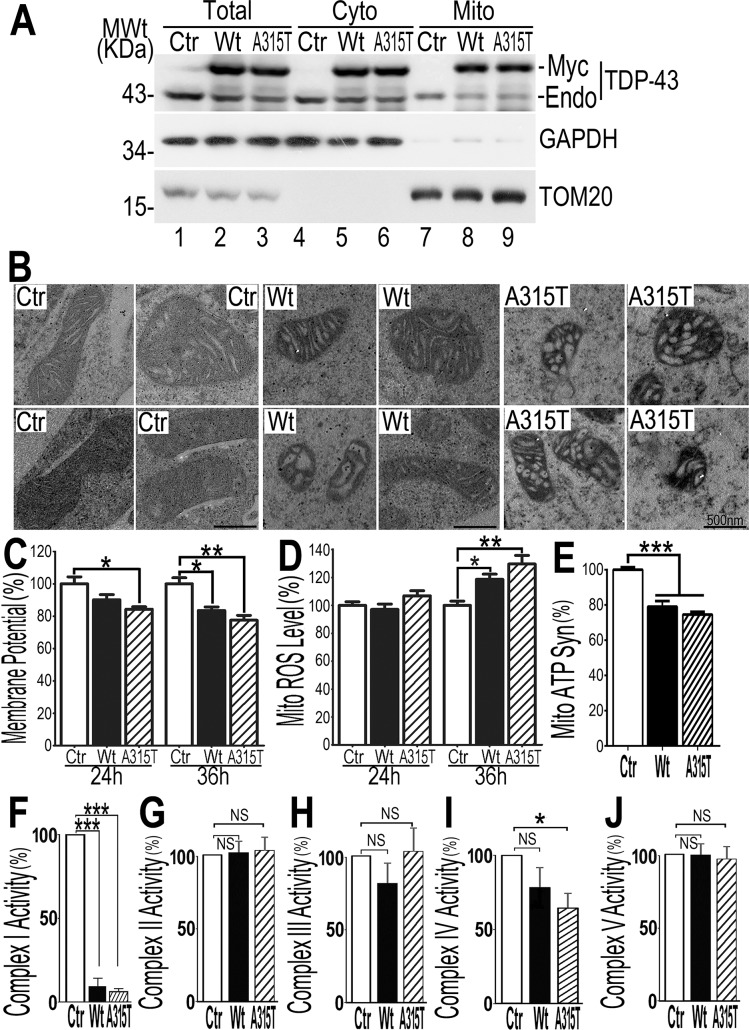
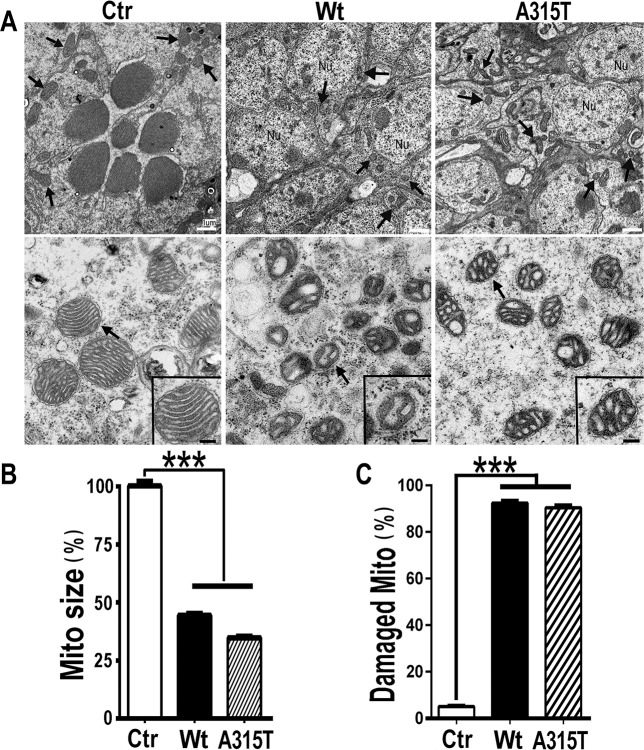
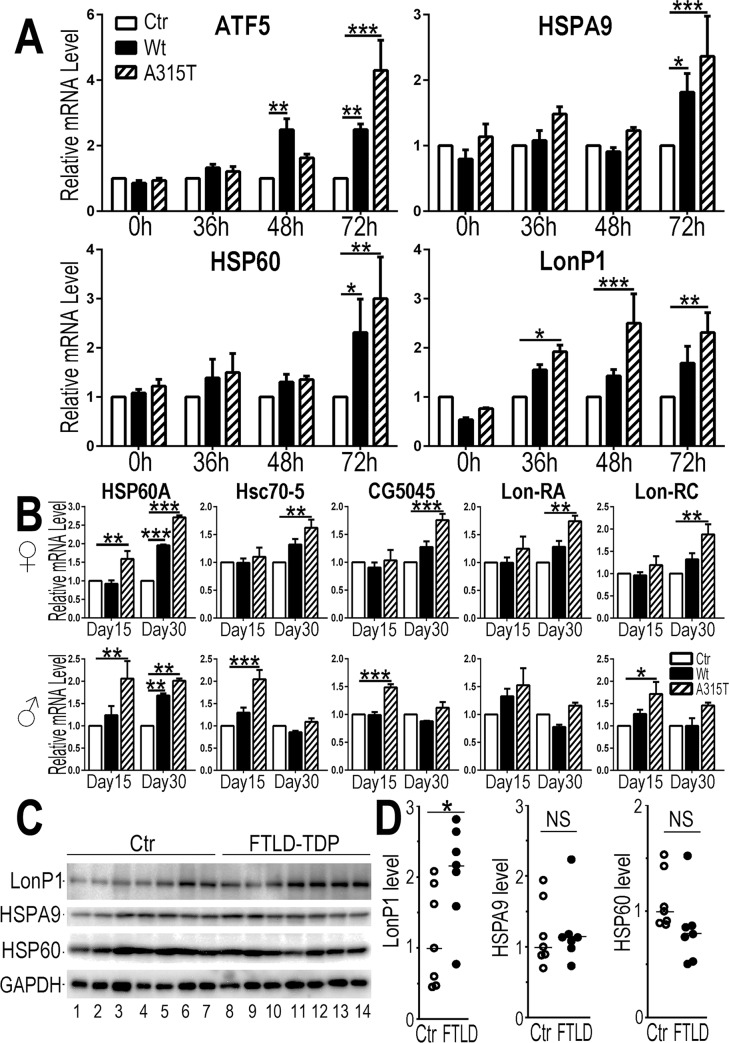
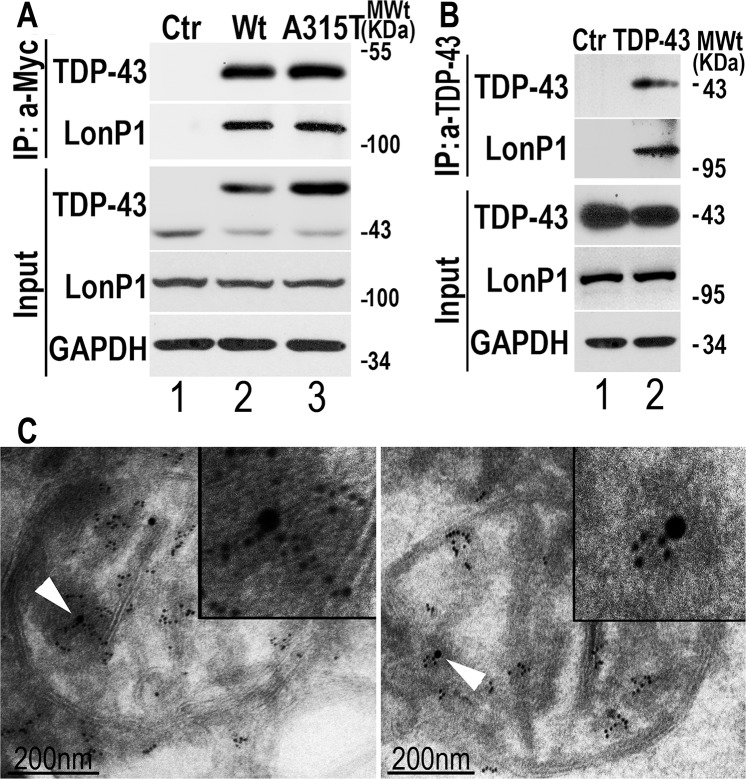
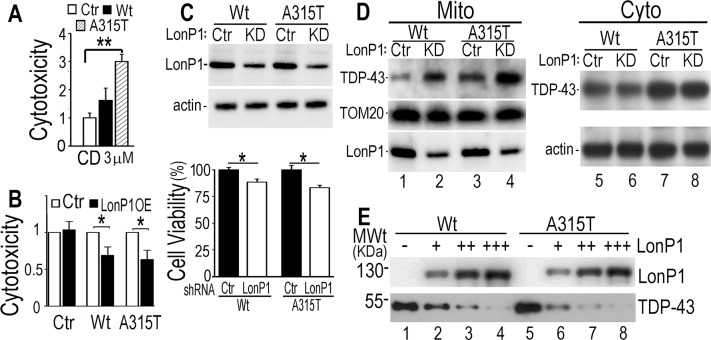
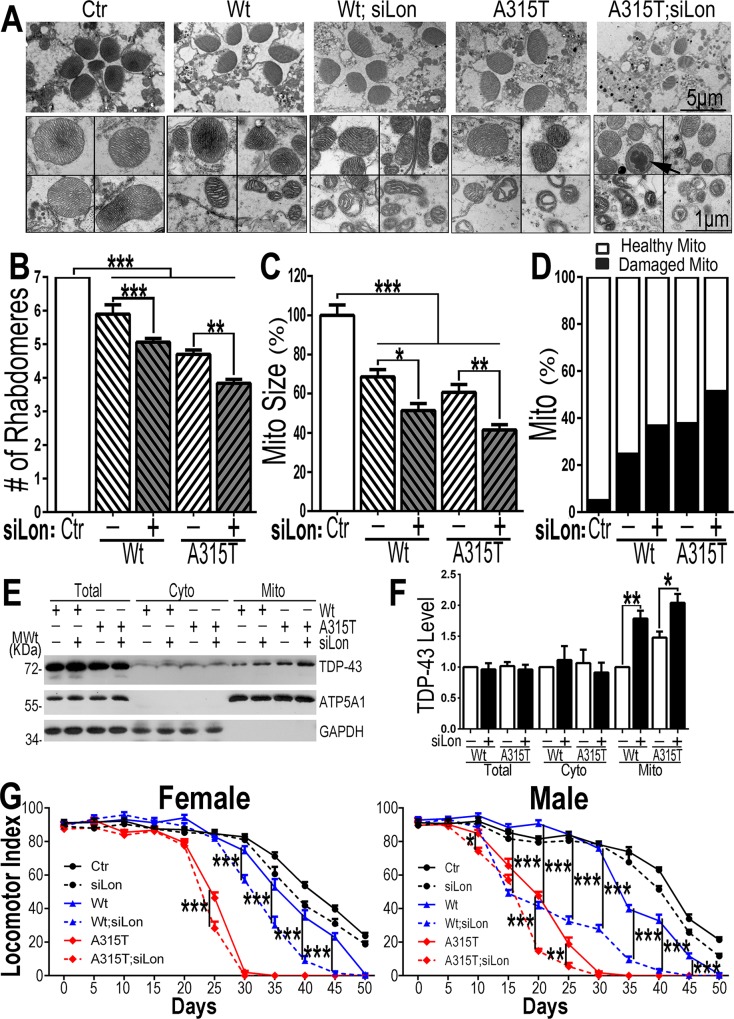
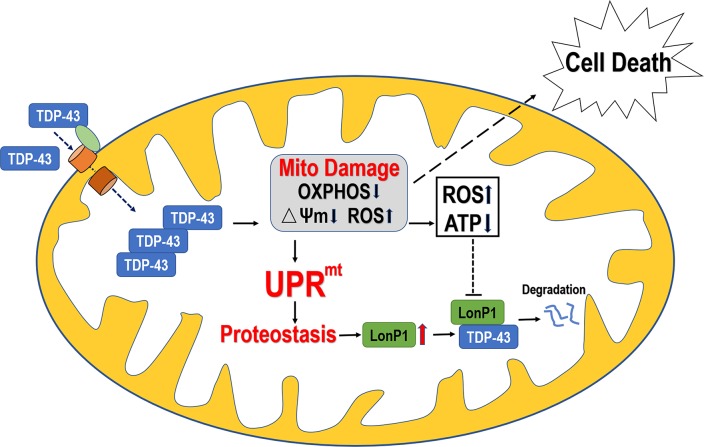
Mutations in or dys-regulation of the TDP-43 gene have been associated with TDP-43 proteinopathy, a spectrum of neurodegenerative diseases including Frontotemporal Lobar Degeneration (FTLD) and Amyotrophic Lateral Sclerosis (ALS). The underlying molecular and cellular defects, however, remain unclear. Here, we report a systematic study combining analyses of patient brain samples with cellular and animal models for TDP-43 proteinopathy. Electron microscopy (EM) analyses of patient samples revealed prominent mitochondrial impairment, including abnormal cristae and a loss of cristae; these ultrastructural changes were consistently observed in both cellular and animal models of TDP-43 proteinopathy. In these models, increased TDP-43 expression induced mitochondrial dysfunction, including decreased mitochondrial membrane potential and elevated production of reactive oxygen species (ROS). TDP-43 expression suppressed mitochondrial complex I activity and reduced mitochondrial ATP synthesis. Importantly, TDP-43 activated the mitochondrial unfolded protein response (UPRmt) in both cellular and animal models. Down-regulating mitochondrial protease LonP1 increased mitochondrial TDP-43 levels and exacerbated TDP-43-induced mitochondrial damage as well as neurodegeneration. Together, our results demonstrate that TDP-43 induced mitochondrial impairment is a critical aspect in TDP-43 proteinopathy. Our work has not only uncovered a previously unknown role of LonP1 in regulating mitochondrial TDP-43 levels, but also advanced our understanding of the pathogenic mechanisms for TDP-43 proteinopathy. Our study suggests that blocking or reversing mitochondrial damage may provide a potential therapeutic approach to these devastating diseases.


Conflict of interest statement

Authors declare that there is no competing interest.

Figures

Fig 1
Fig 1. Mitochondrial changes in brain samples of TDP-43 proteinopathy patients.
(A) EM images showing mitochondrial changes. The majority of mitochondria in the control brain samples have organized tubular cristae (left panels), whereas damaged mitochondria showing vesicular or swollen cristae (middle panels; arrows) or a marked loss of cristae (“degenerated” type; in the right panels) were frequently detected in the brain tissues of FTLD-TDP patients. Scale bars: 200nm (B) Quantification of the mitochondrial damage in the control and FTLD-TDP brain samples (all samples were from temporal cortices, except one from hippocampus and one from dentate gyrus; for details, see S1 Table). More than 100 mitochondria were analyzed from each sample, including 3 controls (Ctr: 123, 147, 118 mitochondria) and 5 FTLD-TDP brain samples (FTLD: 112, 236, 115, 240, 184 mitochondria). (C) Immuno-electron microscopy (IEM) using the specific anti-TDP-43 antibody of brain tissues, from either a control subject (left panel) or an FTLD-TDP patient (right panel), revealed endogenous TDP-43 inside mitochondria. (D) Electron-dense TDP-43 positive protein aggregates were detected inside ~1% of mitochondria from FTLD-TDP patients' samples, but not in any control samples. Data were analyzed using a Student’s t-test (*: P<0.05; **: P<0.01; ***: P<0.001).
Fig 2
Fig 2. TDP-43 is localized to mitochondria, induces mitochondrial damage and suppresses mitochondrial complex I and reduces mitochondrial ATP synthesis.
(A) TDP-43 is detected in purified mitochondria. Highly purified mitochondria were prepared from HEK293 cells expressing either the control vector, or Wt, or A315T-mutant TDP-43 protein following tetracycline (Tet; 24 hr) induction. The purity of the mitochondrial preparation was confirmed by the detection of mitochondrial TOM20 and the absence of the cytoplasmic GAPDH protein. (B) TEM micrographs showed mitochondrial abnormalities (decreased size and abnormal cristae) in HEK293 cells expressing the Wt or A315T-mutant TDP-43 protein 24 hr post-induction, as compared with control cells (Ctr). It should be noted that there was no detectable cell death at this time point. Scale bars: 200 nm. (C, D) Quantification of mitochondrial membrane potential and ROS levels in cells expressing Wt- or A315T-mutant TDP-43 as compared with control cells, 24 or 36 hr post-induction. Cells were stained using JC1 (C) or mitoSOX-red (D) respectively and analyzed using flow cytometry. (E) Mitochondrial ATP synthesis was decreased in cells expressing either Wt or A315T-mutant TDP-43 protein. Mitochondrial ATP synthesis was measured in the mitochondria purified from cells expressing Wt or A315T-mutant TDP-43 as compared with control cells (Ctr) 36 hr post-induction. (F-J) Changes in activities of mitochondrial complexes I-IV 24 hr post-induction. (F) Expression of either Wt or A315T-mutant TDP-43 significantly reduced mitochondrial complex I activity. (G, H) Expression of either Wt or A315T-mutant TDP-43 did not affect mitochondrial complex II or III activity. (I) Expression of A315T-mutant TDP-43 reduced mitochondrial complex IV activity. (J) Expression of either Wt or A315T-mutant TDP-43 did not affect mitochondrial complex V activity. Data in all panels represent 3 independent experiments [one-way ANOVA with Bonferroni post hoc test (ns: P>0.05; *: P<0.05; **: P<0.01; ***: P<0.001)].
Fig 3
Fig 3. Expression of the Wt or A315T-mutant TDP-43 induces cell death in inducible stable cells.
(A) FACS analyses of cells following staining using an Annexin V-FITC/PI kit to quantify cell death in HEK293 cells following induction of TDP-43 expression. (B) Quantification of the percentage of different cell populations at different time points. At 36 hr post-Tet induction, the expression of either Wt or A315T-mutant TDP-43 protein induced apoptosis (Annexin V positive and PI negative) but not necroptosis (Annexin V negative and PI positive) or late apoptosis (Annexin V positive and PI positive). The data were analyzed using a one-way ANOVA with Bonferroni post hoc test (representing 4 independent experiments; *: P<0.05; **: P<0.01; ***: P<0.001).
Fig 4
Fig 4. Mitochondrial defects in transgenic flies expressing TDP-43.
(A) TEM micrographs show intact ommatidial structures with 7-rhabdomere trapezoids in control fly eyes (3-day-old female adult fly), whereas the rhabdomere structures are severely damaged or completely lost in the retinae of flies expressing either Wt or A315T-mutant TDP-43 protein. Sections 10–40 μm beneath the cornea were used to show cross-sections of the photoreceptors as described previously [88]. Mitochondria are marked by arrows. Scale bars: 1um. In the lower panels are higher-magnification TEM images, showing that mitochondria in fly retinae expressing either Wt, or A315T-mutant TDP-43 are smaller in size and have abnormal cristae as compared with those in the control flies. Higher-magnification images of representative mitochondria (arrows) were shown in the insets of the corresponding panels. Scale bars: 200nm. (B) Quantification of mitochondrial sizes in the corresponding groups. Data from 3 independent experiments were analyzed using a one-way ANOVA with Bonferroni post hoc test (***: P<0.001). (C) Quantification of damaged mitochondria in different groups with percentage of mitochondria showing abnormal cristae. Two independent fly retinae were examined by TEM in each group: control flies (Ctr), or flies expressing either Wt or A315T-mutant TDP-43 in their photoreceptors. More than 200 mitochondria in each group (227 in Ctr, 274 in Wt, and 270 in A315T groups) were examined. Data from 3 independent experiments were analyzed using a one-way ANOVA with Bonferroni post hoc test (***: P<0.001). Fly genotypes: Ctr: GMR-Gal4/UAS-RFP; Wt: GMR-Gal4/UAS-Wt-TDP-43-RFP; A315T: GMR-Gal4/UAS-A315T-TDP-43-RFP.
Fig 5
Fig 5. Increased expression of UPRmt genes in HEK293 cells and flies expressing TDP-43, and elevated LonP1 protein in FTLD-TDP brains.
(A) Expression levels of UPRmt related genes, including ATF5, HSPA9 (mtHSP70), HSP60 and LonP1, as detected by qPCR in TDP-43 inducible stable cells at different time points following induction of TDP-43 expression: 0, 36, 48 and 72-hr time points. HPRT1 was used as an internal control. (B) Expression levels of UPRmt related Drosophila genes in female and male flies, including HSP60, Hsc70-5 (mtHSP70), CG5045 (ClpP homolog) and Lon (Lon-RA and Lon-RC isoforms), as detected by qPCR in Elav-Gal4/Tub-Gal80ts driven TDP-43 transgenic flies at day 15 and day 30 post-induction of TDP-43 expression. Actin 5C was used as an internal control. Fly genotypes: Ctr: Elav-Gal4/Tub-Gal80ts /UAS-RFP; Wt: Elav-Gal4/Tub-Gal80ts/UAS-Wt-TDP-43-RFP; A315T: Elav-Gal4/Tub-Gal80ts /UAS-A315T-TDP-43-RFP. Data from 3 independent experiments (panels A and B) were analyzed using a two-way ANOVA with Bonferroni post hoc test (*:P<0.05; **:P<0.01; ***: P<0.001). (C-D) Western blotting analyses using brains from control or FTLD-TDP patients show that LonP1 protein levels were higher in brain samples from patients affected by FTLD-TDP as compared with the control subjects. The levels of HSPA9 and HSP60 proteins were not changed in the patient brains. These brain samples have been reported previously [40]. Data were analyzed using StatPlus with a Student’s t-test (*:P<0.05; NS: not significant).
Fig 6
Fig 6. TDP-43 interacts with LonP1.
(A, B) Interaction of TDP-43 with LonP1 as detected by co-immunoprecipitation (coIP) assay. (A) Immunoprecipitation experiment was performed using a monoclonal anti-Myc antibody with cell lysates from HEK293 stable inducible cells expressing vector control (Ctr) or Myc-tagged Wt or A315T-mutant TDP-43 (36 hr following Tet-induction). Western blotting experiments were carried out using specific anti-LonP1 or TDP-43 or Myc antibodies as indicated in cell lysates or immunoprecipitated proteins. (B) The endogenous TDP-43 protein interacts with LonP1. Immunoprecipitation experiment was performed with HEK293 cell lysates using the specific anti-TDP-43 antibody or non-specific IgG as a control (Ctr). LonP1 was detected by WB in immunoprecipitated proteins by anti-TDP-43, but not in that by the IgG control. Data in panels A and B represent three independent experiments. (C) IEM analyses reveal co-localization of TDP-43 and LonP1 immunostaining signals inside mitochondria. IEM was carried out to examine mitochondria in brain tissue of FTLD-TDP patients using murine anti-TDP-43 and rabbit anti-LonP1 followed by anti-murine- 6nm gold particles and anti-rabbit-15nm gold particles.
Fig 7
Fig 7. LonP1 degrades TDP-43 in cultured cells and in vitro.
Treatment by the LonP1 inhibitor enhances TDP-43 induced cytotoxicity. (A, B) CD treatment enhanced, whereas LonP1 overexpression suppressed, TDP-43 induced cytotoxicity. Data in panels A and B represent 4 independent experiments (*: P<0.05, **: P<0.01; Student’s t-test). (C, D) Down-regulating LonP1 increases TDP-43 induced cytotoxicity. Control or shRNA specifically targeting LonP1 was transduced into inducible TDP-43 stable cells expressing either Wt or A315T-mutant TDP-43. Cell viability was measured 48 hr following induction of TDP-43. Down-regulating LonP1 significantly reduced viability of cells expressing either Wt or A315T-mutant TDP-43. Fractionation experiments revealed that mitochondrial TDP-43 levels were increased in cells in which LonP1 level was down-regulated (D). (E) TDP-43 protein was degraded by the purified recombinant LonP1 protein in an in vitro degradation assay. Wt or A315T-mutant TDP-43 protein was purified from the inducible HEK293 cells and incubated with increasing concentrations (0.5, 1.5 and 2.5 uM) of purified recombinant LonP1 (see Methods). The reaction products were analyzed by Western blotting using specific antibodies against TDP-43 and LonP1. Data in panels C-E represent three independent experiments.
Fig 8
Fig 8. Down-regulation of Lon exacerbated retinal degeneration, mitochondrial damage and locomotor deficits in adult flies expressing TDP-43 protein.
(A). TEM revealed that down-regulation of Lon exacerbated retinal degeneration and mitochondrial damage induced by expression of Wt or A315T-mutant TDP-43 (Day 20 post-induction). Top panels reveal the morphology of rhabdomeres in each fly group, whereas the higher magnification EM images in the lower panels show mitochondrial morphology in the corresponding groups (6 flies in each group were used). Mitochondrial damage, including cristae swelling and fragmentation, was more severe when Lon was down-regulated. The arrow points to an electron-dense aggregate (see S10 Fig for more examples). (B) Quantification of the number of rhabdomeres in each group of flies as indicated in (A). More than 70 ommatidia from 6 flies in each group (ommatidial number in each group, Ctr: 81; Wt: 76; Wt+siLon: 99; A315T: 79; A315T+siLon: 74 respectively) were quantified for each group. (C,D) Quantitative analyses indicate that the expression of Wt or A315T-mutant TDP-43 led to a significant reduction in mitochondrial size (C), and that down-regulation of Lon increased the percentage of damaged mitochondria (D). In flies expressing Wt TDP-43, ~24.6% mitochondria showed obvious fragmentation or swollen cristae, whereas the percentage of damaged mitochondria was increased to 36.6% when Lon was knocked-down in these flies. On the other hand, down-regulating Lon in flies expressing the A315T-mutant TDP-43 expressing flies increased the percentage of damaged mitochondria from 37.7% to 51.2%. In panel C, more than 100 mitochondria (Ctr: 125; Wt: 123; Wt+siLon: 117; A315T: 138; A315T+siLon: 124 respectively) from 6 flies in each group were quantified. In panel D, more than 400 mitochondria (Ctr: 431; Wt: 414; Wt+siLon: 445; A315T: 494; A315T+siLon: 511 respectively) were quantified for each group. (E, F) Biochemical fractionation experiments revealed an increase in the mitochondrial TDP-43 levels. Mitochondria were purified from the eyes of the corresponding groups of flies and analyzed using WB with specific antibodies together with the total cell lysates (Total) and cytoplasmic fractions (Cyto). (F) Quantification of mitochondrial TDP-43 levels indicates that down-regulating Lon led to an accumulation of TDP-43 in mitochondria in flies expressing either Wt or A315T-mutant TDP-43. Data represent three independent experiments. (G) The locomotor index was measured in adult flies at different time points following induction of expression of Wt or A315T-mutant TDP-43 under the Elav-Gal4/Tub-Gal80ts driver. Expression of TDP-43 in these flies led to progressive locomotor deficits, with A315T-mutant TDP-43 expressing flies showing a more severe phenotype. Down-regulation of Lon led to an earlier onset and more severe locomotor deficits in flies expressing TDP-43. The exacerbating effect of down-regulating Lon seemed to be more pronounced in male flies. More than 100 flies were analyzed in each group (precise fly numbers of each group in Supplementary Information). Data represent two independent experiments. Data in panels B, C, F and G were analyzed using a one-way ANOVA with Bonferroni post hoc test (*:P<0.05; **: P <0.01; ***: P<0.001). Fly genotypes for panels A-D: Ctr: GMR-Gal4/Tub-Gal80ts /UAS-RFP; Wt: GMR-Gal4/Tub-Gal80ts /UAS-Wt-TDP43; Wt; siLon: GMR-Gal4/Tub-Gal80ts /UAS-Wt-TDP-43/UAS-siLon; A315T: GMR-Gal4/Tub-Gal80ts /UAS-A315T-TDP-43; A315T;siLon: GMR-Gal4/Tub-Gal80ts /UAS-A315T-TDP-43/UAS-siLon. Fly genotypes for panels E-F:Wt: GMR-Gal4/UAS-Wt-TDP43; Wt;siLon: GMR-Gal4/UAS-Wt-TDP-43/UAS-siLon; A315T: GMR-Gal4/UAS-A315T-TDP-43; A315T;siLon: GMR-Gal4/UAS-A315T-TDP-43/UAS-siLon. Fly genotypes for panel G: Ctr: Elav-Gal4/Tub-Gal80ts /UAS-RFP; siLon: Elav-Gal4/Tub-Gal80ts /UAS-RFP/UAS-siLon; Wt: Elav-Gal4/Tub-Gal80ts /UAS-Wt-TDP-43; Wt; siLon: Elav-Gal4/Tub-Gal80ts /UAS-Wt-TDP-43/UAS-siLon; A315T: Elav-Gal4/Tub-Gal80ts /UAS-A315T-TDP-43; A315T; siLon: Elav-Gal4/Tub-Gal80ts /UAS-A315T-TDP-43/UAS-siLon.
Fig 9
Fig 9. A working model to illustrate that accumulation of mitochondrial TDP-43 leads to mitochondrial damage and triggers UPRmito.

References

    1. Neumann M, Sampathu DM, Kwong LK, Truax AC, Micsenyi MC, et al. (2006) Ubiquitinated TDP-43 in frontotemporal lobar degeneration and amyotrophic lateral sclerosis. Science 314: 130–133. 10.1126/science.1134108 - DOI - PubMed
    1. Scotter EL, Vance C, Nishimura AL, Lee YB, Chen HJ, et al. (2014) Differential roles of the ubiquitin proteasome system and autophagy in the clearance of soluble and aggregated TDP-43 species. J Cell Sci 127: 1263–1278. 10.1242/jcs.140087 - DOI - PMC - PubMed
    1. Lee EB, Lee VM, Trojanowski JQ (2011) Gains or losses: molecular mechanisms of TDP43-mediated neurodegeneration. Nat Rev Neurosci 13: 38–50. 10.1038/nrn3121 - DOI - PMC - PubMed
    1. Gao FB, Almeida S, Lopez-Gonzalez R (2017) Dysregulated molecular pathways in amyotrophic lateral sclerosis-frontotemporal dementia spectrum disorder. EMBO J 36: 2931–2950. 10.15252/embj.201797568 - DOI - PMC - PubMed
    1. Irwin DJ, Cairns NJ, Grossman M, McMillan CT, Lee EB, et al. (2015) Frontotemporal lobar degeneration: defining phenotypic diversity through personalized medicine. Acta Neuropathologica 129: 469–491. 10.1007/s00401-014-1380-1 - DOI - PMC - PubMed

Publication types

MeSH terms

LinkOut - more resources