. 2019 Sep:198:13-30.
doi: 10.1016/j.neuroimage.2019.04.077. Epub 2019 May 15.

Adolescent cognitive control, theta oscillations, and social observation

Affiliations

Adolescent cognitive control, theta oscillations, and social observation

George A Buzzell et al. Neuroimage. 2019 Sep.

Abstract

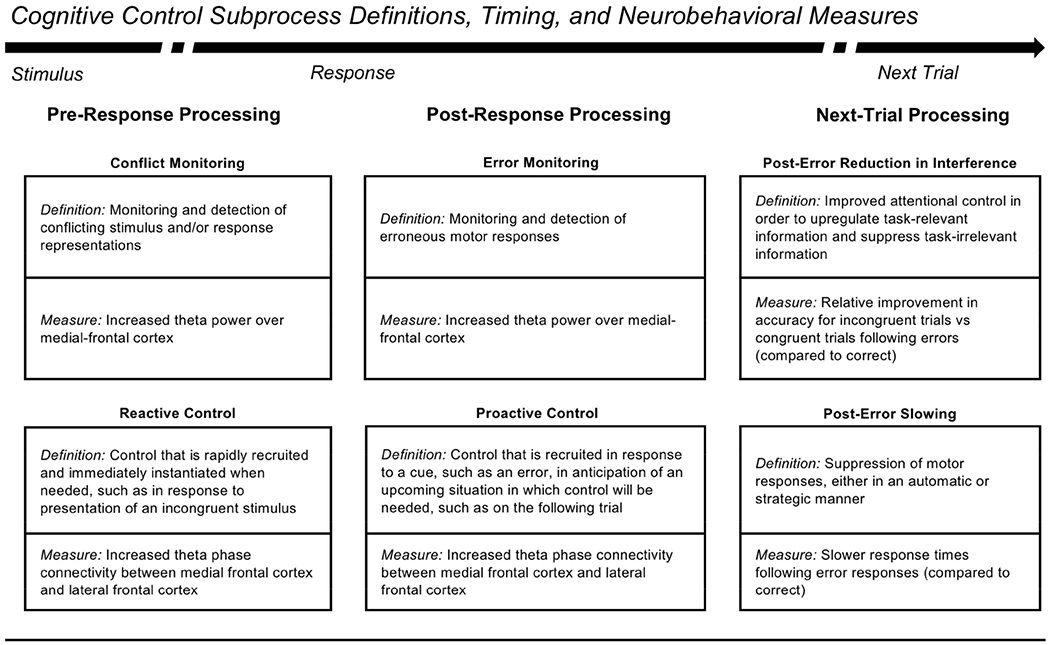
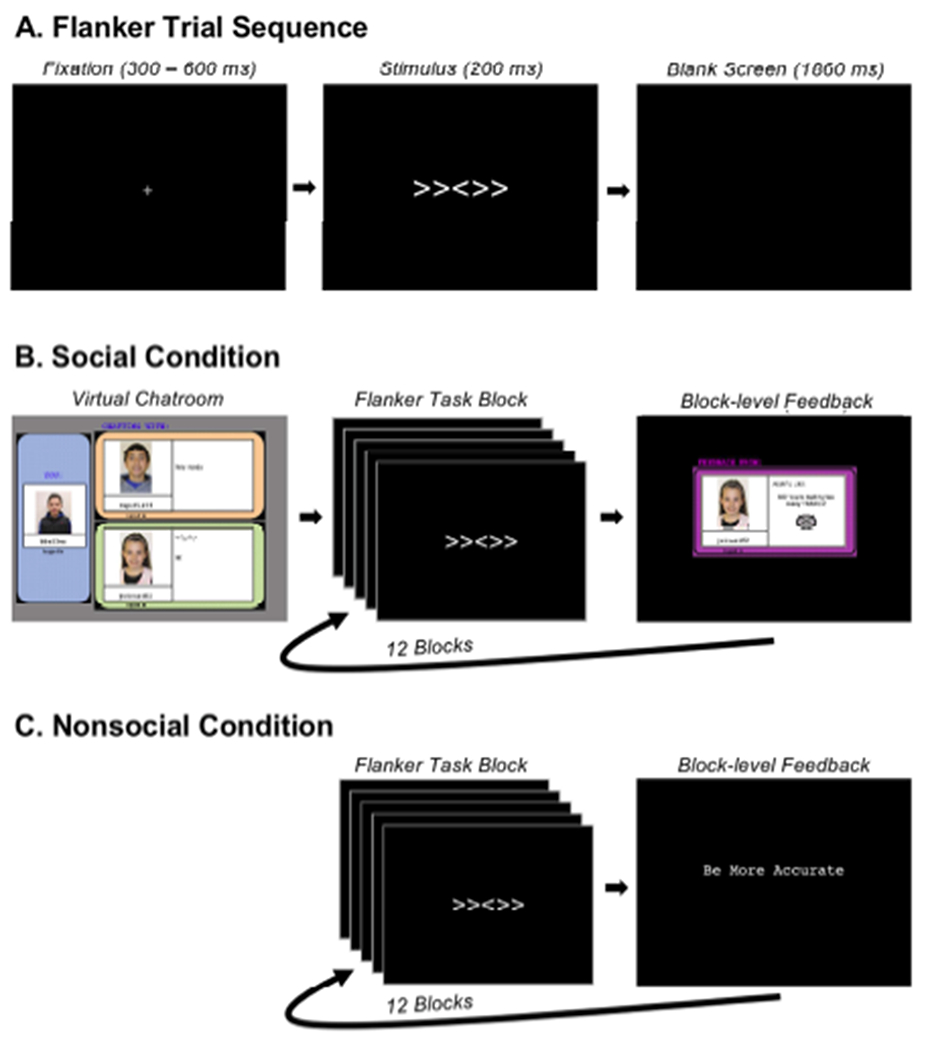
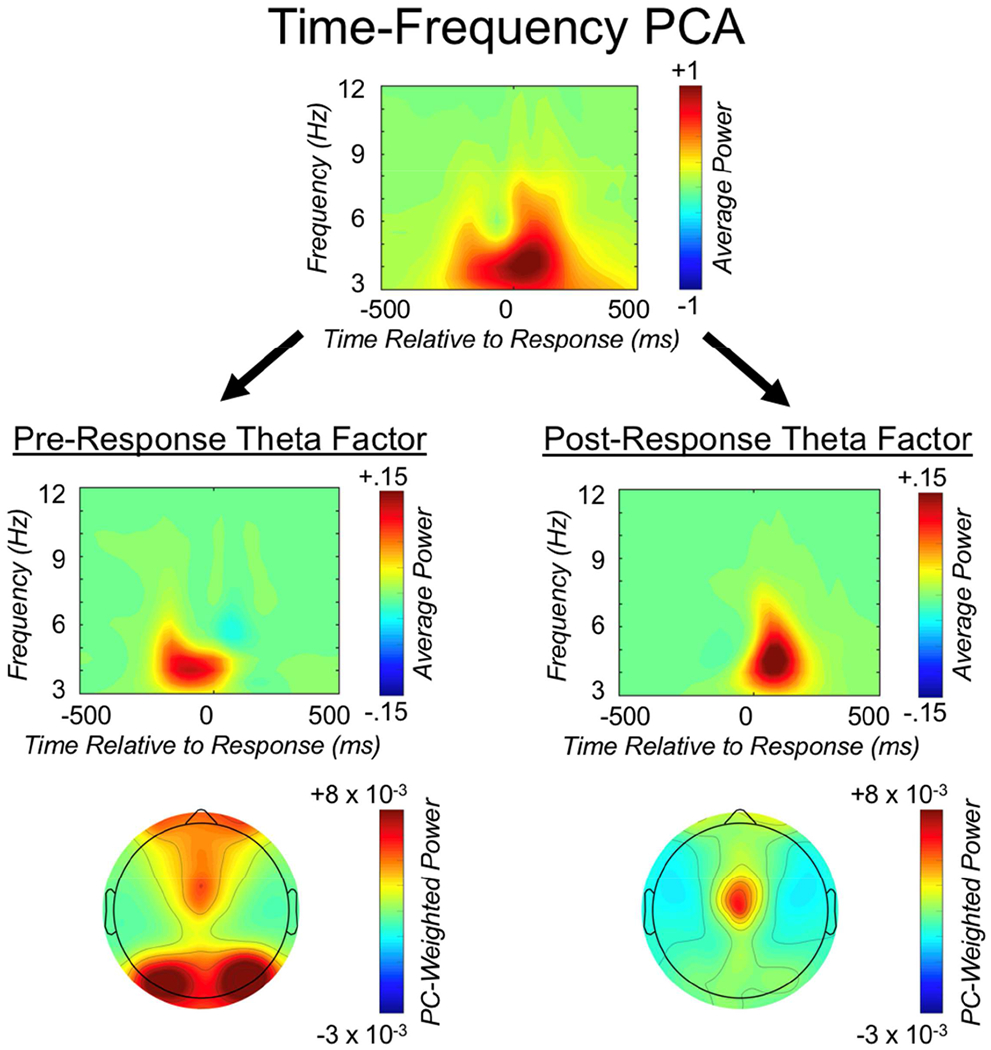
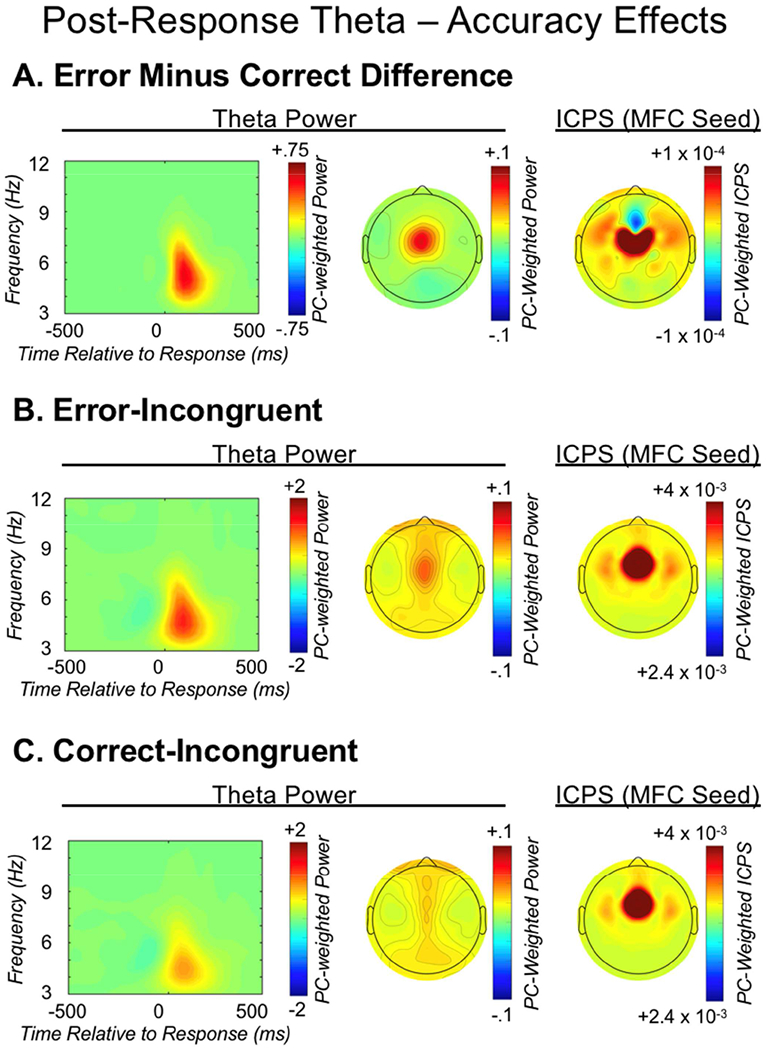
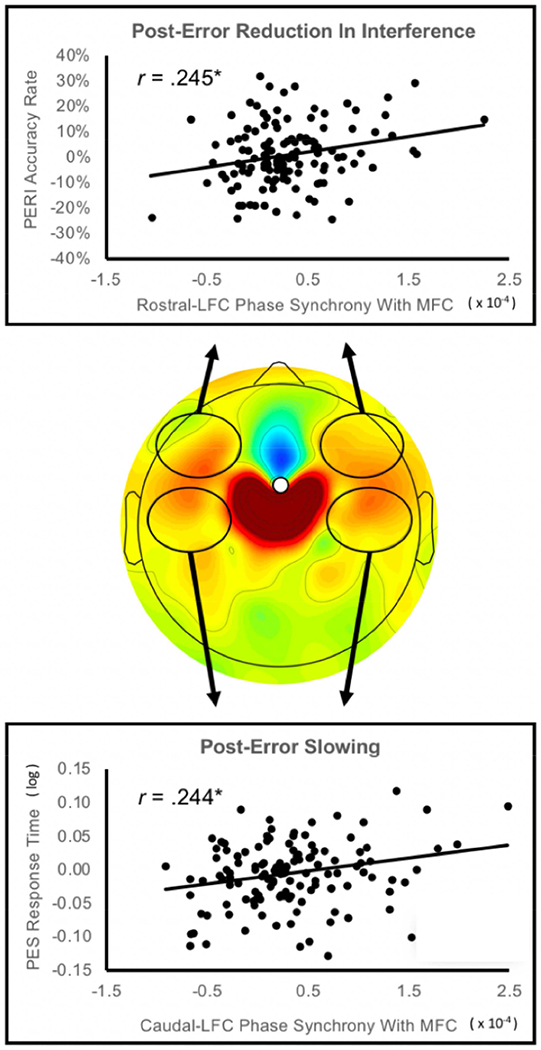
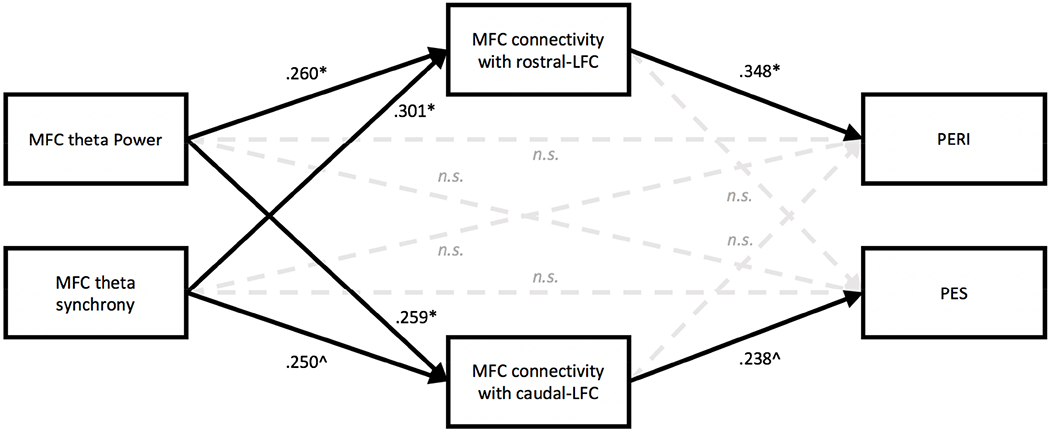
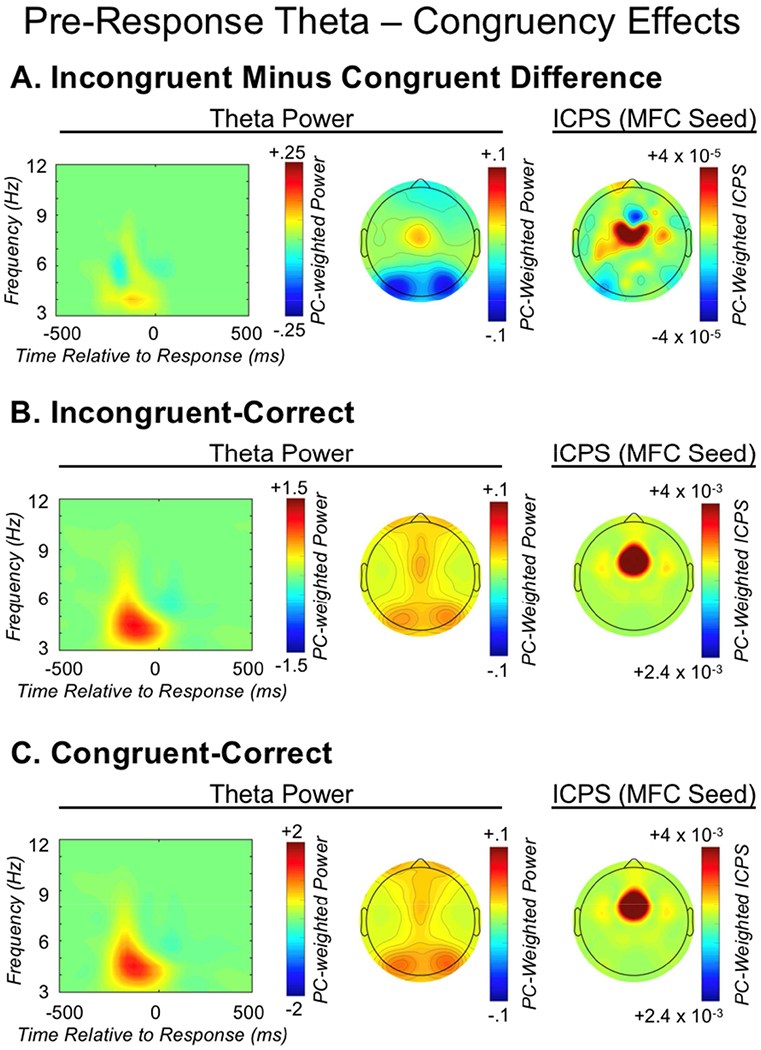
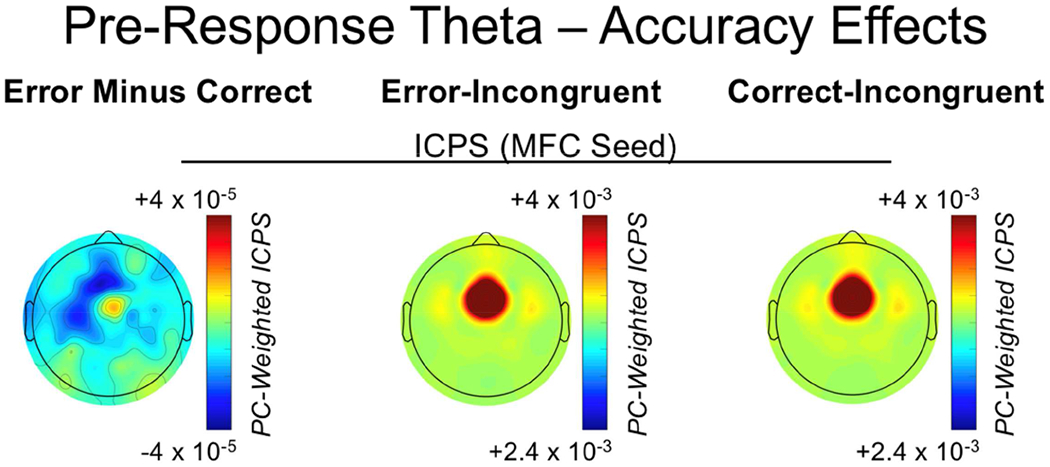
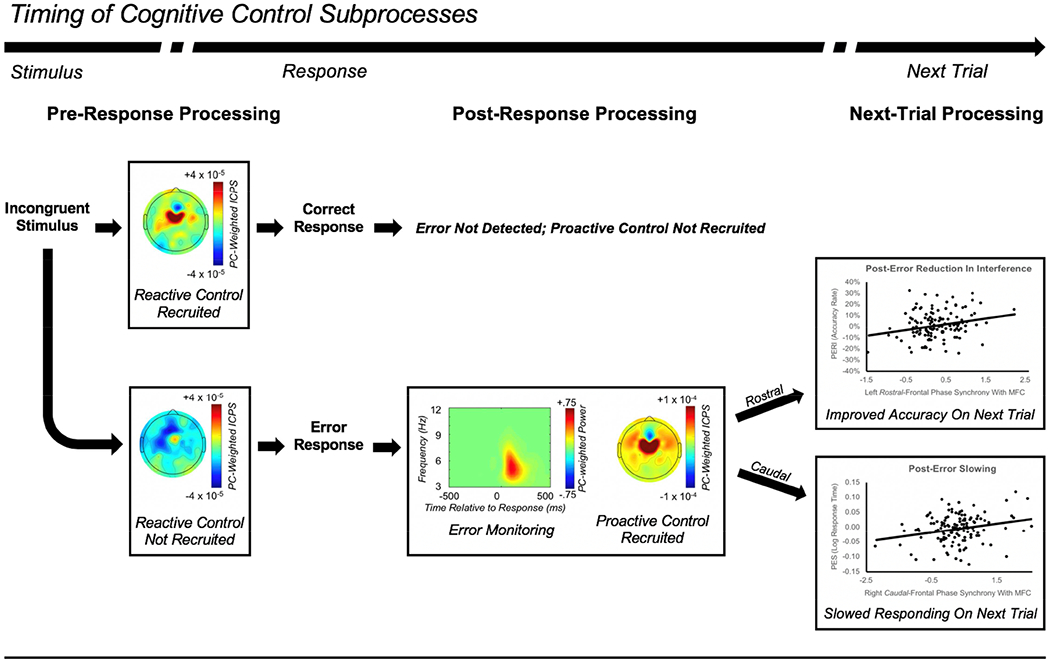
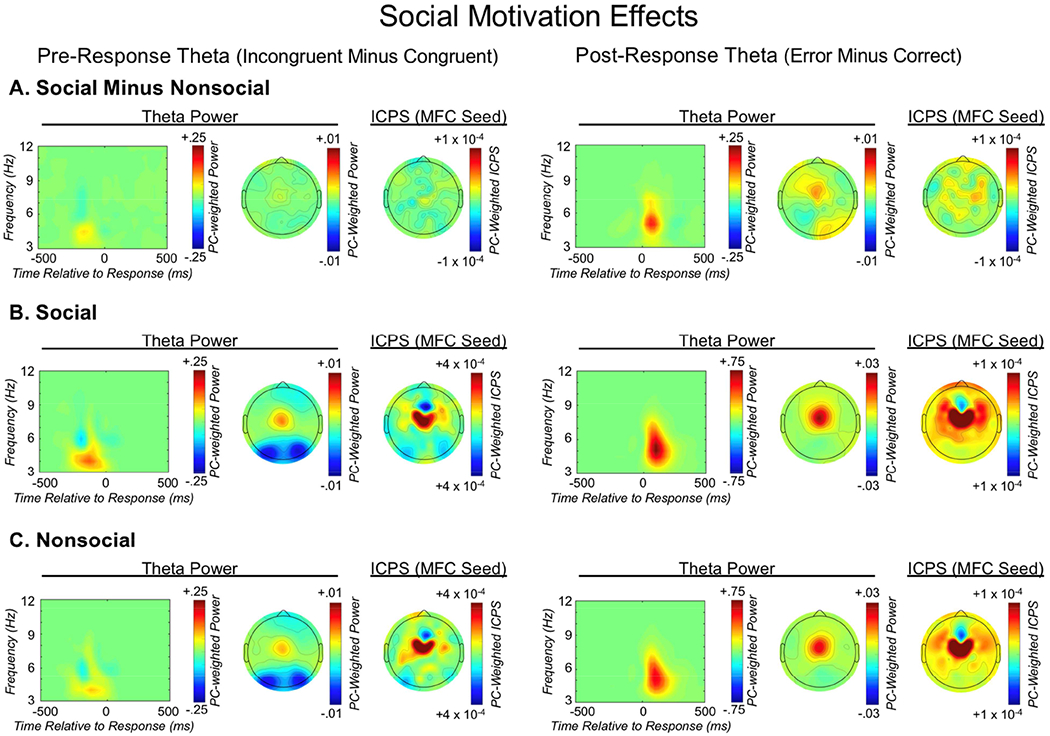
Theta oscillations (4-8 Hz) provide an organizing principle of cognitive control, allowing goal-directed behavior. In adults, theta power over medial-frontal cortex (MFC) underlies conflict/error monitoring, whereas theta connectivity between MFC and lateral-frontal regions reflects cognitive control recruitment. However, prior work has not separated theta responses that occur before and immediately after a motor response, nor explained how medial-lateral connectivity drives different kinds of control behaviors. Theta's role during adolescence, a developmental window characterized by a motivation-control mismatch also remains unclear. As social observation is known to influence motivation, this might be a particularly important context for studying adolescent theta dynamics. Here, adolescents performed a flanker task alone or under social observation. Focusing first on the nonsocial context, we parsed cognitive control into dissociable subprocesses, illustrating how theta indexes distinct components of cognitive control working together dynamically to produce goal-directed behavior. We separated theta power immediately before/after motor responses, identifying behavioral links to conflict monitoring and error monitoring, respectively. MFC connectivity was separated before/after responses and behaviorally-linked to reactive and proactive control, respectively. Finally, distinct forms of post-error control were dissociated, based on connectivity with rostral/caudal frontal cortex. Social observation was found to exclusively upregulate theta measures indexing post-response error monitoring and proactive control, as opposed to conflict monitoring and reactive control. Linking adolescent cognitive control to theta oscillations provides a bridge between non-invasive recordings in humans and mechanistic studies of neural oscillations in animal models; links to social observation provide insight into the motivation-control interactions that occur during adolescence.

Keywords: Adolescence; Cognitive control; Medial-frontal cortex (MFC); Motivation; Social observation; Theta.


Conflict of interest statement

Declaration of interests: none

Figures

Figure 1.
Figure 1.
Description of cognitive control subprocesses and neurobehavioral measures. The arrow depicts the flow of time for a single trial on a task requiring cognitive control (e.g. a flanker task). Time begins with stimulus presentation and pre-response processing, followed by response commission and post-response processing, ending with presentation of a subsequent trial and associated neurobehavioral processing. Each box defines a particular cognitive control subprocess and a neural or behavioral measure that can be used to index the subprocess. Note that the use of proactive control here is distinct from the more common study of “tonic proactive control” that occurs at the block level. Instead, our use of proactive control is in line with the notion of “transient proactive control” that can follow an error and prepare control for the subsequent trial in a proactive manner. See Table S1 for definitions.
Figure 2.
Figure 2.
Experimental paradigm. A) Identical trial sequence employed within the social and nonsocial conditions (no trial-level feedback). B) Depiction of the virtual chat room and block-level social feedback employed within the social condition to increase social motivation. C) Depiction of the nonsocial condition in which block-level computer-based feedback was provided.
Figure 3.
Figure 3.
The Time-frequency PCA approach. We isolated separate pre- and post-response theta factors by applying time-frequency principle component analysis (PCA) to average power data. These factor loadings were subsequently applied to total power and also leveraged for inter-channel phase synchrony measurement. The top panel reflects the unweighted average power time-frequency distribution over medial-frontal cortex (MFC), collapsed across all conditions of interest. The second row depicts the same average power distribution weighted by the pre- and post-response theta factors, respectively; the third row displays the corresponding topographic plots.
Figure 4.
Figure 4.
Electrode clusters employed in all EEG analyses. Medial-frontal cortex (orange); left and right rostral-lateral-frontal cortex (blue); right and left caudal-lateral-frontal cortex (green); right and left occipital cortex (red).
Figure 5.
Figure 5.
Post-response theta dynamics. From left to right, each row depicts: the medial-frontal cortex (MFC) total power time-frequency distribution weighted by the post-response theta factor; the corresponding topographic plot; MFC-seeded inter-channel phase synchrony (ICPS) within the post-response theta factor. The three rows present: A) the difference between error-incongruent and correct-incongruent activity; B) error-incongruent activity; C) correct-incongruent activity.
Figure 6.
Figure 6.
Relations between post-error MFC-LFC connectivity and next-trial behavior. The central plot depicts the increase in medial-frontal cortex (MFC) to lateral-frontal cortex (LFC) connectivity within the post-response theta factor (MFC seed; error minus correct difference); black ellipses indicate the location of electrode clusters used to quantify MFC connectivity with rostral/caudal LFC. The top scatterplot depicts relations between bilateral rostral-LFC connectivity and post-error reduction in interference (PERI); the bottom scatterplot depicts relations between bilateral caudal-LFC connectivity and post-error slowing (PES).
Figure 7.
Figure 7.
Standardized effects of theta power, synchrony and connectivity on post-error behavior. All neural measures reflect error-minus-correct difference scores weighted by the post-response theta factor. Medial frontal cortex (MFC); Lateral frontal cortex (LFC); Post-error reduction in interference (PERI); Post-error slowing (PES). Solid lines indicate significant paths and dashed lines indicate nonsignificant paths. Standardized direct effects are reported for ease of interpretation; significance was determined using bootstrapped unstandardized effects and their confidence intervals (see Table 3); * Indicates significance using a 95% confidence interval and ^ indicates significance using a 90% confidence interval. Significant indirect effects of MFC theta power or MFC theta synchrony on PERI/PES are reported in the main text and in Table 3.
Figure 8.
Figure 8.
Pre-response theta dynamics. From left to right, each row depicts: the medial-frontal cortex (MFC) total power time-frequency distribution weighted by the pre-response theta factor; the corresponding topographic plot; MFC-seeded inter-channel phase synchrony (ICPS) within the pre-response theta factor. The three rows present: A) the difference between incongruent-correct and congruent-correct activity; B) incongruent-correct activity; congruent-correct activity.
Figure 9.
Figure 9.
Pre-response theta dynamics as a function of response accuracy. From left to right, plots reflect medial-frontal cortex (MFC) seeded inter-channel phase synchrony (ICPS) within the pre-response theta factor for: the difference between error-incongruent and correct-incongruent activity; error-incongruent activity; correct-incongruent activity.
Figure 10.
Figure 10.
Cascade of processes involved in cognitive control. Progressing from left to right, the image depicts the relative timing of a cascade of cognitive control subprocesses. Following the presentation of a stimulus requiring control (e.g. an incongruent stimulus), if reactive control is properly recruited prior to the response then a correct response will be made; this results in post-response error monitoring not detecting the presence of an error, and as a result, no subsequent increase in proactive control (for the next trial) will be observed (top panel). In contrast, if reactive control is not properly recruited prior to the response then an error will be made, leading error monitoring to detect the presence of an error, further leading to an increase in proactive control processes (bottom panel). In turn, proactive control will influence behavior on the following trial, with more rostral-lateral-frontal cortex (LFC) regions driving post-error reduction in interference (PERI: top scatterplot), and more caudal-LFC regions driving post-error slowing (PES; bottom scatterplot).
Figure 11.
Figure 11.
The effects of social observation on pre- and post-response theta dynamics. From left to right, each row depicts: the medial-frontal cortex (MFC) total power time-frequency distribution weighted by the pre-response theta factor; the corresponding topographic plot; MFC-seeded inter-channel phase synchrony (ICPS) within the pre-response theta factor; the MFC total power time-frequency distribution weighted by the post-response theta factor; the corresponding topographic plot; MFC-seeded ICPS within the post-response theta factor. From top to bottom, each row depicts: A) the difference between social and nonsocial congruency-related and error-related difference scores of neural activity; B) social congruency-related and error-related difference scores of neural activity; C) nonsocial congruency-related and error-related difference scores of neural activity.

References

    1. Badre D 2008. Cognitive control, hierarchy, and the rostro–caudal organization of the frontal lobes. Trends Cogn Sci. 12:193–200. - PubMed
    1. Badre D, Wagner AD. 2004. Selection, Integration, and Conflict Monitoring: Assessing the Nature and Generality of Prefrontal Cognitive Control Mechanisms. Neuron. 41:473–487. - PubMed
    1. Banich MT. 2009. Executive Function: The Search for an Integrated Account. Curr Dir Psychol Sci. 18:89–94.
    1. Barker TV, Troller-Renfree SV, Bowman LC, Pine DS, Fox NA. 2018. Social influences of error monitoring in adolescent girls. Psychophysiology. 0:e13089. - PMC - PubMed
    1. Benjamini Y, Hochberg Y. 1995. Controlling the False Discovery Rate: A Practical and Powerful Approach to Multiple Testing. J R Stat Soc Ser B Methodol. 57:289–300.

Publication types