Fluid intelligence and working memory support dissociable aspects of learning by physical but not observational practice
- PMID: 31100547
- PMCID: PMC6711769
- DOI: 10.1016/j.cognition.2019.04.015
Fluid intelligence and working memory support dissociable aspects of learning by physical but not observational practice
Abstract
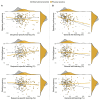
Humans have a remarkable ability to learn by watching others, whether learning to tie an elaborate knot or play the piano. However, the mechanisms that translate visual input into motor skill execution remain unclear. It has been proposed that common cognitive and neural mechanisms underpin learning motor skills by physical and observational practice. Here we provide a novel test of the common mechanism hypothesis by testing the extent to which certain individual differences predict observational as well as physical learning. Participants (N = 92 per group) either physically practiced a five-element key-press sequence or watched videos of similar sequences before physically performing trained and untrained sequences in a test phase. We also measured cognitive abilities across participants that have previously been associated with rates of learning, including working memory and fluid intelligence. Our findings show that individual differences in working memory and fluid intelligence predict improvements in dissociable aspects of motor learning following physical practice, but not observational practice. Working memory predicts general learning gains from pre- to post-test that generalise to untrained sequences, whereas fluid intelligence predicts sequence-specific gains that are tied to trained sequences. However, neither working memory nor fluid intelligence predict training gains following observational learning. Therefore, these results suggest limits to the shared mechanism hypothesis of physical and observational learning. Indeed, models of observational learning need updating to reflect the extent to which such learning is based on shared as well as distinct processes compared to physical learning. We suggest that such differences could reflect the more intentional nature of learning during physical compared to observational practice, which relies to a greater extent on higher-order cognitive resources such as working memory and fluid intelligence.
Keywords: Fluid intelligence; Individual differences; Observational learning; Working memory.
Copyright © 2019 The Authors. Published by Elsevier B.V. All rights reserved.
Figures


Similar articles
-
A potential spatial working memory training task to improve both episodic memory and fluid intelligence.PLoS One. 2012;7(11):e50431. doi: 10.1371/journal.pone.0050431. Epub 2012 Nov 28. PLoS One. 2012. PMID: 23209740 Free PMC article.
-
Failure of working memory training to enhance cognition or intelligence.PLoS One. 2013 May 22;8(5):e63614. doi: 10.1371/journal.pone.0063614. Print 2013. PLoS One. 2013. PMID: 23717453 Free PMC article.
-
Improving fluid intelligence with training on working memory: a meta-analysis.Psychon Bull Rev. 2015 Apr;22(2):366-77. doi: 10.3758/s13423-014-0699-x. Psychon Bull Rev. 2015. PMID: 25102926
-
Does working memory training work? The promise and challenges of enhancing cognition by training working memory.Psychon Bull Rev. 2011 Feb;18(1):46-60. doi: 10.3758/s13423-010-0034-0. Psychon Bull Rev. 2011. PMID: 21327348 Review.
-
Neurocognitive contributions to motor skill learning: the role of working memory.J Mot Behav. 2012;44(6):445-53. doi: 10.1080/00222895.2012.672348. J Mot Behav. 2012. PMID: 23237467 Free PMC article. Review.
Cited by
-
The role of art knowledge training on aesthetic judgements and executive functions.R Soc Open Sci. 2025 Feb 26;12(2):240175. doi: 10.1098/rsos.240175. eCollection 2025 Feb. R Soc Open Sci. 2025. PMID: 40012756 Free PMC article.
References
-
- Ackerman PL. Determinants of individual differences during skill acquisition: Cognitive abilities and information processing. Journal of Experimental Psychology: General. 1988;117(3):288–318. doi: 10.1037/0096-3445.117.3.288. - DOI
-
- Ackerman PL, Cianciolo AT. Cognitive, perceptual-speed, and psychomotor determinants of individual differences during skill acquisition. Journal of Experimental Psychology: Applied. 2000;6(4):259–90. - PubMed
-
- Alexander JRM, Smales S. Intelligence, learning and long-term memory. Personality and Individual Differences. 1997;23(5):815–825. doi: 10.1016/S0191-8869(97)00054-8. - DOI
Publication types
MeSH terms
Grants and funding
LinkOut - more resources
Full Text Sources
Miscellaneous

