. 2019 May 16;11(5):449.
doi: 10.3390/v11050449.

Structure and Hierarchy of Influenza Virus Models Revealed by Reaction Network Analysis

Affiliations

Structure and Hierarchy of Influenza Virus Models Revealed by Reaction Network Analysis

Stephan Peter et al. Viruses. .

Abstract

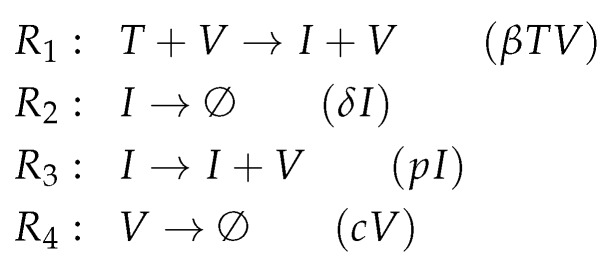
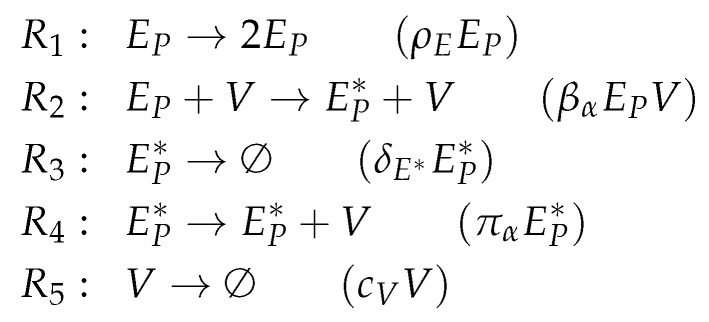
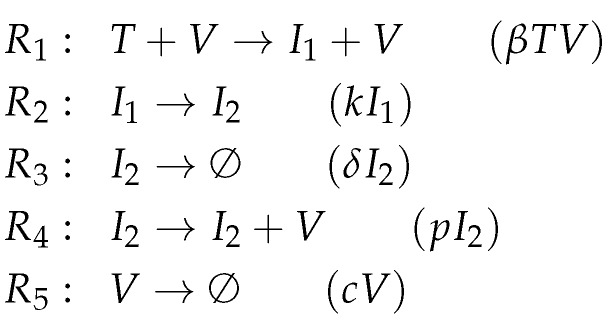
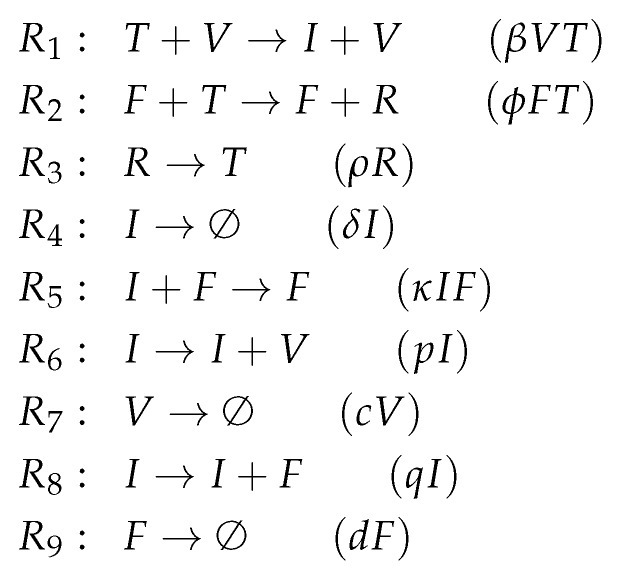
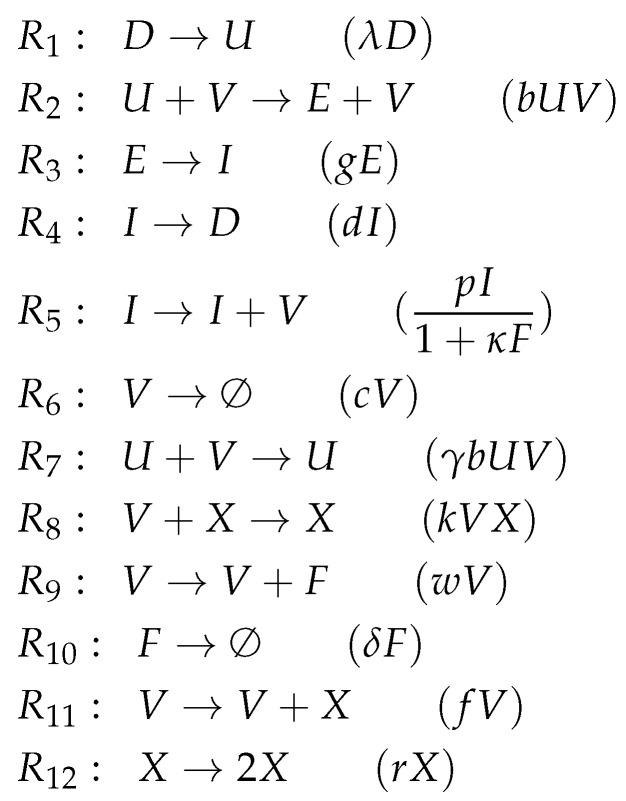
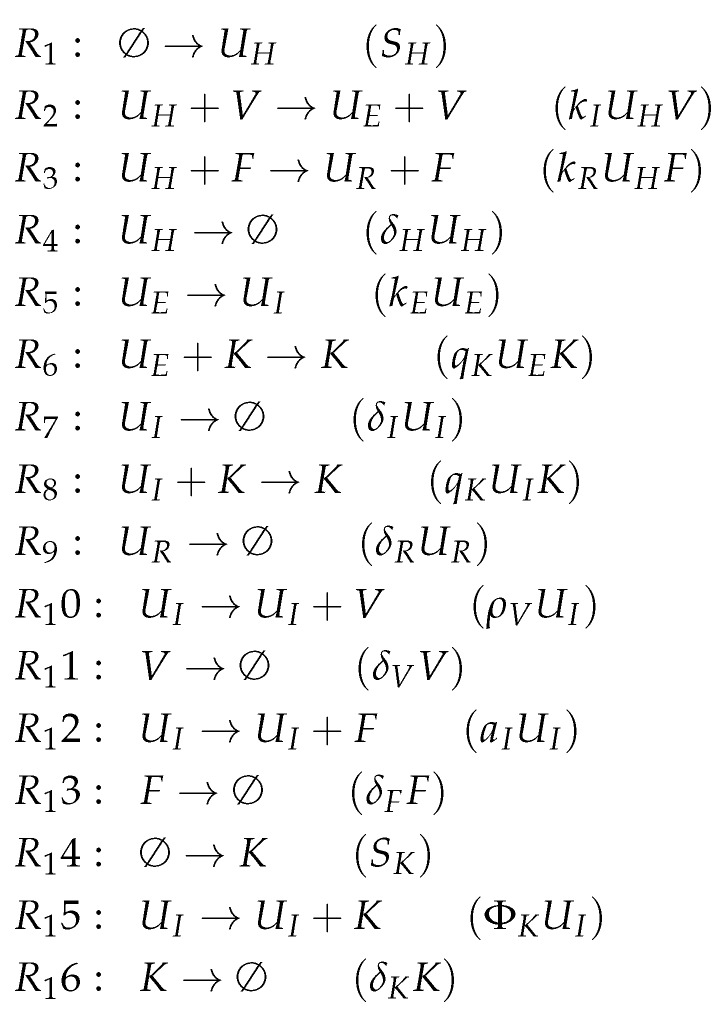
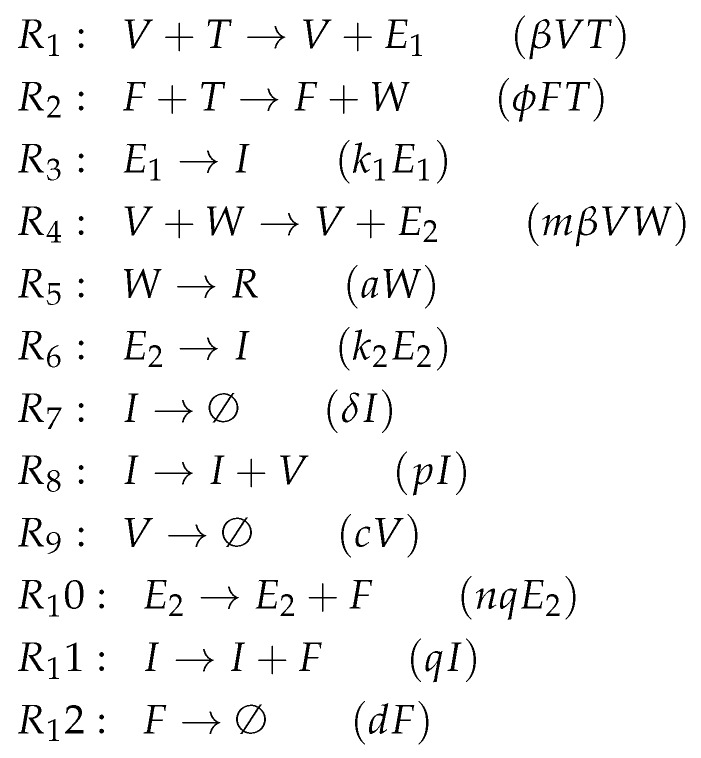
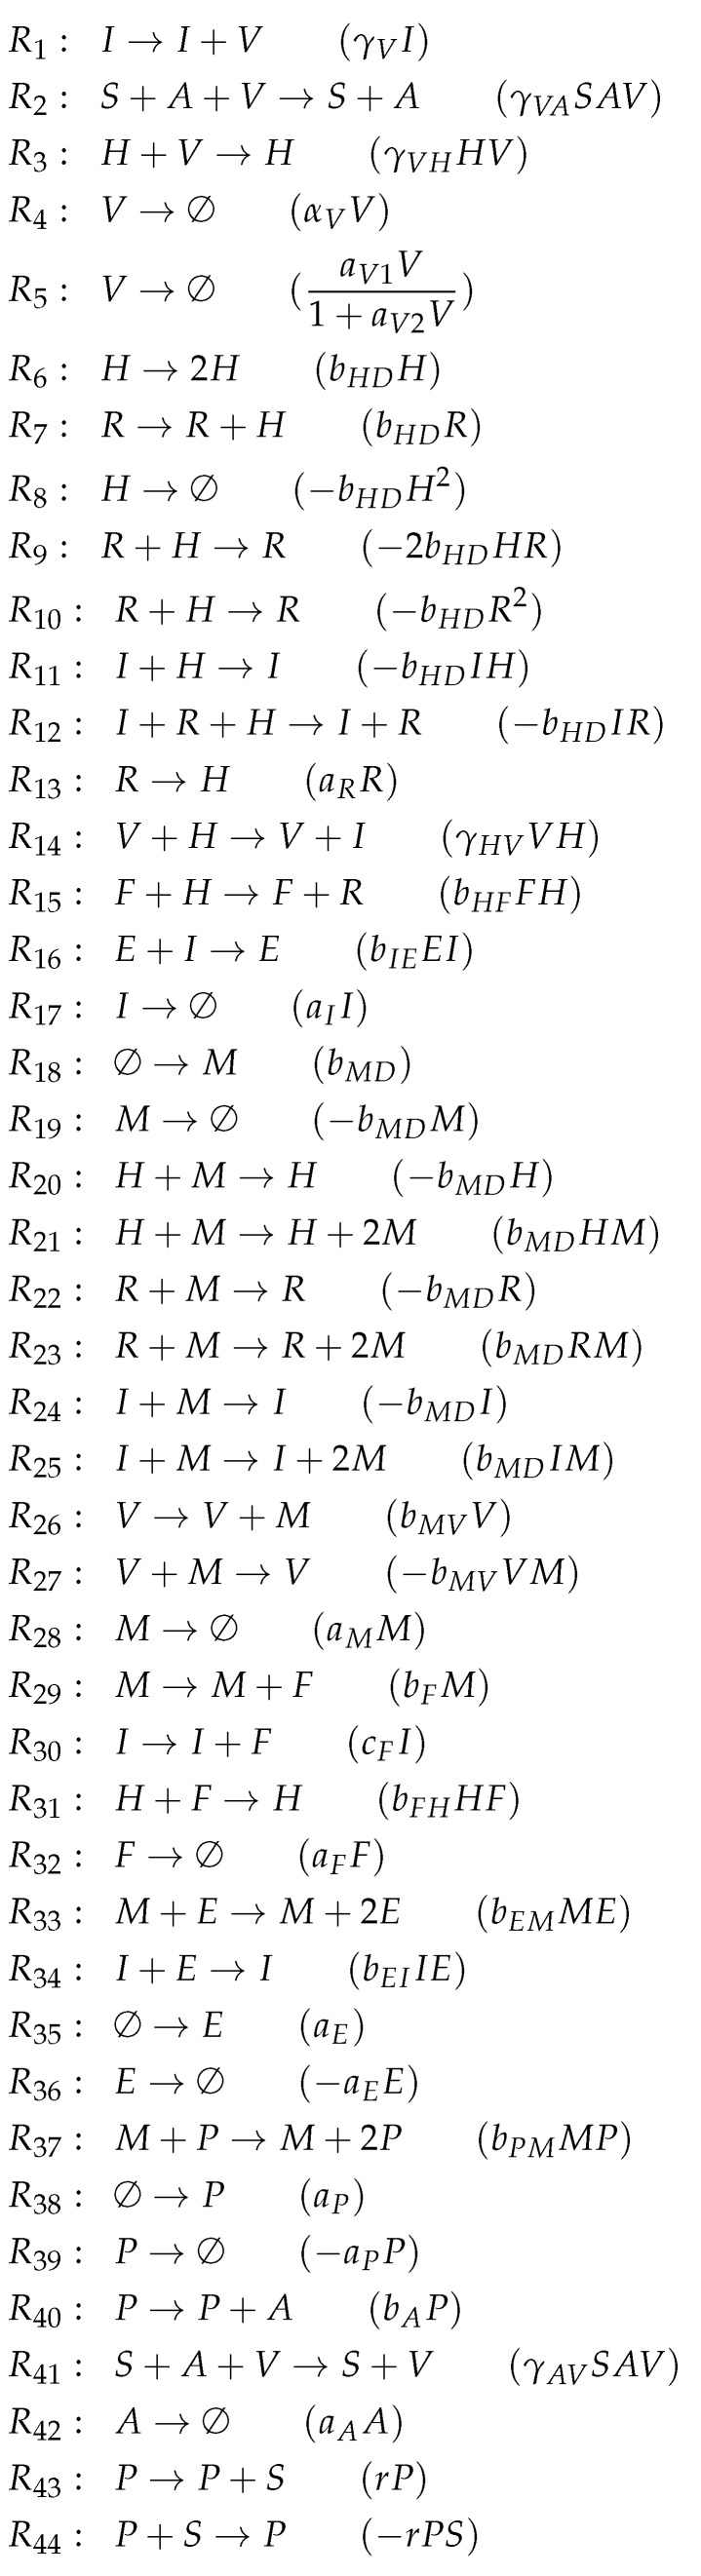
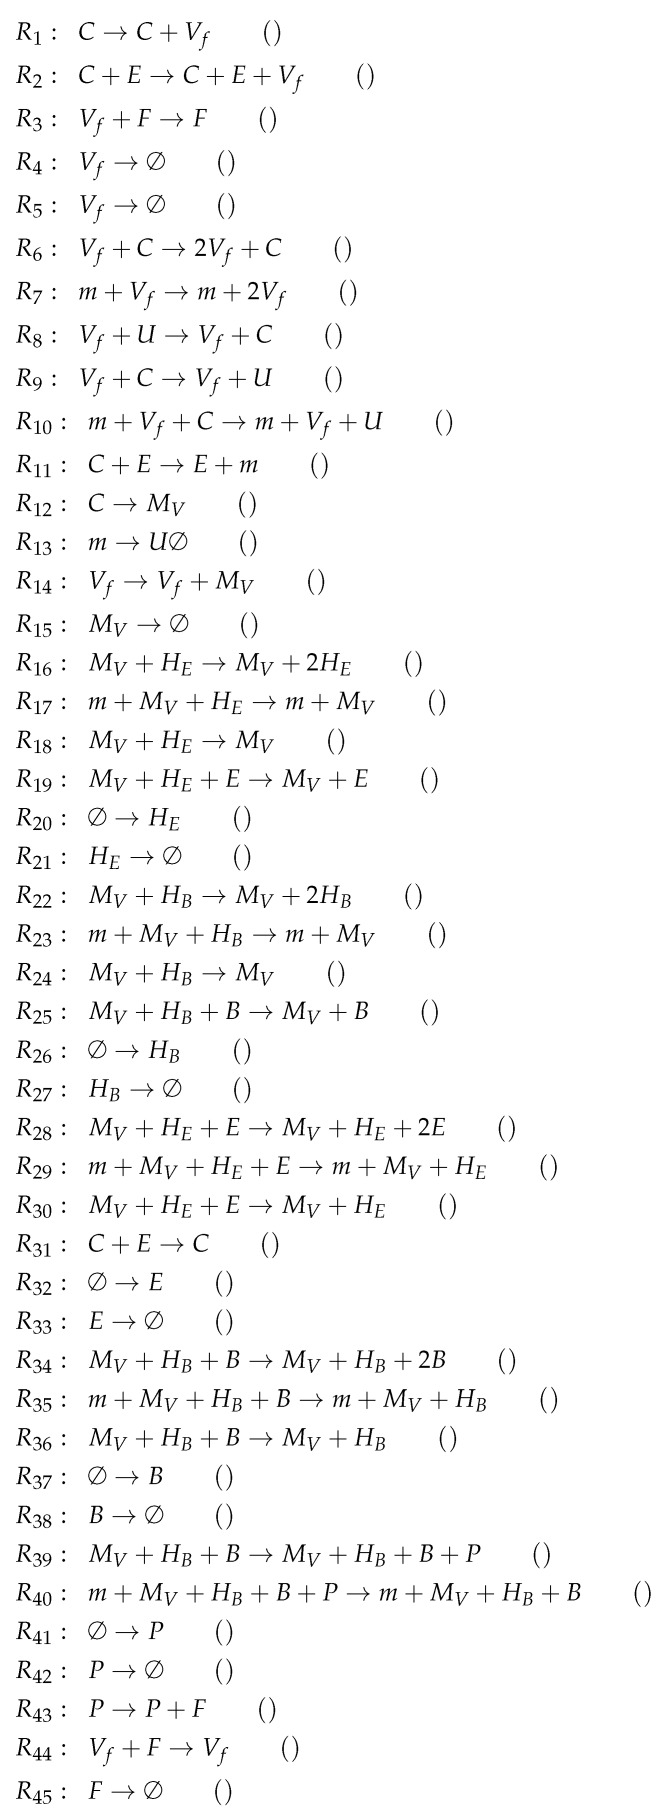
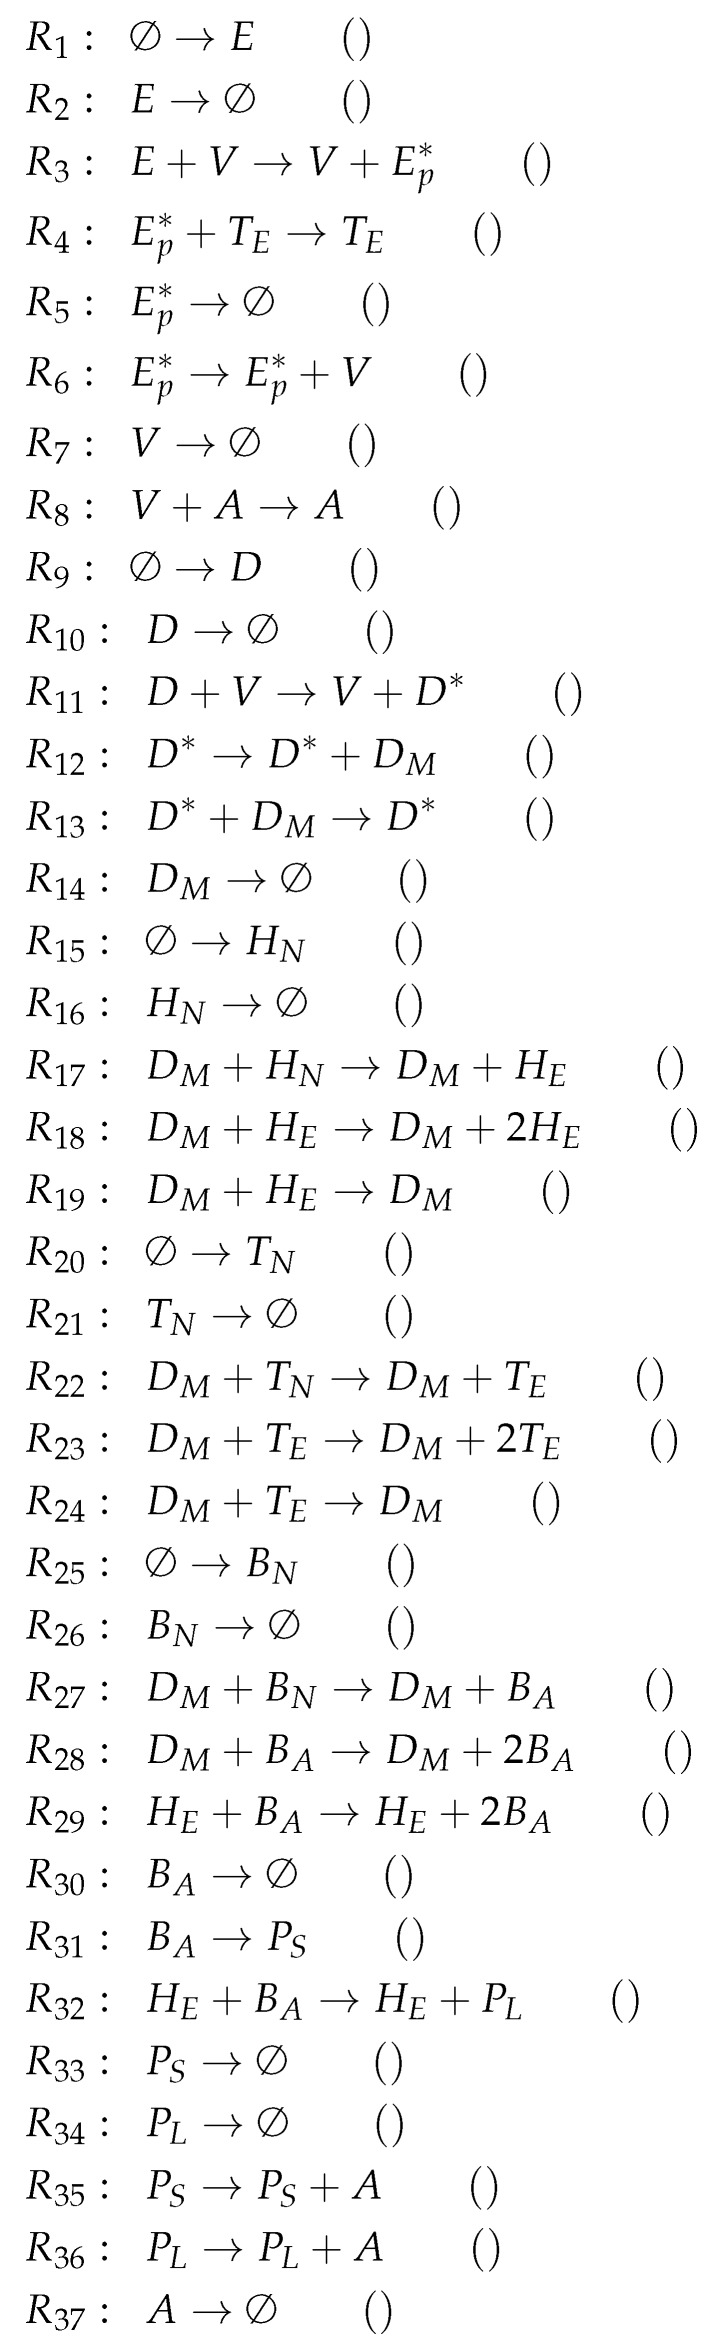
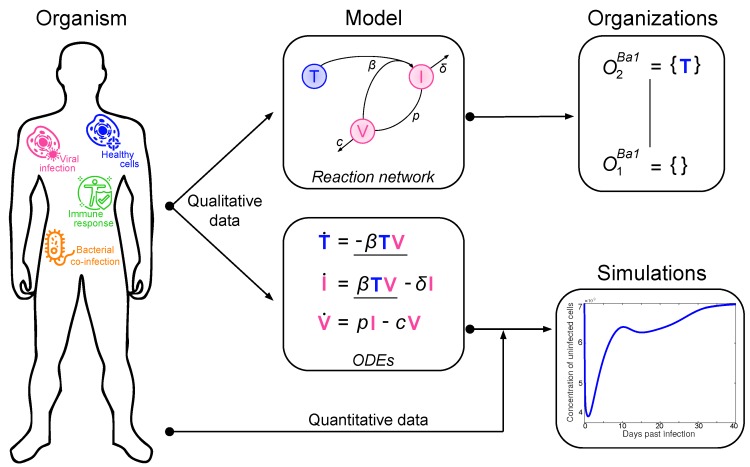
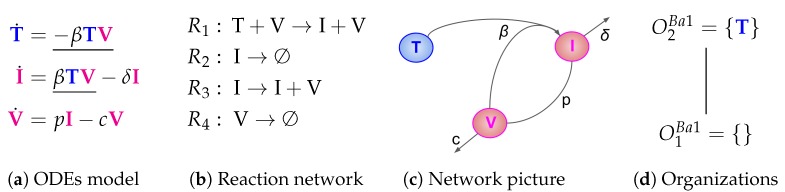
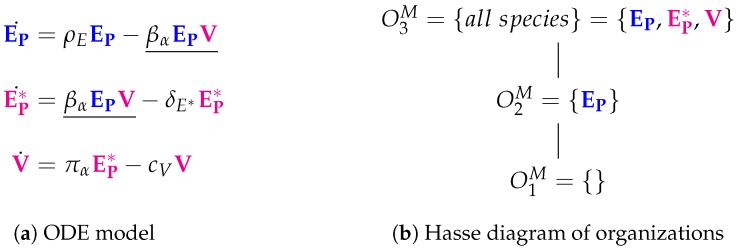
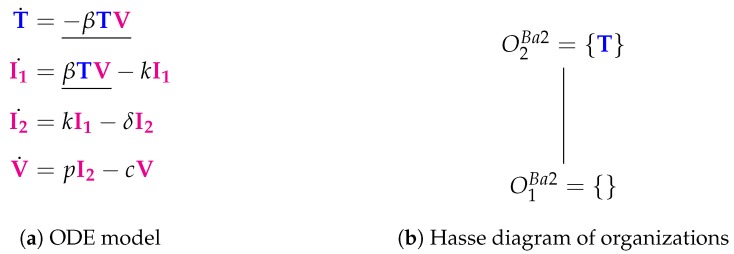
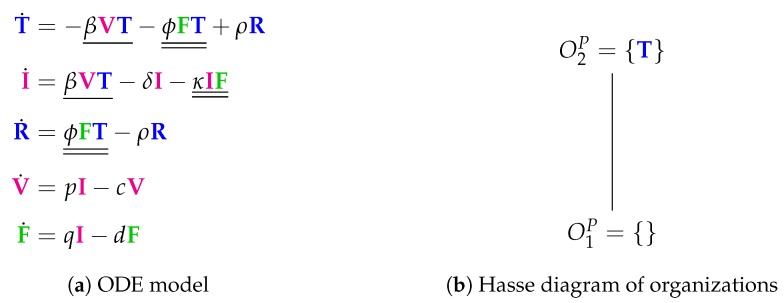
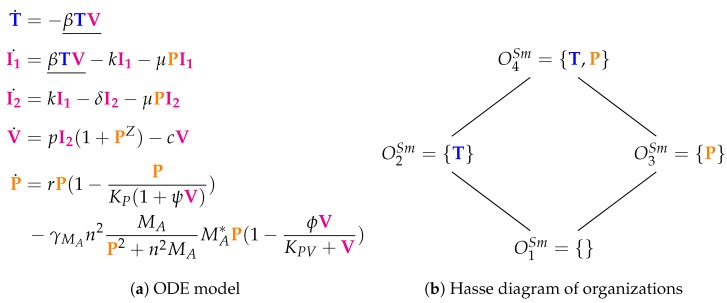
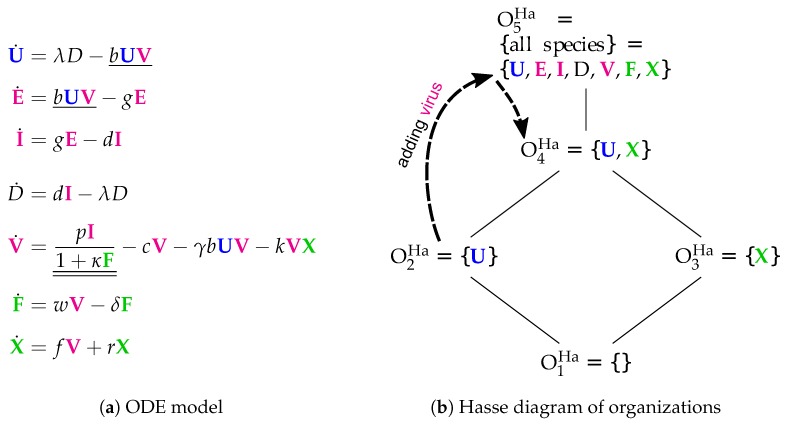
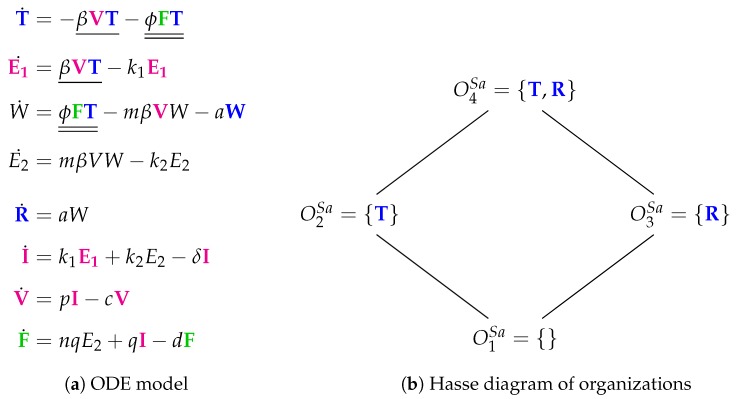
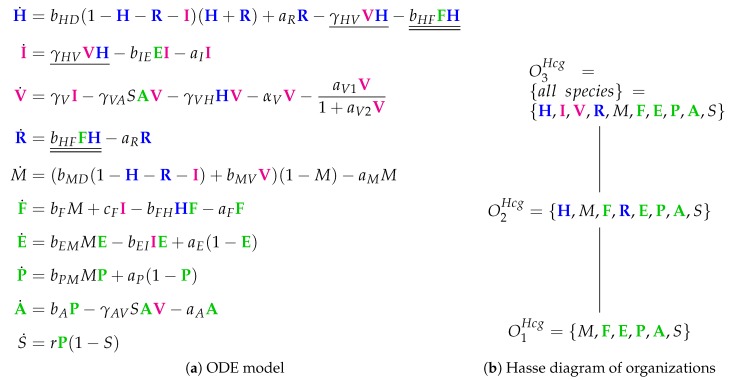
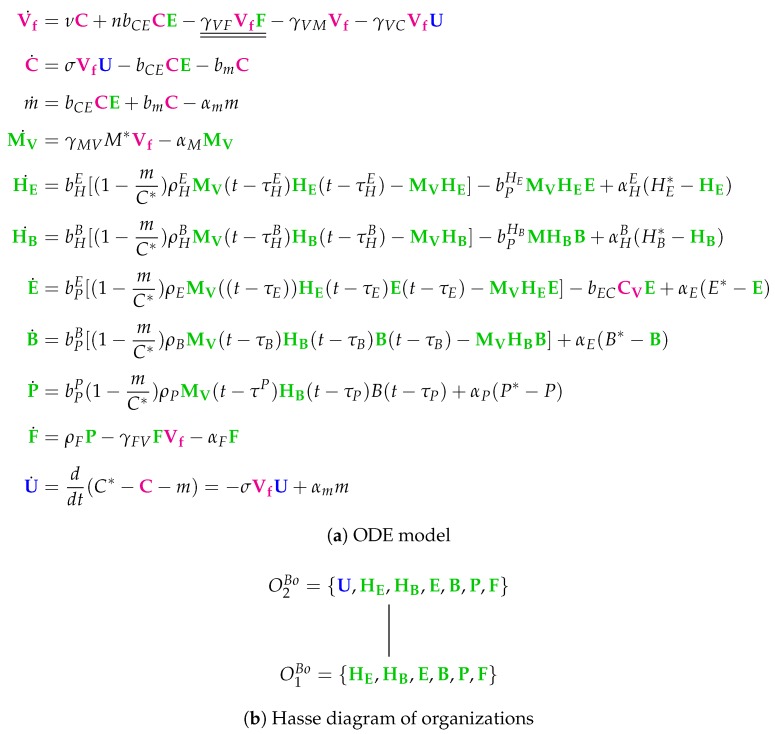
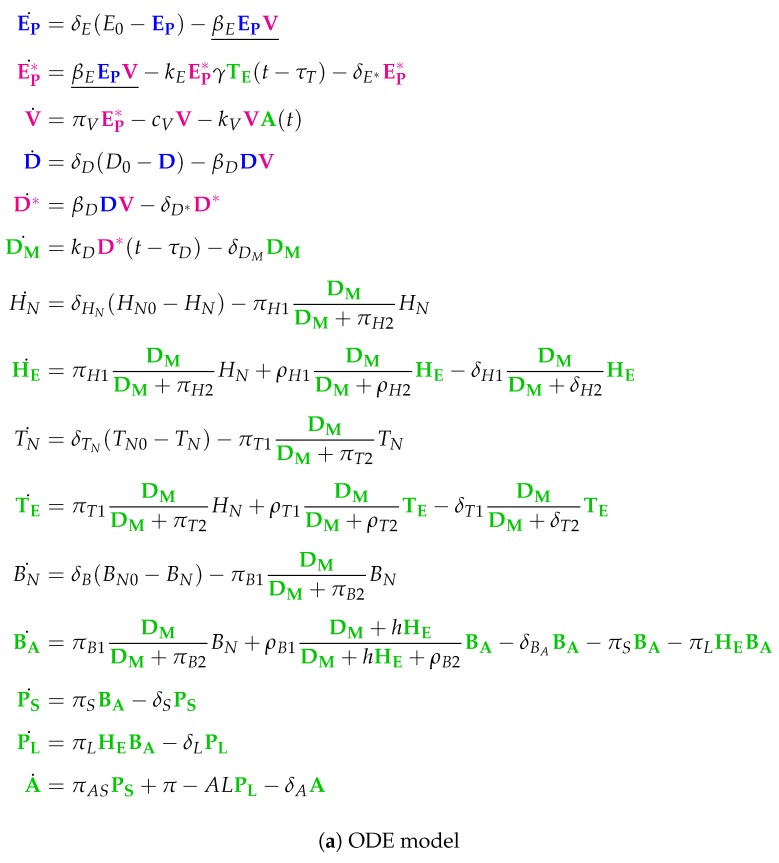
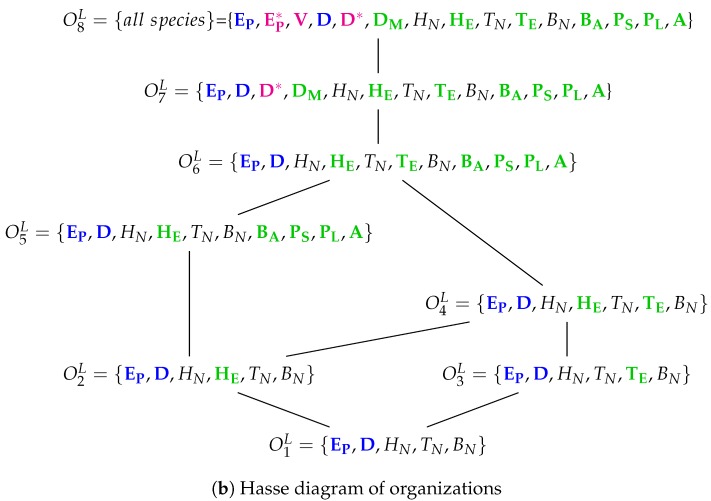
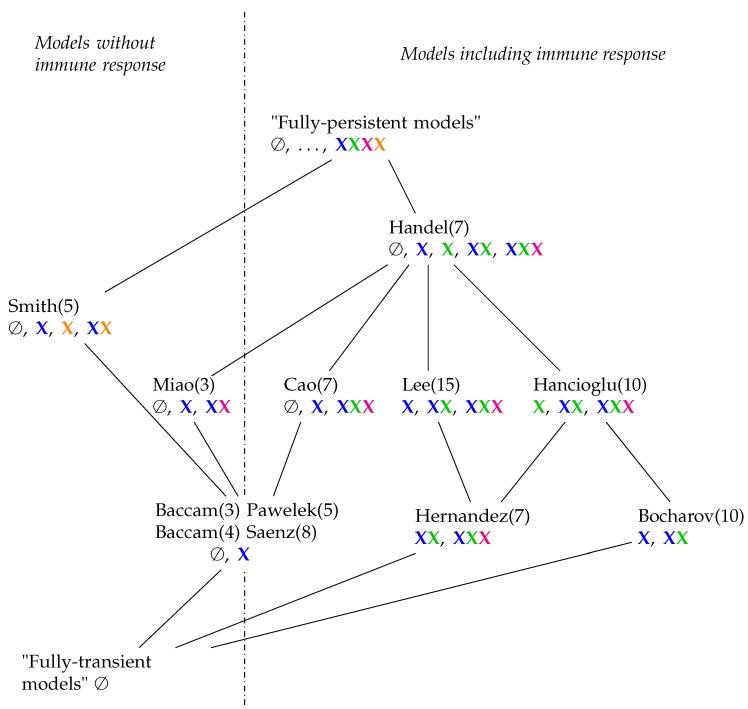
Influenza A virus is recognized today as one of the most challenging viruses that threatens both human and animal health worldwide. Understanding the control mechanisms of influenza infection and dynamics is crucial and could result in effective future treatment strategies. Many kinetic models based on differential equations have been developed in recent decades to capture viral dynamics within a host. These models differ in their complexity in terms of number of species elements and number of reactions. Here, we present a new approach to understanding the overall structure of twelve influenza A virus infection models and their relationship to each other. To this end, we apply chemical organization theory to obtain a hierarchical decomposition of the models into chemical organizations. The decomposition is based on the model structure (reaction rules) but is independent of kinetic details such as rate constants. We found different types of model structures ranging from two to eight organizations. Furthermore, the model's organizations imply a partial order among models entailing a hierarchy of model, revealing a high model diversity with respect to their long-term behavior. Our methods and results can be helpful in model development and model integration, also beyond the influenza area.

Keywords: chemical organization theory; complex networks analysis; influenza A; virus dynamics modeling.


Conflict of interest statement

The authors declare no conflict of interest

Figures

Figure A1
Figure A1
Reactions of Baccam model [13].
Figure A2
Figure A2
Reactions of Miao model [14].
Figure A3
Figure A3
Reactions of Baccam model [14] with delayed virus production.
Figure A4
Figure A4
Reactions of Pawelek model [23].
Figure A5
Figure A5
Reactions of Handel model [24].
Figure A6
Figure A6
Reactions of Hernandez model [26].
Figure A7
Figure A7
Reactions of Saenz model [28].
Figure A8
Figure A8
Reactions of Hancioglu model [29].
Figure A9
Figure A9
Reactions of Bocharov model [30].
Figure A10
Figure A10
Reactions of Lee model [9].
Figure 1
Figure 1
Relation between measured data, ordinary differential equations (ODE) model, and hierarchy of organizations.
Figure 2
Figure 2
The Baccam Model [13] with three variables: uninfected (susceptible) target cells (T), infected cells (I) and infectious-viral titer (V).
Figure 3
Figure 3
The Miao Model [14] with three variables: uninfected target cells (EP), productively infected cells (EP*) and free infectious influenza viruses (V).
Figure 4
Figure 4
The Baccam II Model [13] with delayed virus production and four variables: uninfected (susceptible) target cells (T), infected cells not yet producing virus (I1), infected cells actively producing virus (I2) and infectious-viral titer (V).
Figure 5
Figure 5
The Pawelek Model [23] with five variables: (uninfected) target cells (T), productively infected cells (I), uninfected cells refractory to infections (R), free viruses (V) and interferon (F).
Figure 6
Figure 6
The Smith Model [15] with five variables: susceptible target cells (T), two classes of infected cells (I1 and I2), free viruses (V), and bacteria (P).
Figure 7
Figure 7
The Handel model [24] with seven variables: uninfected cells (U), latently infected cells (E), productively infected cells (I), dead cells (D), free viruses (V), innate immune response (F) and adaptive immune response (X). The dotted arrows denote the projection of the dynamics shown in Figure 8.
Figure 8
Figure 8
Temporal dynamics of the Handel model. By projecting the seven-dimensional trajectory to organizations (dotted arrows in Figure 7b) we find three phases: (Phase 1) Until day number 0, there are solely 7×10⁹ uninfected cells U in the system represented by the organization O2Ha={U}. (Phase 2) At day 0, infection is simulated by adding V(0)=104 virus particles to the system. The resulting state {U,V} is projected to organization O5Ha (all species). (Phase 3) Lastly, at day t = 37d past infection the system settles in the final organization, namely O4Ha={U,X}, which is generated by the set {U,X,D} (see text). The values of the model parameters are (from [24]): λ=0.25, b=2.1×10⁷, g=4, d=2, p=5×10², κ=1.8×10², c=10, γ=7.5×10⁴, k=1.8, w=1, δ=0.4, f=2.7×10⁶, and r=0.3. Note that the number of uninfected cells U is not constant after infection as it may seem from the figure. In fact, after infection, the number of uninfected cells first decreases and than rises again [24].
Figure 9
Figure 9
The Hernandez Model [26] with seven variables: healthy cells (UH), partially infected cell (UE), infected cells (UI), cells resistant to infection (UR), virus particles (V), interferon (F) and natural killers (K).
Figure 10
Figure 10
The Cao Model [27] with seven variables: target cells (T), infected cells (I), viruses (V), resistant cells (R), interferon (F), B cells (B), and antibodies (A).
Figure 11
Figure 11
The Saenz Model [28] with eight variables: Epithelial cells in one of the states: susceptible (T), eclipse phase (E1 and E2), prerefractory (W), refractory (R) and infectious (I). The further variables are: virus cells (V) and interferon (F).
Figure 12
Figure 12
The Hancioglu Model [29] with 10 variables: viral load (V), healthy cells (H), infected cells (I), antigen presenting cells (M), interferon (F), resistant cells (R), effector cells (E), plasma cells (P), antibodies (A) and antigenic distance (S).
Figure 13
Figure 13
The Bocharov Model [30] with 10 variables: infective IAV particles (Vf), IAV-infected cells (C), destroyed epithelial cells (m), stimulated macrophages (MV), activated helper T cells providing proliferation of cytotoxic T cells (HE), activated helper T cells providing proliferation and differentiation of B cells B (HB), activated CTL (E), B cells (B), plasma cells (P), antibodies to IAV (F), and uninfected epithelial cells (U). Note that, for clarity, we have added U as a state variable, which is only implicitly represented as U=C*Cm in the original model by Bocharov et al.
Figure 14
Figure 14
The Lee model [9] which contains 15 variables: uninfected epithelial cells (EP), infected epithelial cells (EP*), virus titer (EID50/ml) (V), immature dendritic cells (D), virus-loaded dendritic cells (D*), mature dendritic cells (DM), naive CD4+ T cells (HN), effector CD4+ T cells (HE), naive CD8+ T cells (TN), effector CD8+ T cells (TE), naive B cells (BN), activated B cells (BA), short-lived plasma (antibody-secreting) B cells (PS), long-lived plasma (antibody-secreting) B cells (PL) and antiviral antibody titer (A). Note that here we have colored green only those species representing the immune system when activated.
Figure 14
Figure 14
The Lee model [9] which contains 15 variables: uninfected epithelial cells (EP), infected epithelial cells (EP*), virus titer (EID50/ml) (V), immature dendritic cells (D), virus-loaded dendritic cells (D*), mature dendritic cells (DM), naive CD4+ T cells (HN), effector CD4+ T cells (HE), naive CD8+ T cells (TN), effector CD8+ T cells (TE), naive B cells (BN), activated B cells (BA), short-lived plasma (antibody-secreting) B cells (PS), long-lived plasma (antibody-secreting) B cells (PL) and antiviral antibody titer (A). Note that here we have colored green only those species representing the immune system when activated.
Figure 15
Figure 15
Hasse-diagram of the hierarchy of IAV models with respect to their long-term behaviour. In brackets (), we added the number of species of each model. Underneath (marked by colors) the kinds of species contained in the organizations belonging to each model. The meaning of the four colors is as follows: Species belonging to the healthy state of the organism are colored blue, those belonging to the immune response are colored green, those belonging to infection like infected cells and viruses are colored magenta, and bacteria from bacterial co-infection are colored orange. Horizontally, the diagram consists of four lines. The models in the lowest line contain organizations with exactly two different kinds of species (colors) (including the empty set). In the second line above, there are three different combinations of species (colors) to be found in each model. There is only one model in each of the highest two lines: The Smith model [4] is the only one with bacteria and contains four different combinations of colors. In the Handel Model, there are even five different combinations of colors out of 24=16 possible combinations.

Similar articles

Cited by

References

    1. Stöhr K. Influenza—WHO cares. Lancet Infect. Dis. 2002;2:517. doi: 10.1016/S1473-3099(02)00366-3. - DOI - PubMed
    1. Petrova V.N., Russell C.A. The evolution of seasonal influenza viruses. Nat. Rev. Microbiol. 2018;16:47–60. doi: 10.1038/nrmicro.2017.118. - DOI - PubMed
    1. Krammer F., Smith G.J., Fouchier R.A., Peiris M., Kedzierska K., Doherty P.C., Palese P., Shaw M.L., Treanor J., Webster R.G., et al. Influenza. Nat. Rev. Dis. Prim. 2018;4 doi: 10.1038/s41572-018-0002-y. - DOI - PMC - PubMed
    1. Smith A.M., Perelson A.S. Influenza A virus infection kinetics: Quantitative data and models. Wiley Interdiscip. Rev. Syst. Biol. Med. 2011;3:429–445. doi: 10.1002/wsbm.129. - DOI - PMC - PubMed
    1. Beauchemin C.A., Handel A. A review of mathematical models of influenza A infections within a host or cell culture: Lessons learned and challenges ahead. BMC Public Health. 2011;11(Suppl. 1):S7. doi: 10.1186/1471-2458-11-S1-S7. - DOI - PMC - PubMed

Publication types