. 2019 May 17;17(1):46.
doi: 10.1186/s12964-019-0356-0.

Response to IL-6 trans- and IL-6 classic signalling is determined by the ratio of the IL-6 receptor α to gp130 expression: fusing experimental insights and dynamic modelling

Affiliations

Response to IL-6 trans- and IL-6 classic signalling is determined by the ratio of the IL-6 receptor α to gp130 expression: fusing experimental insights and dynamic modelling

Heike Reeh et al. Cell Commun Signal. .

Abstract

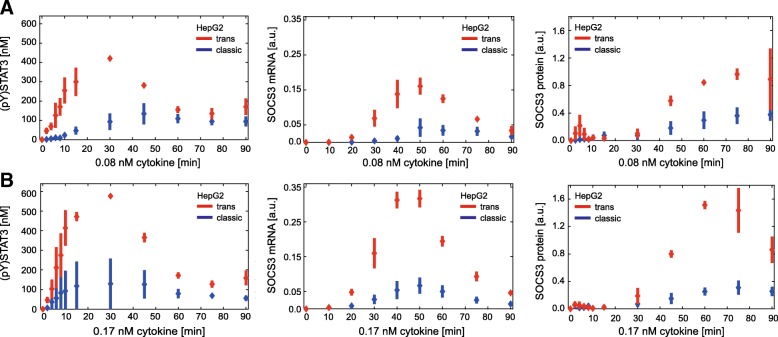
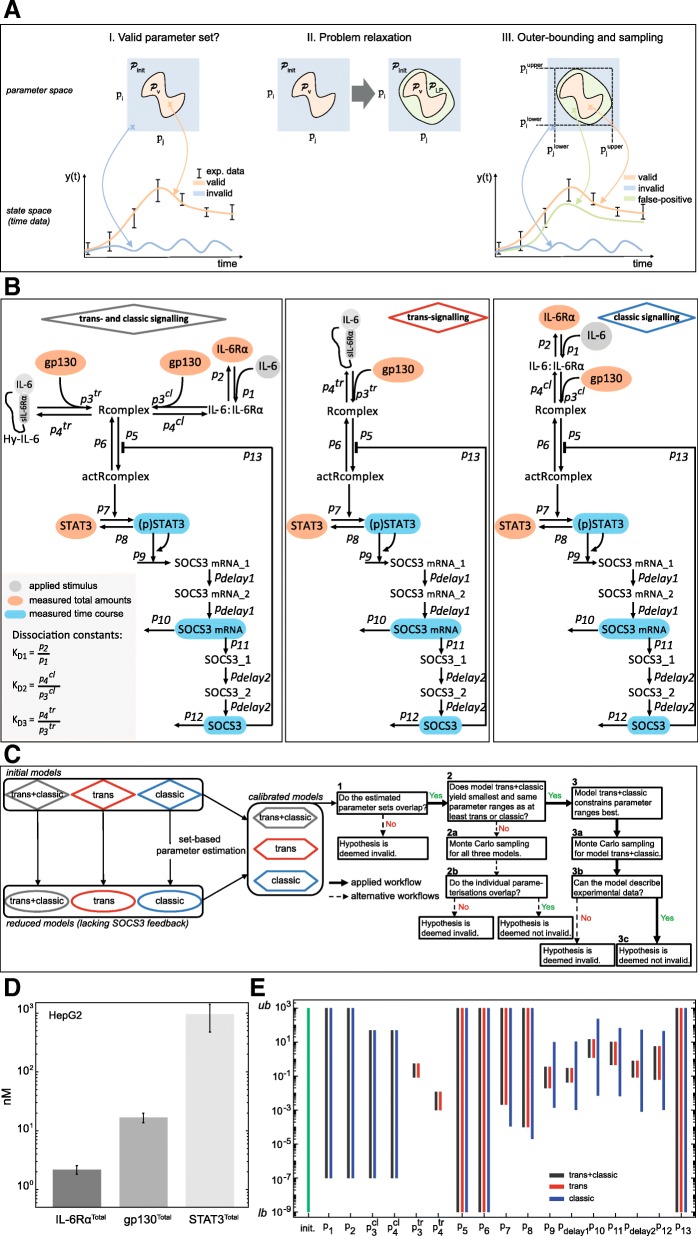
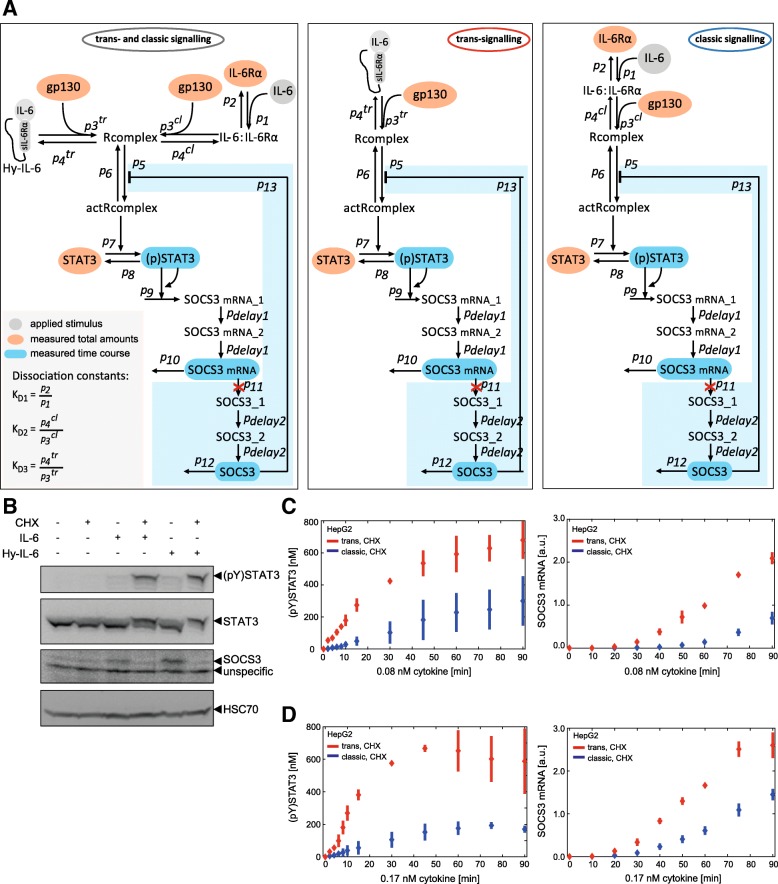
Background: Interleukin-6 is a pleiotropic cytokine with high clinical relevance and an important mediator of cellular communication, orchestrating both pro- and anti-inflammatory processes. Interleukin-6-induced signalling is initiated by binding of IL-6 to the IL-6 receptor α and subsequent binding to the signal transducing receptor subunit gp130. This active receptor complex initiates signalling through the Janus kinase/signal transducer and activator of transcription pathway. Of note, IL-6 receptor α exists in a soluble and a transmembrane form. Binding of IL-6 to membrane-bound IL-6 receptor α induces anti-inflammatory classic signalling, whereas binding of IL-6 to soluble IL-6 receptor α induces pro-inflammatory trans-signalling. Trans-signalling has been described to be markedly stronger than classic signalling. Understanding the molecular mechanisms that drive differences between trans- and classic signalling is important for the design of trans-signalling-specific therapies. These differences will be addressed here using a combination of dynamic mathematical modelling and molecular biology.

Methods: We apply an iterative systems biology approach using set-based modelling and validation approaches combined with quantitative biochemical and cell biological analyses.

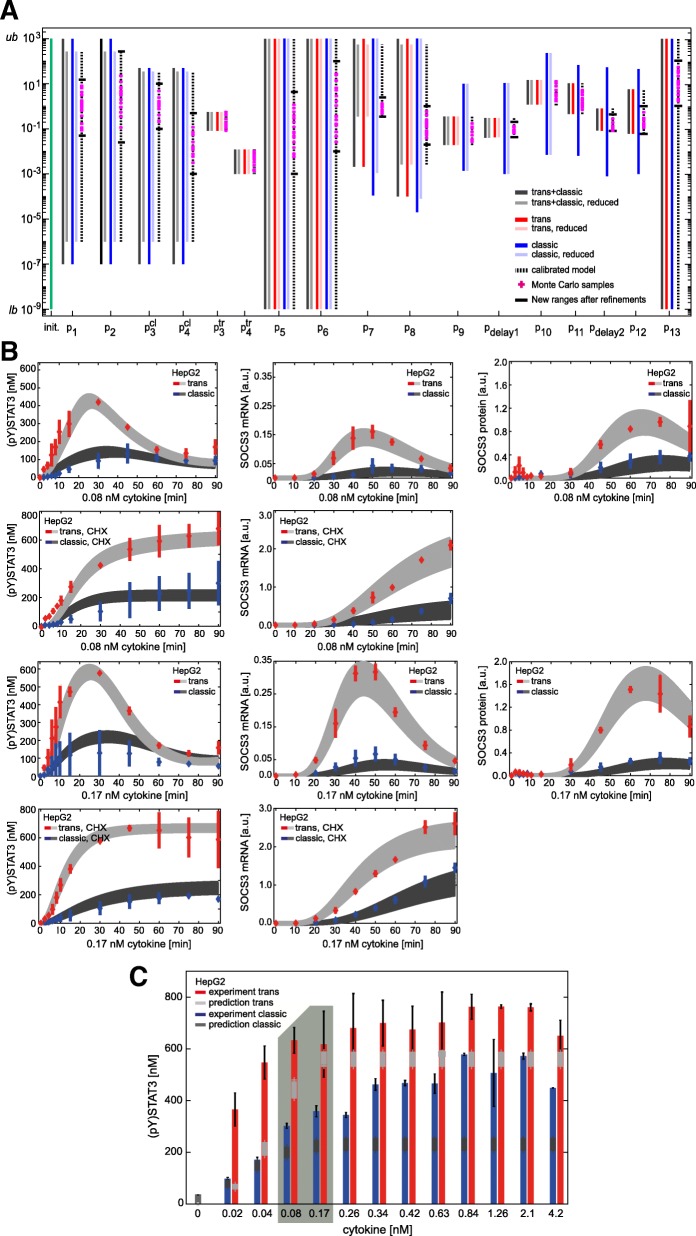
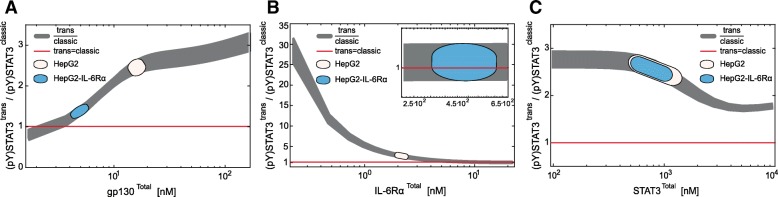
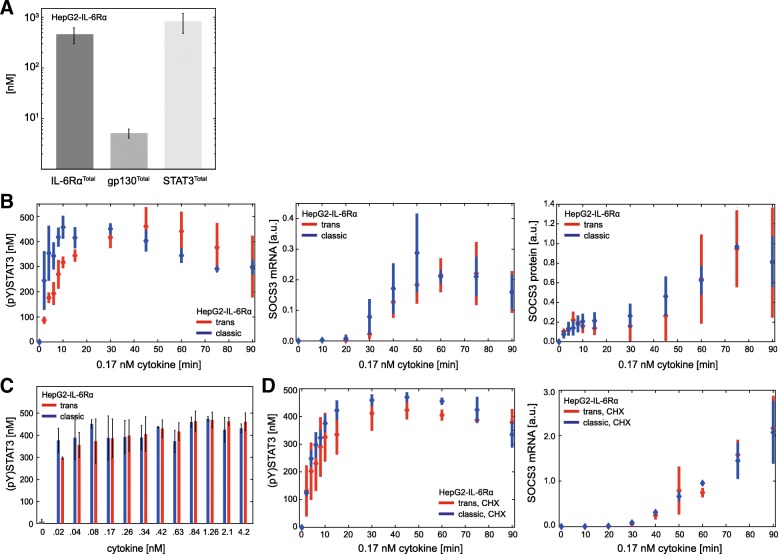
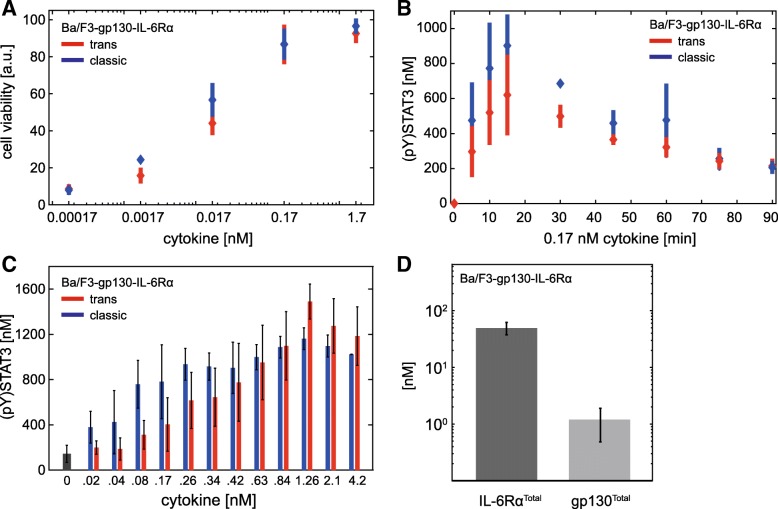
Results: The combination of experimental analyses and dynamic modelling allows to relate the observed differences between IL-6-induced trans- and classic signalling to cell-type specific differences in the expression and ratios of the individual subunits of the IL-6 receptor complex. Canonical intracellular Jak/STAT signalling is indifferent in IL-6-induced trans- and classic signalling.

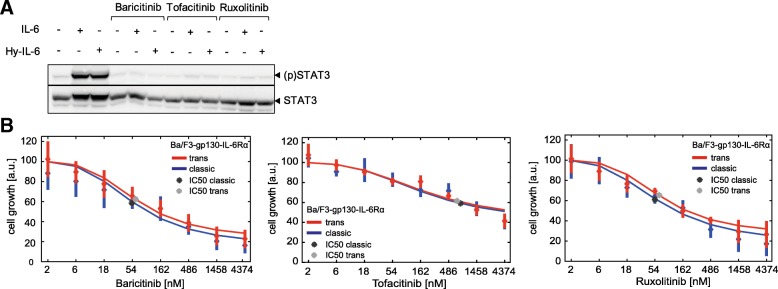
Conclusion: This study contributes to the understanding of molecular mechanisms of IL-6 signal transduction and underlines the power of combined dynamical modelling, model-based validation and biological experiments. The opposing pro- and anti-inflammatory responses initiated by IL-6 trans- and classic signalling depend solely on the expression ratios of the subunits of the entire receptor complex. By pointing out the importance of the receptor expression ratio for the strength of IL-6 signalling this study lays a foundation for future precision medicine approaches that aim to selectively block pro-inflammatory trans-signalling. Furthermore, the derived models can be used for future therapy design.

Keywords: Classic signalling; Computational dynamic modelling; IL-6; IL-6 receptor α; Inflammation; Interleukin-6; Jak/STAT signalling; Set-based modelling and analysis; Signal transduction; Systems biology; Trans-signalling; gp130.


Conflict of interest statement

The authors declare that they have no competing interests.

Figures

Fig. 1
Fig. 1
In HepG2 cells trans-signalling is stronger than classic signalling. HepG2 cells were stimulated with 0.08 nM (a) or 0.17 nM (b) IL-6 (blue) or Hy-IL-6 (red). STAT3 phosphorylation and expression of STAT3 protein, SOCS3 protein, and HSC70 protein were evaluated by Western blotting. Expression of STAT3 and HSC70 served as loading control. The expression of SOCS3 mRNA was analysed using qRT-PCR. Diamonds correspond to the mean and bars to the standard deviation of n = 3–4 experiments. Data normalization was performed as described in Additional file 1: Text S3
Fig. 2
Fig. 2
Set-based modelling, network topologies, workflow diagram and parameter estimation results. a I): To calculate model trajectories that describe experimental data, valid parameters (orange cross and trajectory) have to be distinguished from invalid ones (blue cross and trajectory). The orange area describes a set Pv of valid parameters that represent data. Due to non-convexity of Pv, relaxations are performed obtaining a linear program (LP). II) Relaxations result in the set PLP that covers Pv, but introduce also false positive solutions (green area). III) Due to relaxations, the introduced false parameter sets give model trajectories that are inconsistent with the data (green cross and trajectory). However, it is guaranteed that the valid solution set is always included. As consequence, a model is deemed invalid, whenever PLP and thus, Pv are empty. We apply an outer-bounding algorithm to approximate PLP (black dotted rectangle). b Initial models describing trans- and classic signalling, trans-signalling only and classic signalling only. Classic signalling is induced by binding of IL-6 to IL-6Rα. The complex associates with gp130. Trans-signalling is induced by binding of Hy-IL-6 to gp130. In both cases the active receptor complex initiates Jak/STAT signalling and SOCS3 expression. c Workflow for set-based parameter estimation and (non-)invalidity test. Black bold arrows depict the applied workflow, while dotted arrows show alternative workflows. d Expression of gp130 and IL-6Rα in HepG2 cells was quantified by flow cytometry using QIFIKIT. Mean ± STD values from n = 4 independent experiments are shown. Expression of STAT3 in HepG2 cells was quantified by Western blotting using recombinant calibrator proteins. Mean ± STD values from n = 7 independent experiments are shown. e Results for outer-bounding of model parameters. Initial parameter bounds (green bar) range from 10− 9 (lower bound, lb) to 103 (upper bound, ub). Dark grey, blue and red bars depict ranges for parameters after set estimation of the models
Fig. 3
Fig. 3
Network topologies of the reduced models and additional experimental data for improving model calibration. a Network topology of the reduced ODE models disregarding SOCS3 protein expression (red crosses) and negative feedback by SOCS3. The light blue boxes depict the network parts which are disregarded in the reduced models by setting the corresponding parameter values to zero. b HepG2 cells were pretreated with or without cycloheximide for 30 min and subsequently stimulated with IL-6 (0.42 nM) and Hy-IL-6 (0.17 nM), respectively. STAT3 phosphorylation and STAT3, SOCS3, and HSC70 protein expression were evaluated by Western blotting. STAT3 and HSC70 expression served as loading control. Representative results of n = 3 independent experiments are shown. HepG2 cells were pretreated with cycloheximide for 30 min and subsequently stimulated with 0.08 nM (c) or 0.17 nM (d) IL-6 (blue) and Hy-IL-6 (red). STAT3 phosphorylation and expression of STAT3 protein were evaluated by Western blotting. Expression of STAT3 served as loading control. The expression of SOCS3 mRNA was analysed using qRT-PCR. Diamonds correspond to the mean and bars to the STD of n = 3 experiments. Data normalization was performed as described in Additional file 1: Text S3
Fig. 4
Fig. 4
Improved parameterisation and refinement of set-based parameter estimation, based on Monte Carlo sampling. a Results for outer-bounding of model parameters. Initial parameter bounds (green bar) range from 10− 9 (lower bound, lb) to 103 (upper bound, ub). Dark grey, blue and red bars depict parameter ranges for the individual parameters after set-based analyses of the initial models. Light grey, light blue and light red bars depict parameter ranges after parameter estimation of the reduced models disregarding the SOCS3-mediated feedback. Dotted bars show final set-based estimation results for the calibrated model. Magenta plus signs depict exemplary valid Monte Carlo samples and black horizontal lines show the newly obtained parameter ranges after model refinements. b 150 out of 150,000 Monte Carlo samples that yield the lowest quadratic distance between model predictions and experimental data and reasonable represent all experimental data available. Model outputs (light and dark grey corridors) were plotted against experimental data (red and blue) presented in Figs. 1 and 4. c Model predictions for dose-dependent phosphorylation of STAT3 in response to 30 min classic (dark grey) and trans-signalling (light grey) based on the 150 Monte Carlo samples from (A). HepG2 cells were stimulated with indicated amounts of IL-6 (blue bars) or Hy-IL-6 (red bars). STAT3 phosphorylation was evaluated by intracellular flow cytometry using specific fluorescent antibodies against STAT3 (p)Y705. For independent experiments mean fluorescence of 104 cells per cytokine concentration was calculated. Data are given as mean ± STD from n = 3 experiments. The grey box depicts experimental conditions used in Fig. 1 (stimulation with 0.08 nM and 0.17 nM cytokine for 30 min)
Fig. 5
Fig. 5
Ratio of IL-6Rα to gp130 expression on the cell surface determines strength of trans- and classic signalling. Model-based prediction of the ratio of trans- to classic signalling-induced STAT3 phosphorylation after 30 min stimulation with IL-6 and Hy-IL-6 (0.17 nM). a Expression of gp130 was predefined to range between 1.68 nM and 168 nM while expression of IL-6RαTotal (2.2 nM) and STAT3Total (958 nM) were fixed. b Expression of IL-6Rα was predefined to range between 0.22 nM and 22.2 nM while expression of gp130Total (16.8 nM) and STAT3Total (958 nM) were fixed. c Expression of STAT3 was predefined to range between 95.8 nM and 9580 nM while expression of gp130Total (16.8 nM) and IL-6RαTotal (2.2 nM) were fixed. Grey corridors correspond to model predictions. Red line depicts equal strength of trans- and classic signalling. The white areas represent the range of gp130 (A), IL-6Rα (B) and STAT3 (C) expression in HepG2 cells, respectively. The blue areas represent the range of gp130 (A), IL-6Rα (B) and STAT3 (C) expression in HepG2-IL-6Rα cells, respectively
Fig. 6
Fig. 6
High IL-6Rα/gp130 receptor ratio in HepG2-IL-6Rα cells ablates difference between trans- and classic signalling. a Expression of gp130 and IL-6Rα on the surface of HepG2-IL-6Rα cells was quantified by flow cytometry using QIFIKIT. Mean ± STD values from n = 4 independent experiments are shown. Expression of STAT3 in HepG2-IL-6Rα cells was quantified by Western blotting using recombinant calibrator proteins. Mean ± STD values from n = 7 independent experiments are shown. b HepG2-IL-6Rα cells were stimulated with IL-6 (blue) and Hy-IL-6 (red) (0.17 nM). STAT3 phosphorylation and expression of STAT3, SOCS3, and HSC70 protein were evaluated by Western blotting. Expression of STAT3 and HSC70 served as loading control. The expression of SOCS3 mRNA was analysed using qRT-PCR. Diamonds correspond to the mean and bars to the STD of n = 4 experiments. Data normalization was performed as described in Additional file 1: Text S3. c HepG2-IL-6Rα cells were stimulated with indicated amounts of IL-6 (blue bars) or Hy-IL-6 (red bars). STAT3 phosphorylation was evaluated by intracellular flow cytometry using specific fluorescent antibodies against STAT3 (p)Y705. For independent experiments mean fluorescence of 104 cells per cytokine concentration was calculated. Data are given as mean ± STD from n = 3 experiments. d HepG2-IL-6Rα cells were pretreated with cycloheximide for 30 min and subsequently stimulated with 0.17 nM IL-6 (blue) and Hy-IL-6 (red), respectively. STAT3 phosphorylation and STAT3 expression were evaluated by Western blotting. STAT3 expression served as loading control. The expression of SOCS3 mRNA was analysed using qRT-PCR. Diamonds correspond to the mean and bars to the standard deviation for n = 3 independent experiments. Data normalization was performed as described in Additional file 1: Text S3
Fig. 7
Fig. 7
Trans- and classic signalling-induced growth of Ba/F3-gp130-IL-6Rα cells do not differ. a Ba/F3-gp130-IL-6Rα cells were stimulated with IL-6 (blue) or Hy-IL-6 (red) as indicated. After 48 h of incubation cell growth was measured using Cell Titer Blue reagent. Diamonds correspond to the mean and bars to the standard deviation for n = 4 experiments. b Ba/F3-gp130-IL-6Rα cells were stimulated with IL-6 (blue) and Hy-IL-6 (red) (0.17 nM). STAT3 phosphorylation and STAT3 expression were evaluated by Western blotting. STAT3 expression served as loading control. Diamonds correspond to the mean and bars to the standard deviation for n = 4 independent experiments. Data normalization was performed as described in Additional file 1: Text S3. c Ba/F3-gp130-IL-6Rα cells were stimulated with the indicated amounts of IL-6 (blue bars) or Hy-IL-6 (red bars), respectively. STAT3 phosphorylation was evaluated by intracellular flow cytometry using specific fluorescent antibodies against STAT3 (p)Y705. For independent experiments mean fluorescence of 104 cells per cytokine concentration was calculated. Data are given as mean ± STD from n = 3 experiments. d The expression of gp130 and IL-6Rα at the surface of Ba/F3-gp130-IL-6Rα cells was analysed by flow cytometry using QIFIKIT. Mean ± STD from n = 4 independent experiments is shown
Fig. 8
Fig. 8
Pharmacological inhibition of Jak does not discriminate between trans- and classic signalling. a Ba/F3-gp130-IL-6Rα cells were pretreated with or without the indicated inhibitors (5 μM) for 30 min and subsequently stimulated with 10 ng/ml IL-6 (0.42 nM) or Hy-IL-6 (0.17 nM). STAT3 phosphorylation and STAT3 expression were evaluated by Western blotting. STAT3 expression served as loading control. Representative results of n = 3 independent experiments are shown. b Ba/F3-gp130-IL-6Rα cells were incubated with IL-6 (0.42 pM) or Hy-IL-6 (0.52 pM) with the indicated concentrations of the corresponding inhibitors for 48 h. Cell growth was measured using Cell Titer Blue reagent. Diamonds correspond to the mean and bars to the STD of n = 3 experiments. Red and blue lines indicate a maximum likelihood 4 parameter logistic regression. The determined IC50 values are given as dark stars for classic signalling and light grey stars for trans-signalling

References

    1. Schaper F, Rose-John S. Interleukin-6: biology, signaling and strategies of blockade. Cytokine Growth Factor Rev. 2015;26:475–487. doi: 10.1016/j.cytogfr.2015.07.004. - DOI - PubMed
    1. Andus T, Geiger T, Hirano T, Kishimoto T, Tran-Thi TA, Decker K, Heinrich PC. Regulation of synthesis and secretion of major rat acute-phase proteins by recombinant human interleukin-6 (BSF-2/IL-6) in hepatocyte primary cultures. Eur J Biochem. 1988;173:287–293. doi: 10.1111/j.1432-1033.1988.tb13997.x. - DOI - PubMed
    1. Hunter CA, Jones SA. IL-6 as a keystone cytokine in health and disease. Nat Immunol. 2015;16:448–457. doi: 10.1038/ni.3153. - DOI - PubMed
    1. Rose-John S, Mitsuyama K, Matsumoto S, Thaiss WM, Scheller J. Interleukin-6 trans-signaling and colonic cancer associated with inflammatory bowel disease. Curr Pharm Des. 2009;15:2095–2103. doi: 10.2174/138161209788489140. - DOI - PubMed
    1. Heinrich PC, Behrmann I, Haan S, Hermanns HM, Müller-Newen G, Schaper F. Principles of interleukin (IL)-6-type cytokine signalling and its regulation. Biochem J. 2003;374:1–20. doi: 10.1042/bj20030407. - DOI - PMC - PubMed

Publication types

LinkOut - more resources