Clinical Trial
. 2019 Sep;74(3):328-337.
doi: 10.1053/j.ajkd.2019.03.417. Epub 2019 May 14.

Safety and Effectiveness of Bexagliflozin in Patients With Type 2 Diabetes Mellitus and Stage 3a/3b CKD

Affiliations
Clinical Trial

Safety and Effectiveness of Bexagliflozin in Patients With Type 2 Diabetes Mellitus and Stage 3a/3b CKD

Andrew S Allegretti et al. Am J Kidney Dis. 2019 Sep.

Abstract

Rationale & objective: Hyperglycemia exacerbates the progression of chronic kidney disease (CKD), but most glucose-lowering therapies do not address morbidities associated with CKD. Sodium/glucose cotransporter 2 (SGLT2) inhibitors offer potential benefits to patients with diabetes and CKD, but their effectiveness may be diminished with decreased kidney function. We aimed to evaluate the safety and effectiveness of bexagliflozin, a novel SGLT2 inhibitor, in patients with type 2 diabetes and CKD.

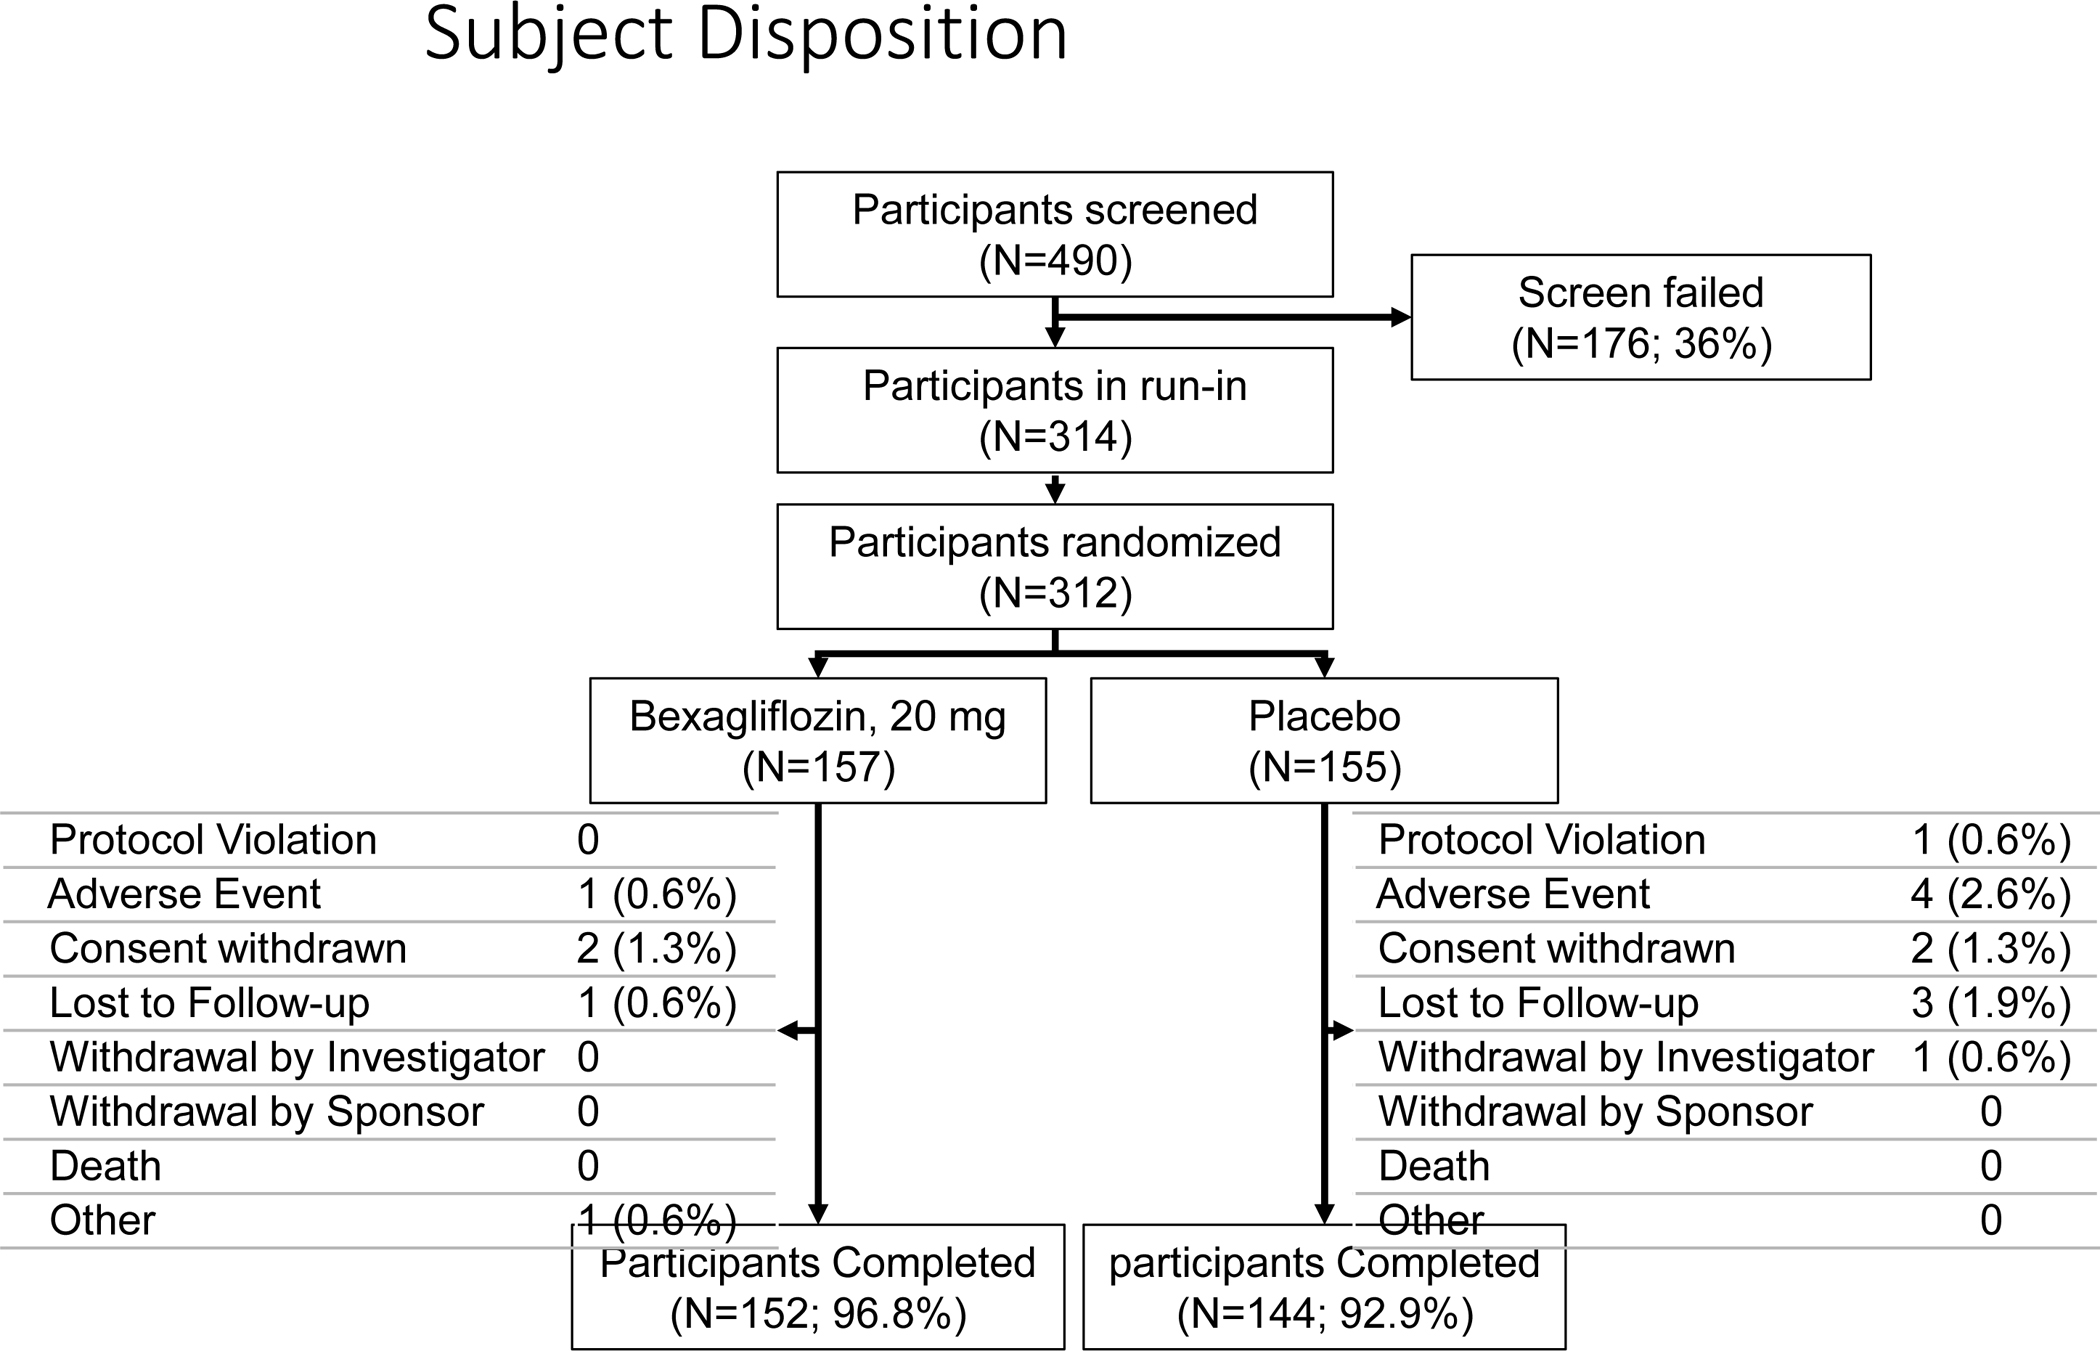
Study design: Phase 3, double-blind, placebo-controlled, multicenter, multinational, randomized trial.

Setting & participants: 54 sites across 4 countries. Patients with CKD stage 3a or 3b, type 2 diabetes mellitus, and hemoglobin A1c level of 7.0% to 10.5% and estimated glomerular filtration rate (eGFR) of 30 to 59mL/min/1.73m2 who were taking oral hypoglycemic agents for 8 weeks.

Interventions: Bexagliflozin, 20mg, daily versus placebo for 24 weeks.

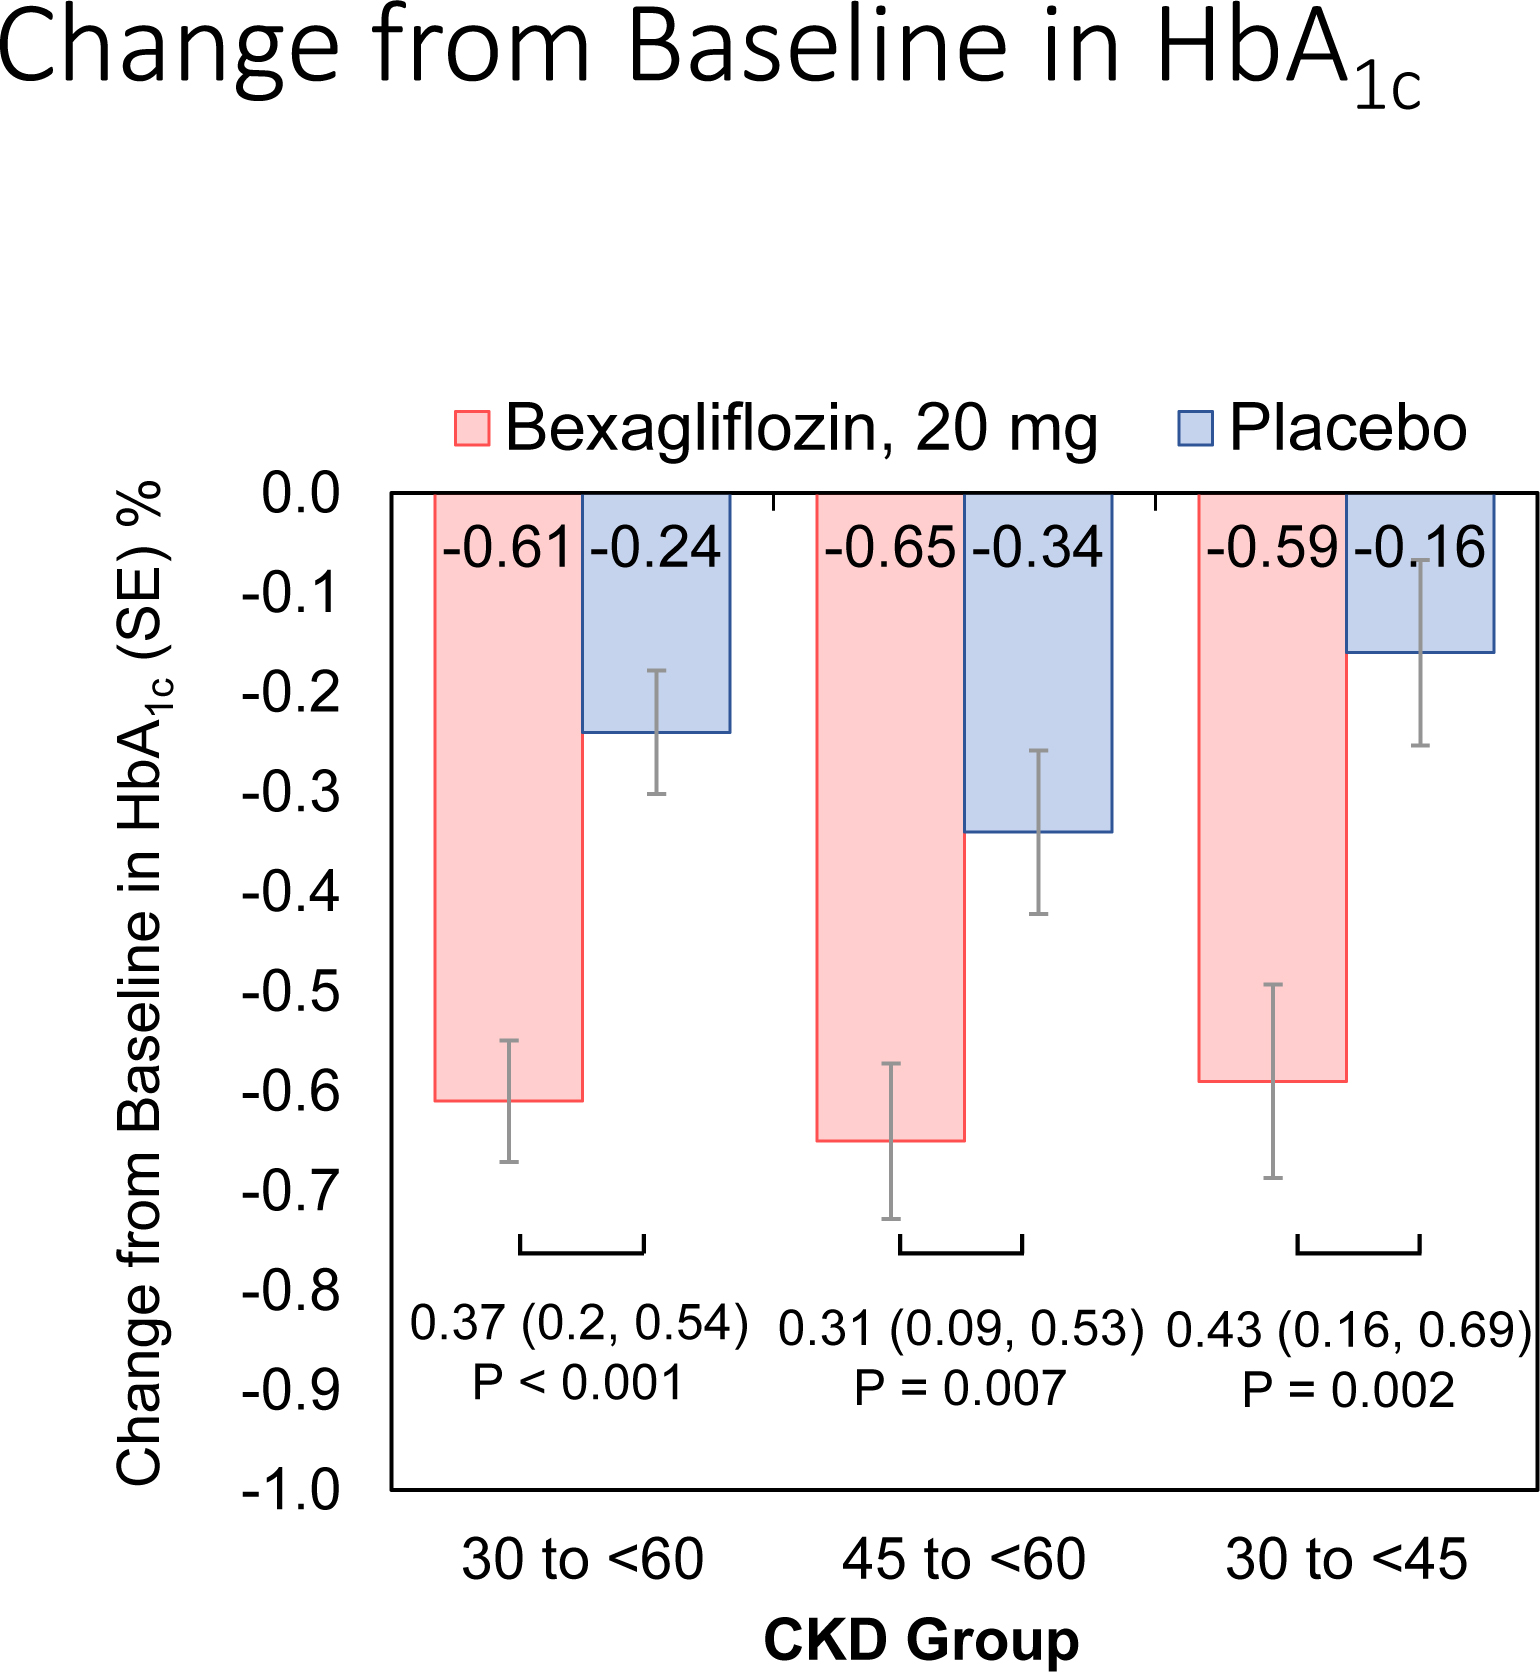
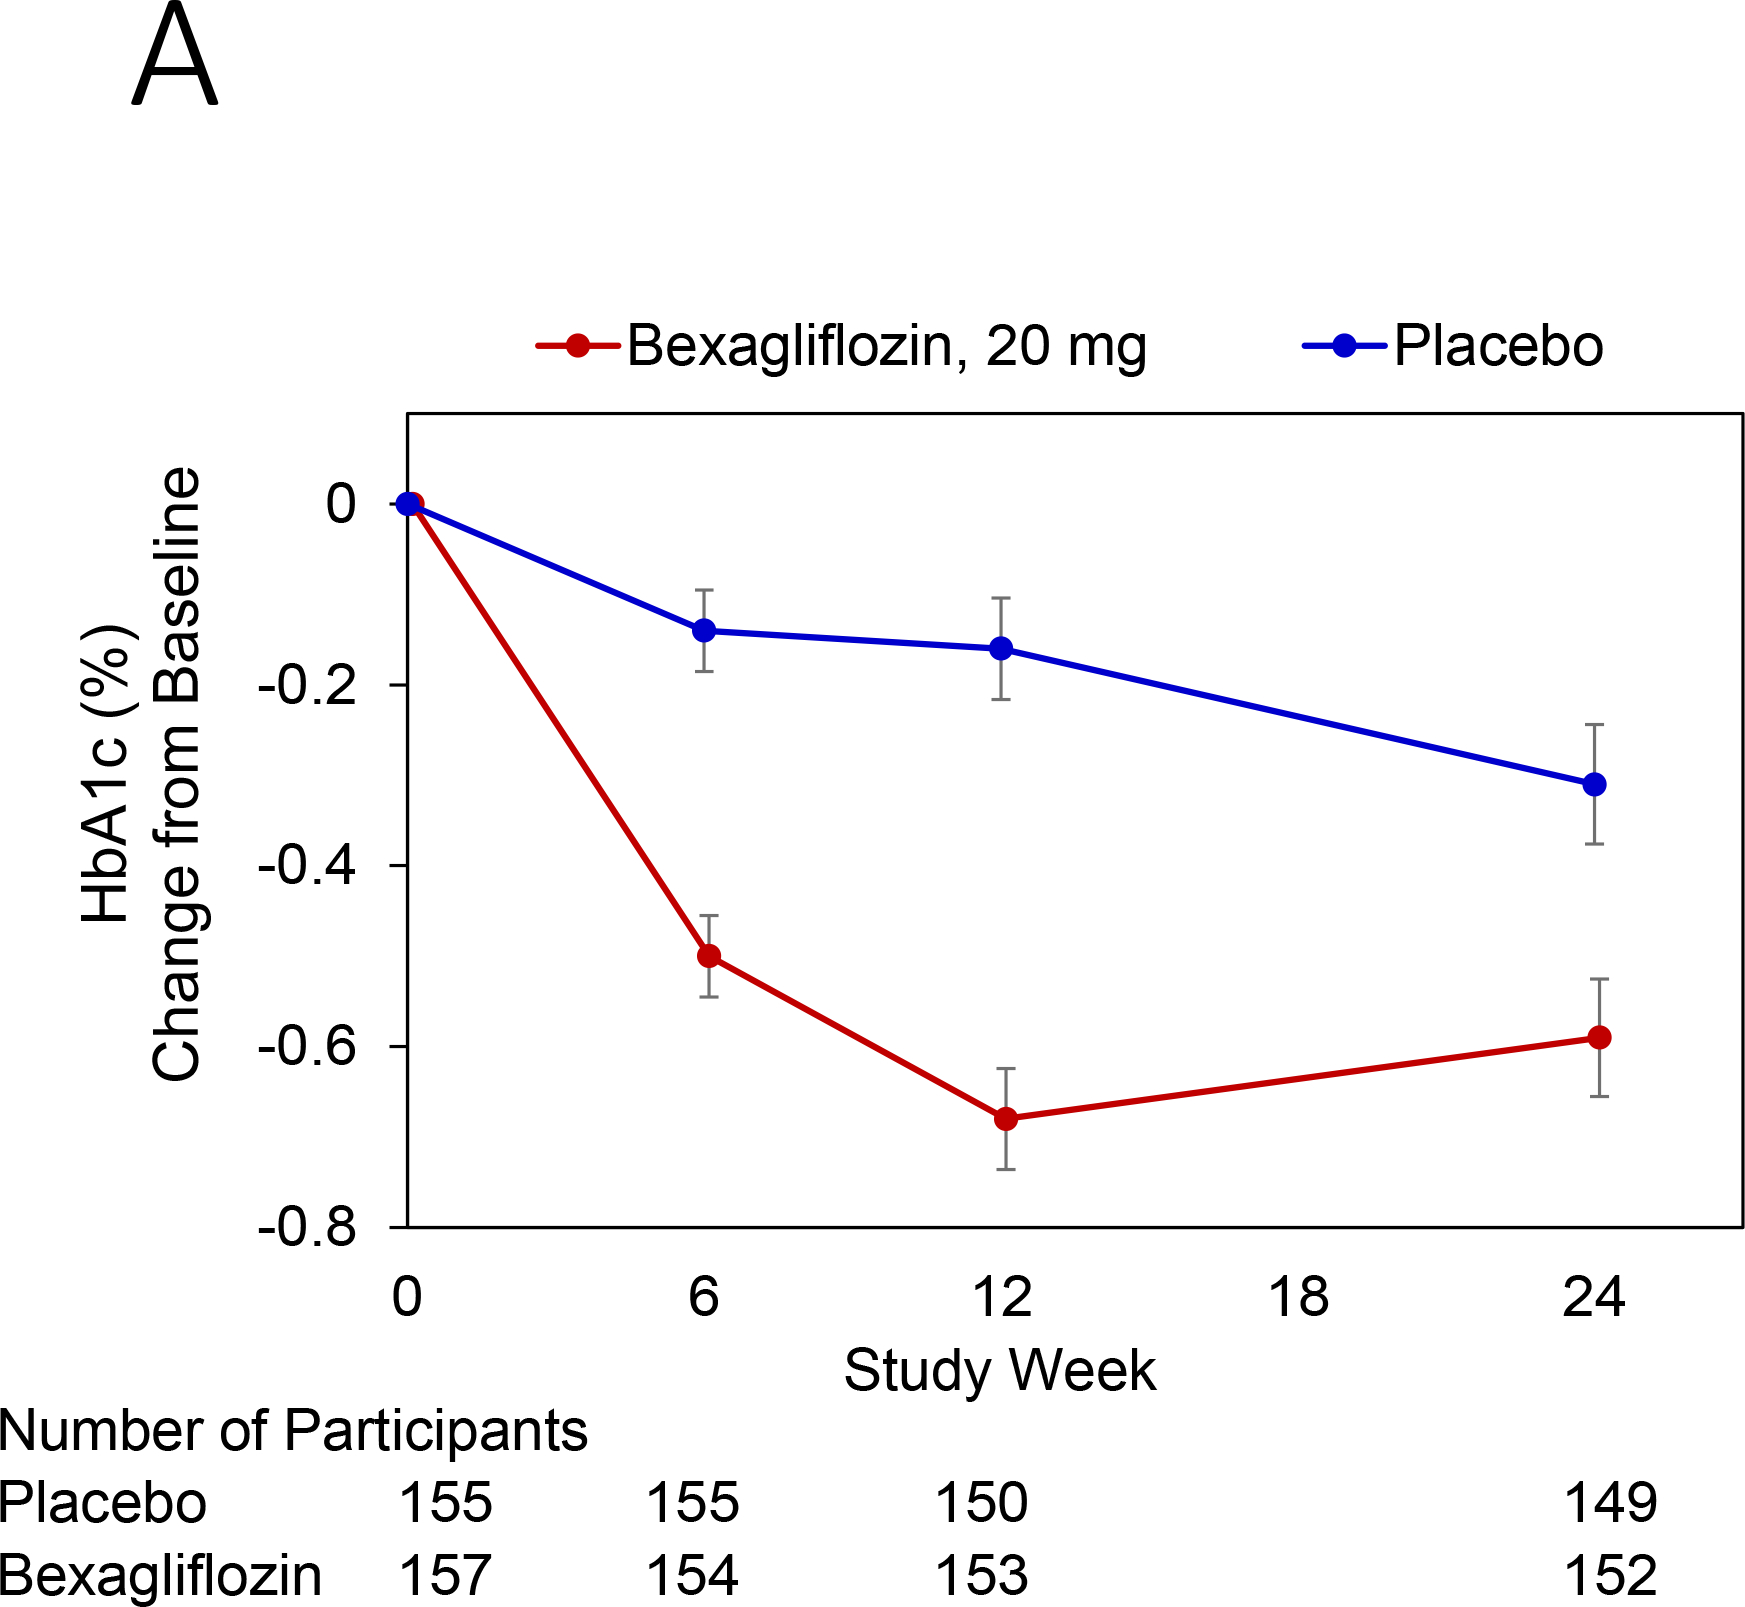
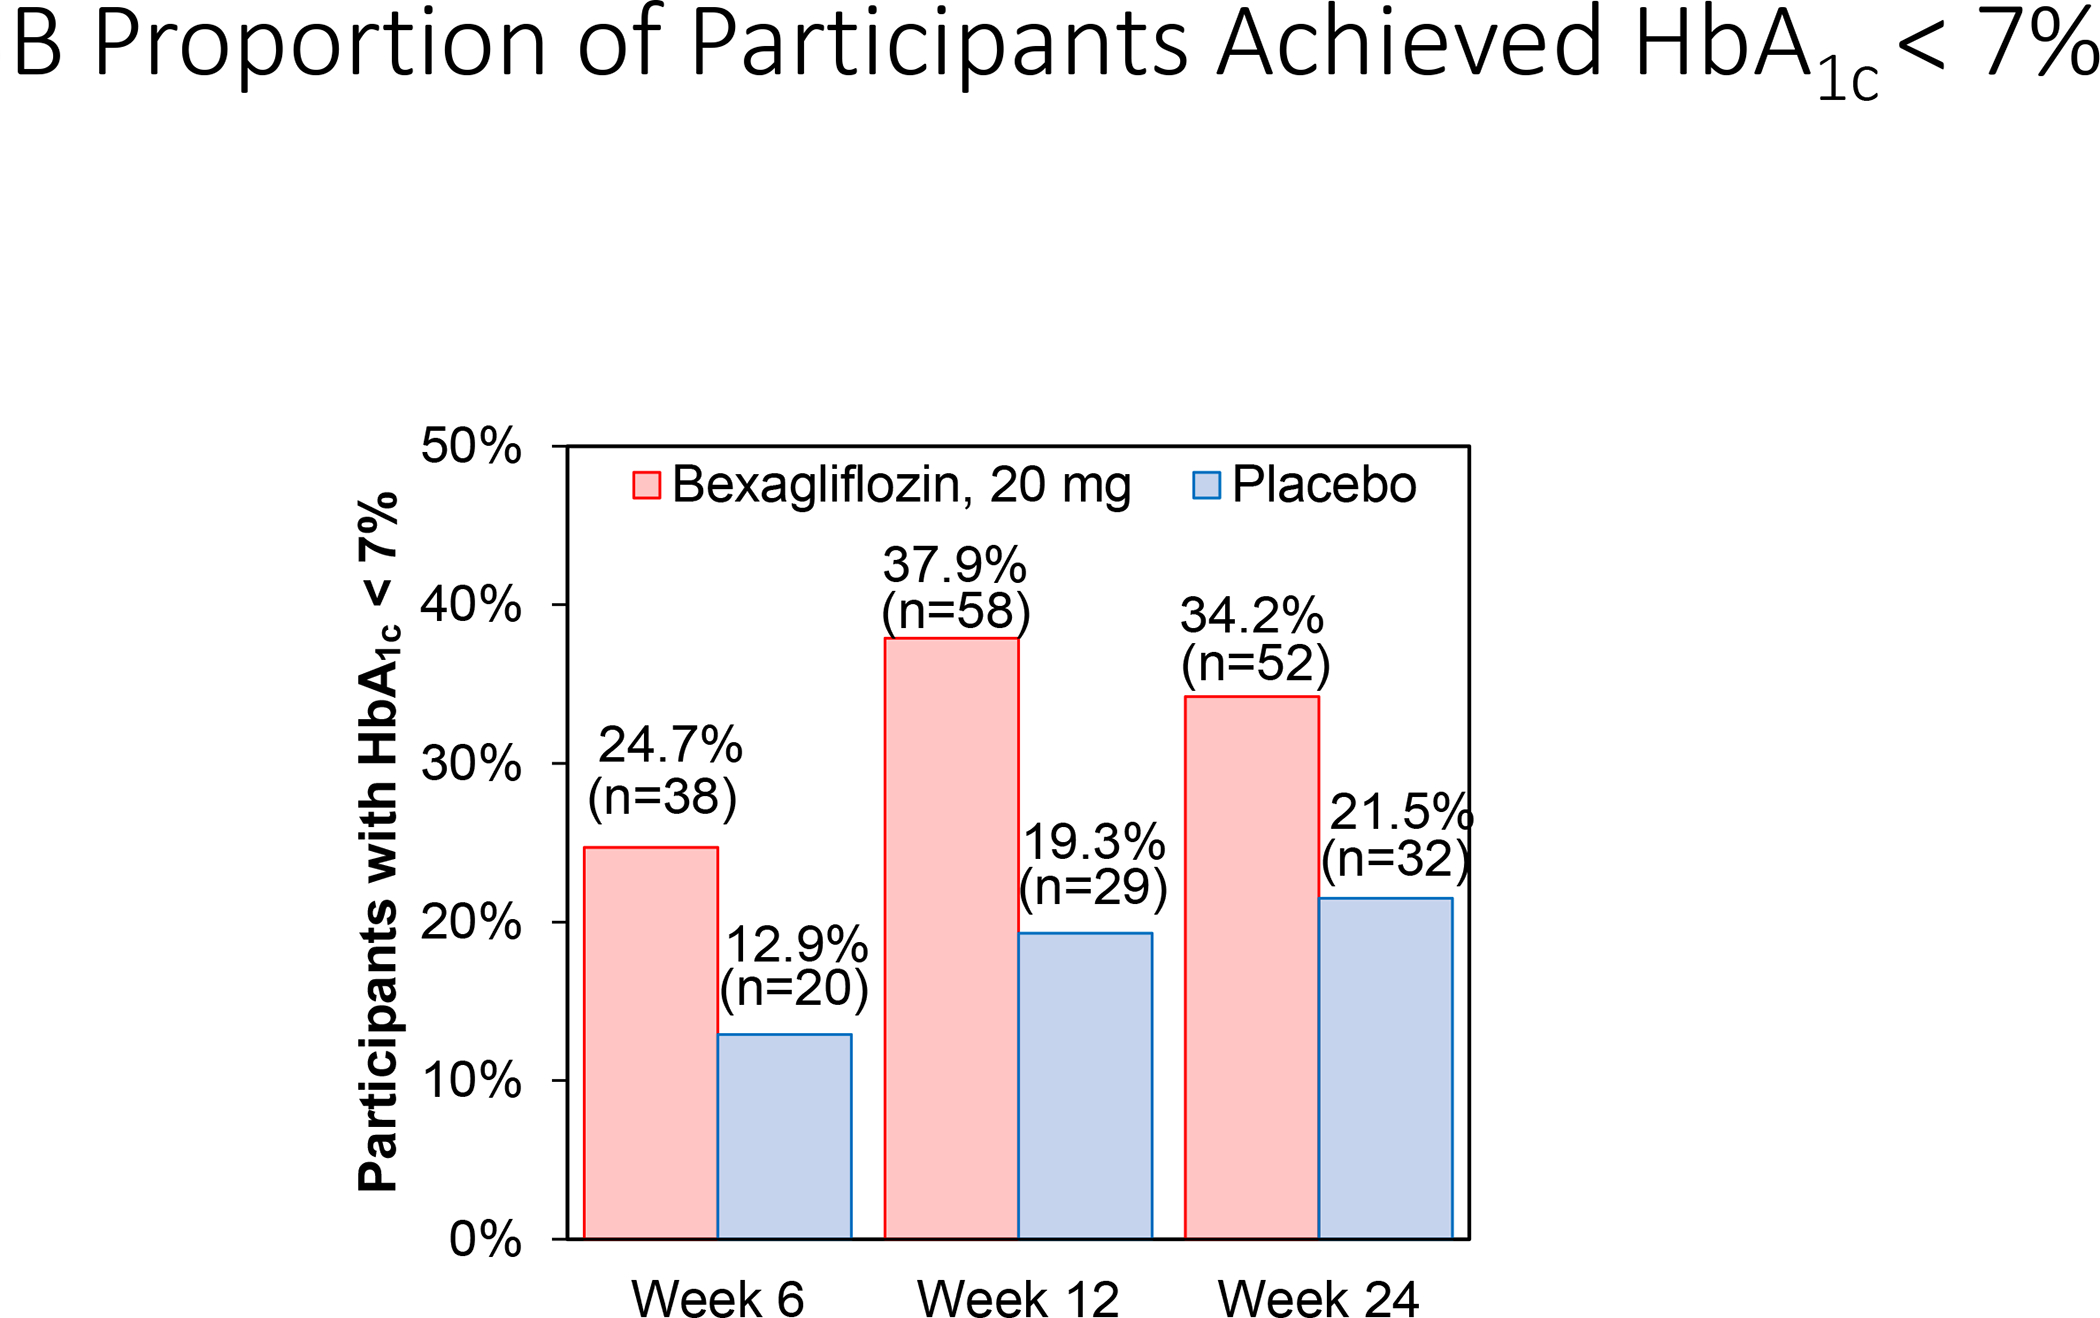
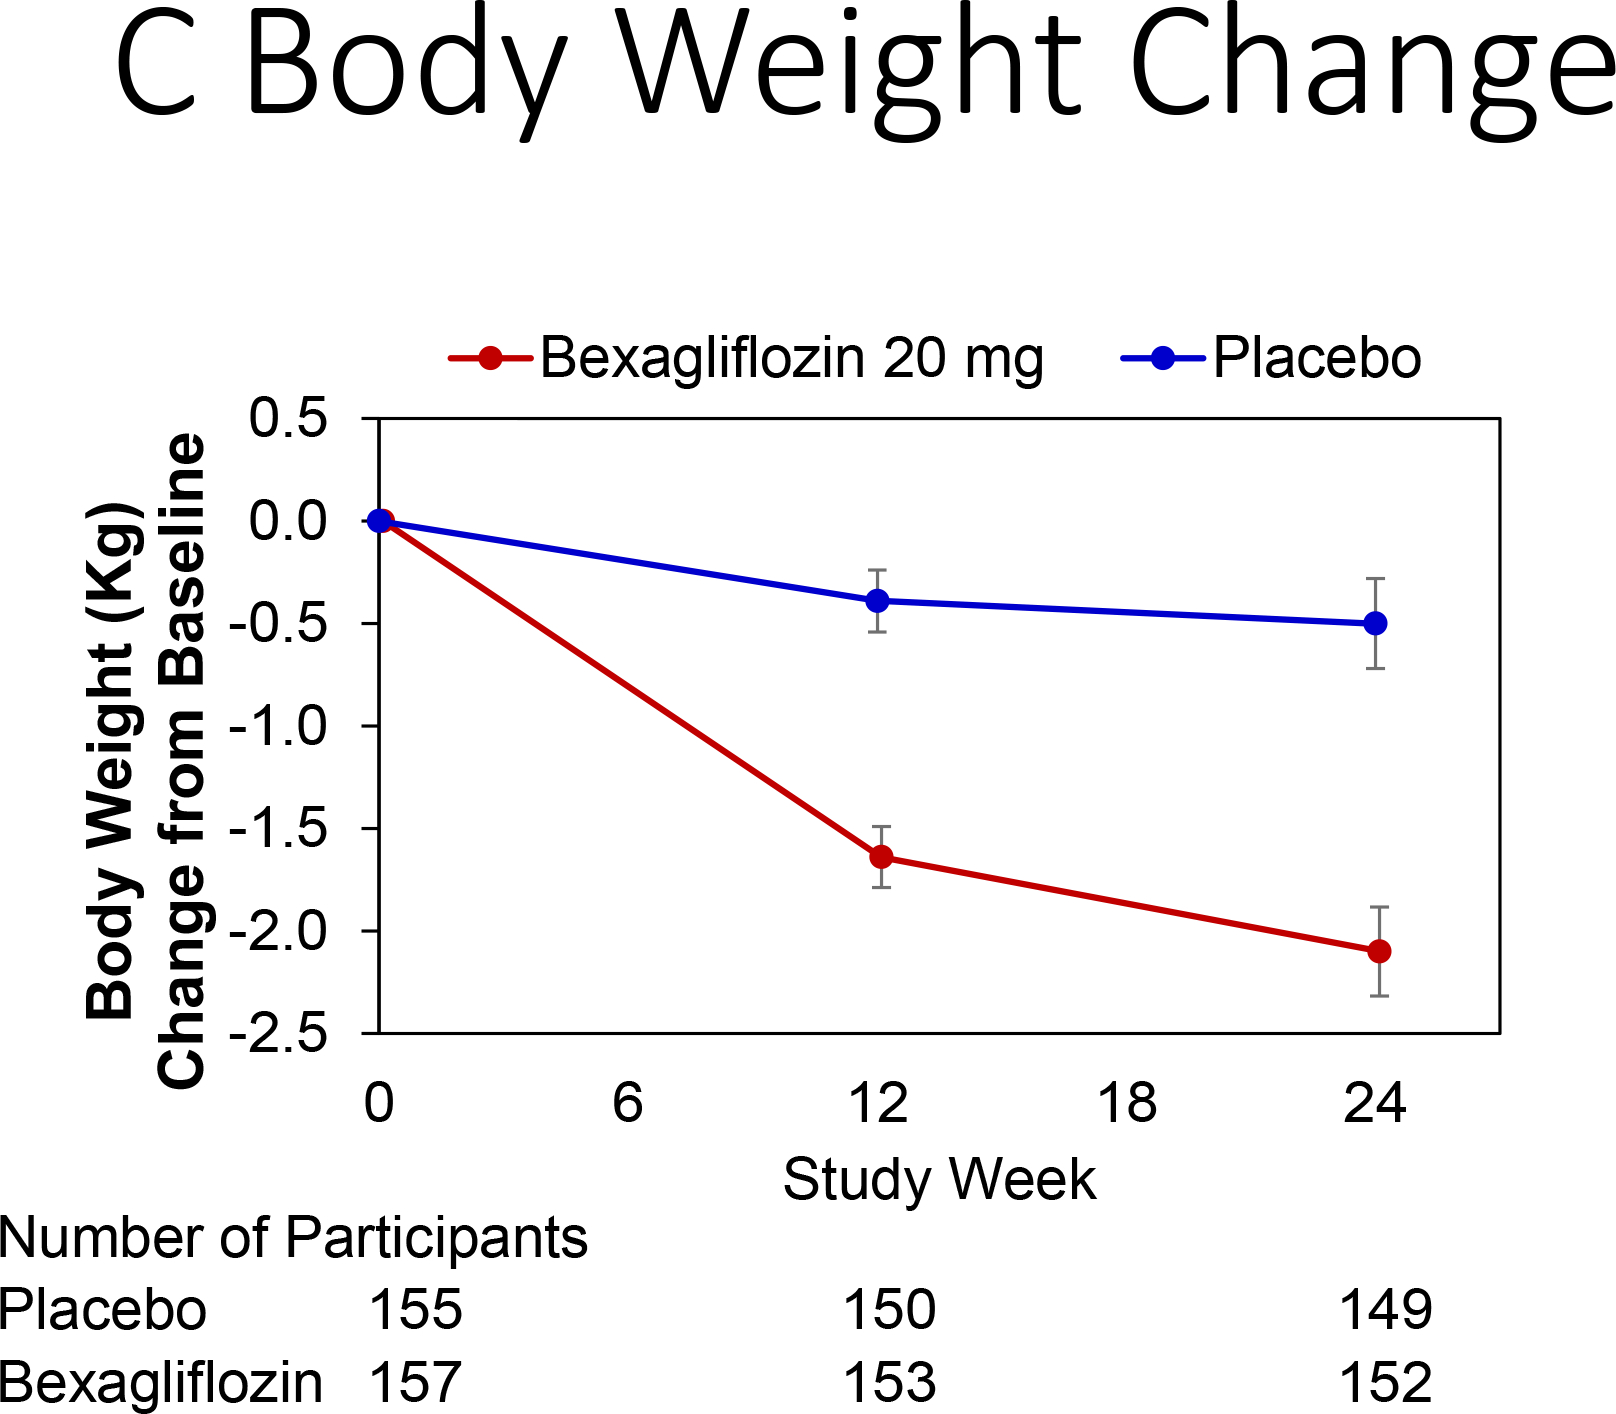
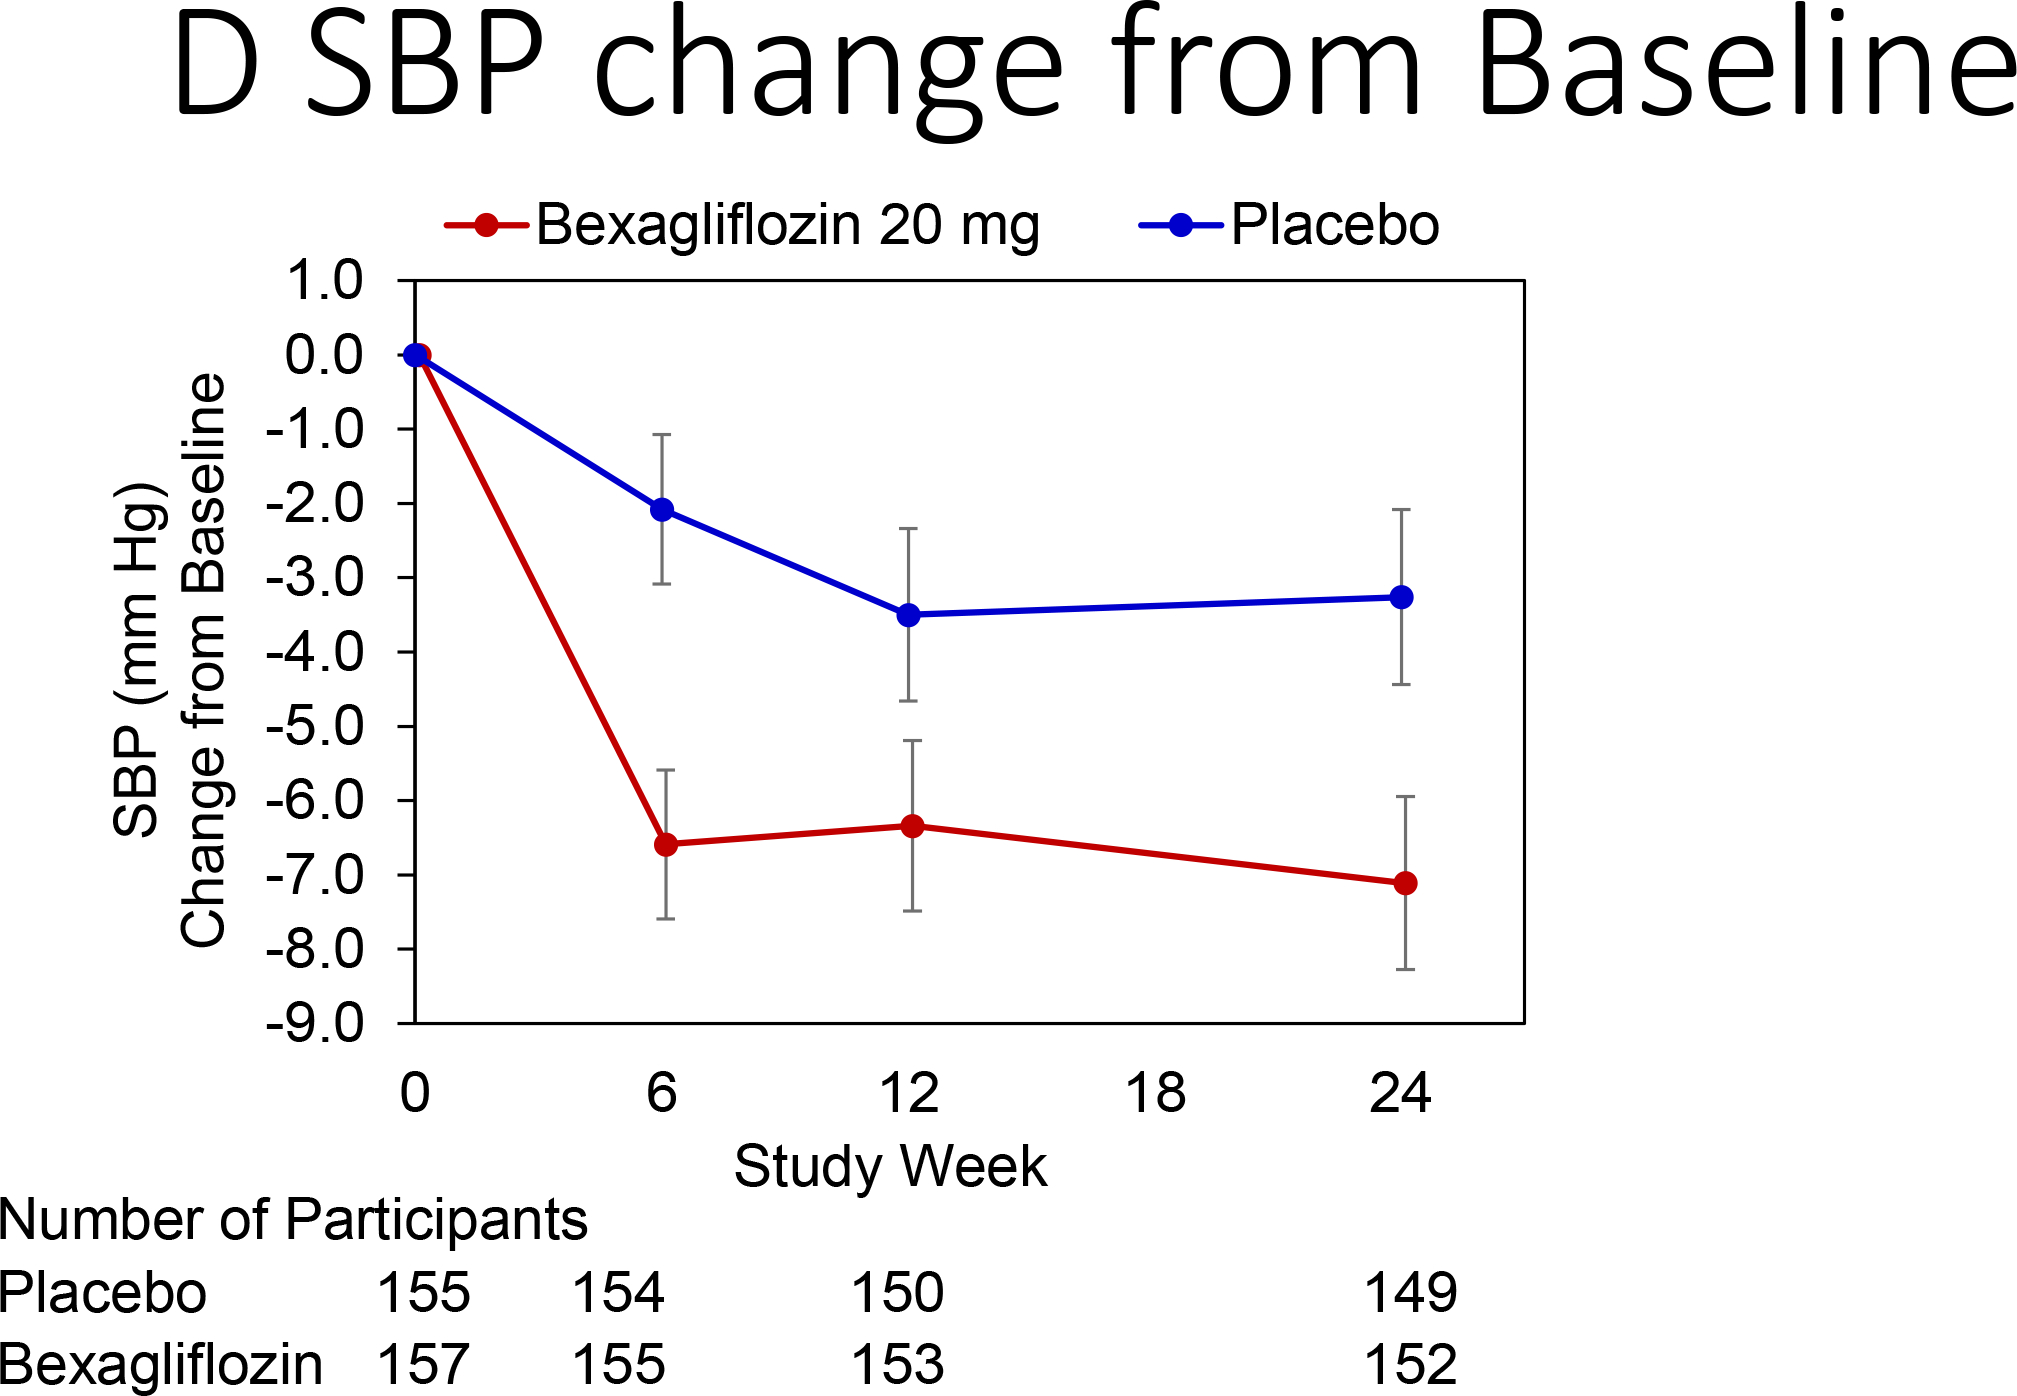
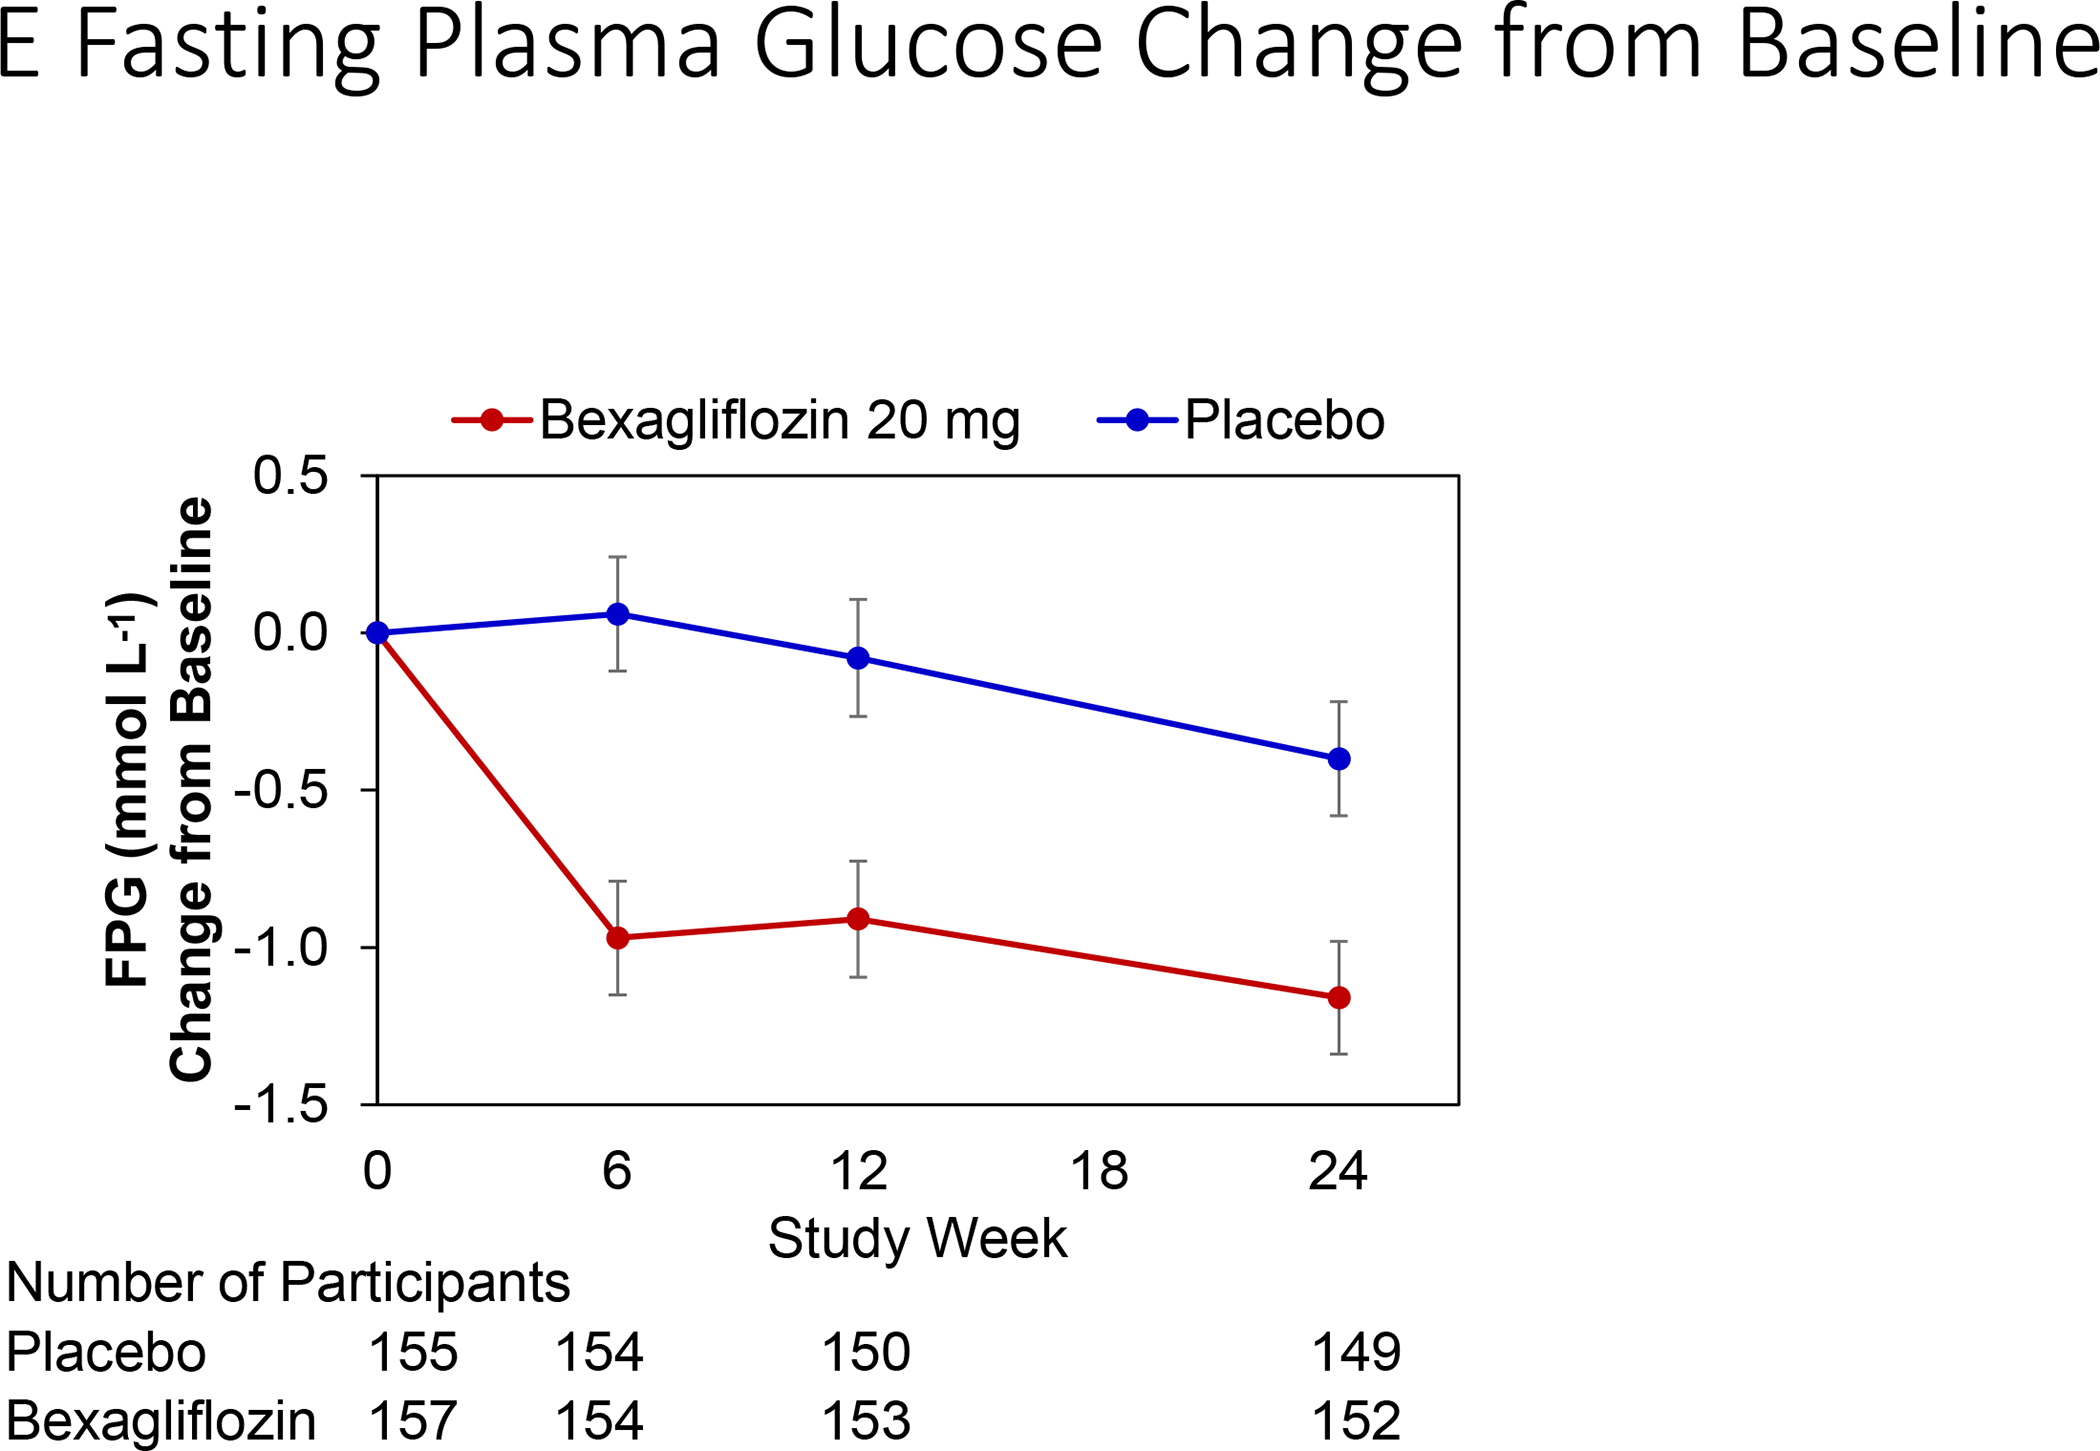
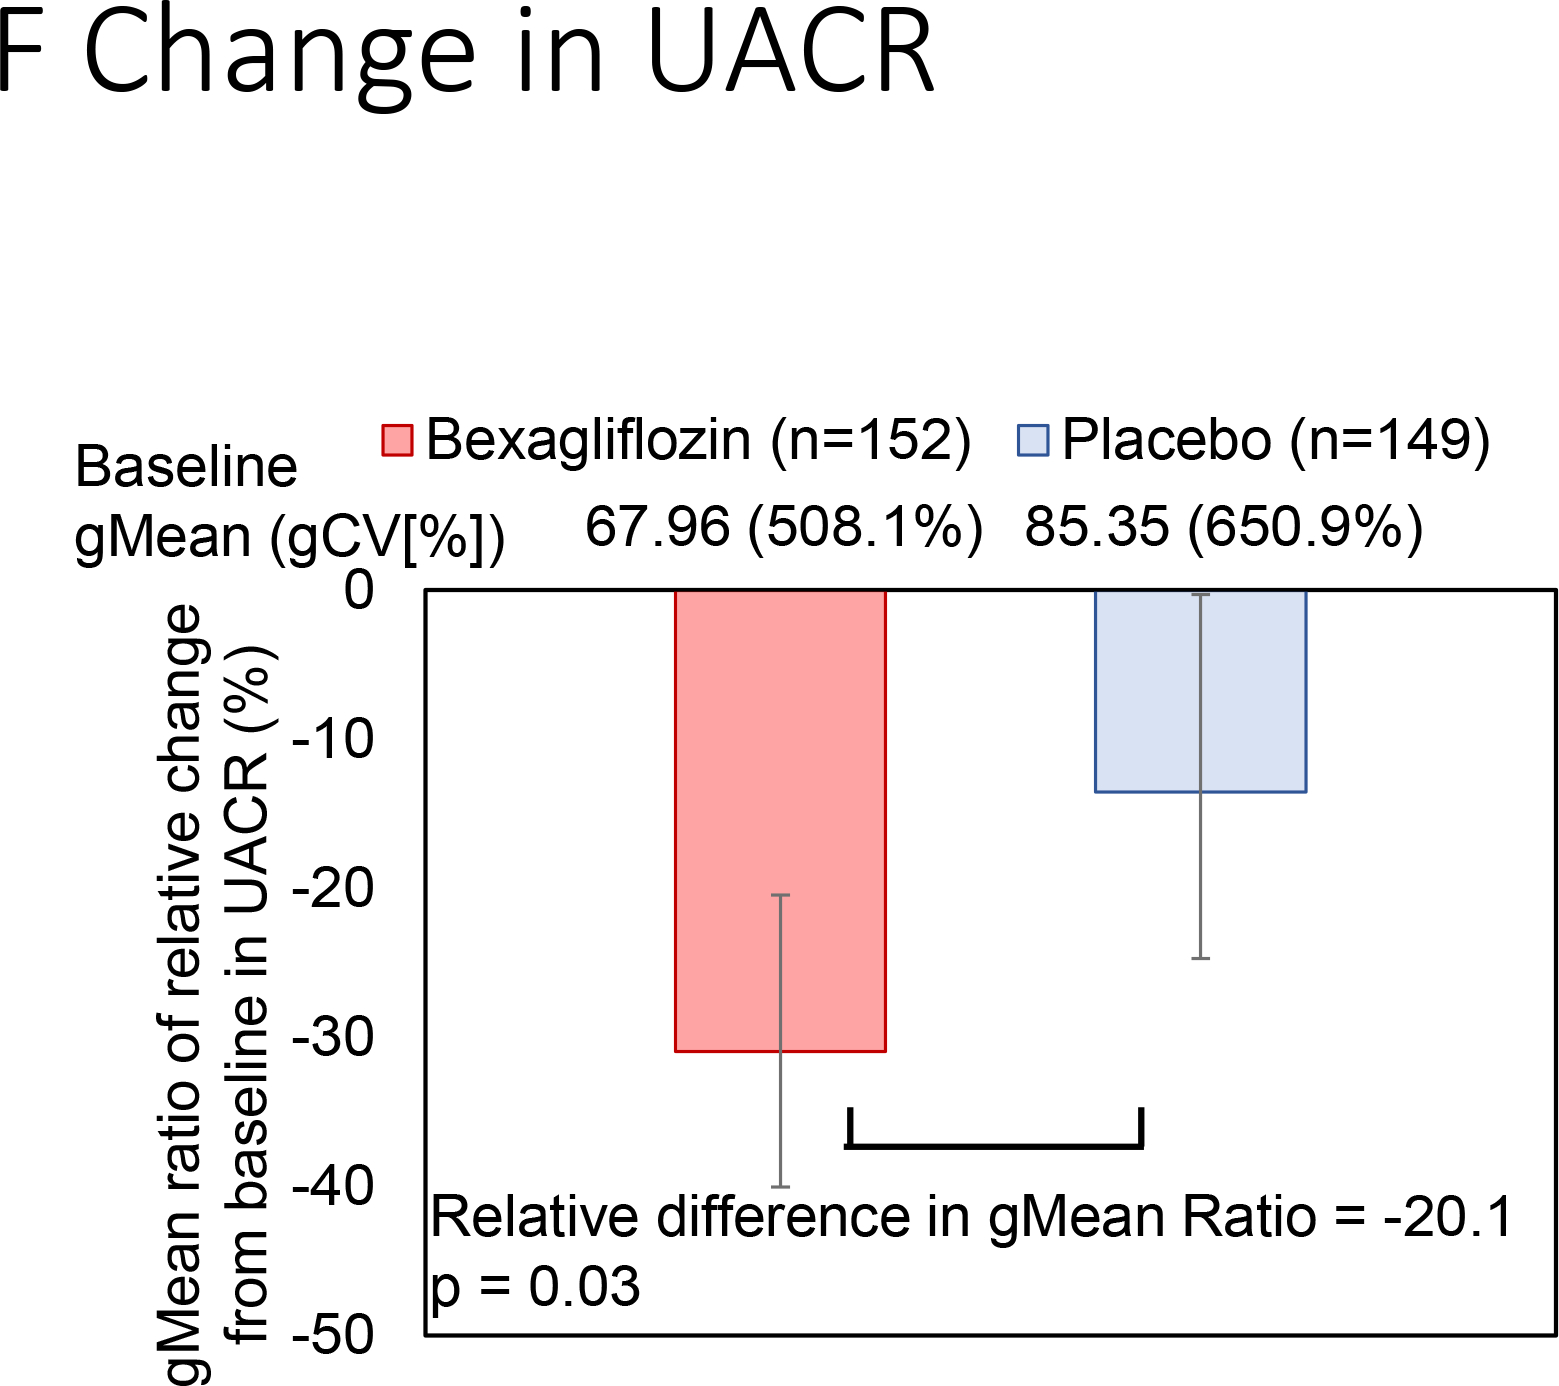
Outcomes: Primary outcome was change in percent hemoglobin A1c from baseline to week 24. Secondary end points included changes in body weight, systolic blood pressure, albuminuria, and hemoglobin A1c level stratified by CKD stage.

Results: 312 patients across 54 sites were analyzed. Bexagliflozin lowered hemoglobin A1c levels by 0.37% (95% CI, 0.20%-0.54%); P<0.001 compared to placebo. Patients with CKD stages 3a (eGFR, 45-<60mL/min/1.73m2) and 3b (eGFR, 30-<45mL/min/1.73m2) experienced reductions in hemoglobin A1c levels of 0.31% (P=0.007) and 0.43% (P=0.002), respectively. Bexagliflozin decreased body weight (1.61kg; P<0.001), systolic blood pressure (3.8mm Hg; P=0.02), fasting plasma glucose level (0.76mmol/L; P=0.003), and albuminuria (geometric mean ratio reduction of 20.1%; P=0.03). Urinary tract infection and genital mycotic infections were more common in the bexagliflozin group; otherwise, frequencies of adverse events were comparable between groups.

Limitations: Not designed to evaluate the impact of treatment on long-term kidney disease and cardiovascular outcomes.

Conclusions: Bexagliflozin reduces hemoglobin A1c levels in patients with diabetes and stage 3a/3b CKD and appears to be well tolerated. Additional observed benefits included reductions in body weight, systolic blood pressure, and albuminuria.

Funding: Trial was sponsored by Theracos Sub, LLC.

Keywords: SGLT2 inhibitor; Type 2 diabetes; albuminuria; bexagliflozin; chronic kidney disease (CKD); estimated glomerular filtration rate (eGFR); glucose-lowering therapy; hemoglobin A(1c) (HbA(1c)); kidney function; randomized controlled trial (RCT); renal impairment.


Figures

Figure 1:
Figure 1:
CONSORT flow chart of patient disposition.
Figure 2:
Figure 2:
Estimated mean change from baseline in hemoglobin A1c by treatment and kidney function group at week 24 Key: HbA1c (hemoglobin A1c), SE (standard error), CKD (chronic kidney disease) The analysis used a mixed-effects repeated measures model that included region, insulin-treated status, baseline eGFR, treatment, visit, treatment-by-visit interaction, and the baseline hemoglobin A1c value as a fixed effect covariate. An unstructured covariance matrix was assumed. Data from Weeks 6, 12, and 24 were used in the model. The last post-baseline observation before rescue medication was carried forward.
Figure 3:
Figure 3:
Change over time of clinical outcomes by treatment group. Panels: (A) Change in hemoglobin A1c, (B) Proportion of patients who achieved hemoglobin A1c <7%, (C) Change in body weight, (D) Change in systolic blood pressure, (E) Change in fasting plasma glucose, and (F) Change in albuminuria (UACR) at week 24 Key: HbA1c (Hemoglobin A1c), SBP (systolic blood pressure), FPG (fasting plasma glucose), UACR (urinary albumin-creatinine ratio), gMean (geometric mean), gCV (geometric coefficient of variation) (A), (C), (D), (E): Estimated Mean (± SE) change from baseline in hemoglobin A1c (%), body weight (kg), SBP (mm Hg), and fasting plasma glucose (mmol L−1) for all subjects were summarized. The full model is a mixed-effects repeated measures analysis. (B) Proportion of subjects with HbA1c < 7% over time was summarized using mixed-effects logistic regression for repeated measures analysis. An unstructured covariance matrix is assumed. (F) Adjusted geometric mean ratios of relative change from baseline in UACR was calculated as (gmean of week 24 /gmean of baseline) and their 95% CIs calculated as the antilog of the least squares means and 95 % CI of change from baseline in log-transformed, are values minus 1, converted to percentage.
Figure 3:
Figure 3:
Change over time of clinical outcomes by treatment group. Panels: (A) Change in hemoglobin A1c, (B) Proportion of patients who achieved hemoglobin A1c <7%, (C) Change in body weight, (D) Change in systolic blood pressure, (E) Change in fasting plasma glucose, and (F) Change in albuminuria (UACR) at week 24 Key: HbA1c (Hemoglobin A1c), SBP (systolic blood pressure), FPG (fasting plasma glucose), UACR (urinary albumin-creatinine ratio), gMean (geometric mean), gCV (geometric coefficient of variation) (A), (C), (D), (E): Estimated Mean (± SE) change from baseline in hemoglobin A1c (%), body weight (kg), SBP (mm Hg), and fasting plasma glucose (mmol L−1) for all subjects were summarized. The full model is a mixed-effects repeated measures analysis. (B) Proportion of subjects with HbA1c < 7% over time was summarized using mixed-effects logistic regression for repeated measures analysis. An unstructured covariance matrix is assumed. (F) Adjusted geometric mean ratios of relative change from baseline in UACR was calculated as (gmean of week 24 /gmean of baseline) and their 95% CIs calculated as the antilog of the least squares means and 95 % CI of change from baseline in log-transformed, are values minus 1, converted to percentage.
Figure 4:
Figure 4:
Change in kidney function by treatment group. Panels: (A) Change in creatinine, (B) Change in estimated glomerular filtration rate (eGFR). Bexagliflozin/placebo was dosed through week 24, with an arrow denoting last dose.
Figure 4:
Figure 4:
Change in kidney function by treatment group. Panels: (A) Change in creatinine, (B) Change in estimated glomerular filtration rate (eGFR). Bexagliflozin/placebo was dosed through week 24, with an arrow denoting last dose.

References

    1. Emerging Risk Factors C, Sarwar N, Gao P, et al. Diabetes mellitus, fasting blood glucose concentration, and risk of vascular disease: a collaborative meta-analysis of 102 prospective studies. Lancet. 2010;375(9733):2215–2222. - PMC - PubMed
    1. American Diabetes A 2. Classification and Diagnosis of Diabetes: Standards of Medical Care in Diabetes-2018. Diabetes Care. 2018;41(Suppl 1):S13–S27. - PubMed
    1. National Kidney F KDOQI Clinical Practice Guideline for Diabetes and CKD: 2012 Update. Am J Kidney Dis. 2012;60(5):850–886. - PubMed
    1. de Boer IH, Rue TC, Hall YN, Heagerty PJ, Weiss NS, Himmelfarb J. Temporal trends in the prevalence of diabetic kidney disease in the United States. JAMA. 2011;305(24):2532–2539. - PMC - PubMed
    1. Coll-de-Tuero G, Mata-Cases M, Rodriguez-Poncelas A, et al. Chronic kidney disease in the type 2 diabetic patients: prevalence and associated variables in a random sample of 2642 patients of a Mediterranean area. BMC Nephrol. 2012;13:87. - PMC - PubMed

Publication types