. 2019 May 17;2(3):e201900340.
doi: 10.26508/lsa.201900340. Print 2019 Jun.

An N-terminal-truncated isoform of FAM134B (FAM134B-2) regulates starvation-induced hepatic selective ER-phagy

Affiliations

An N-terminal-truncated isoform of FAM134B (FAM134B-2) regulates starvation-induced hepatic selective ER-phagy

Shohei Kohno et al. Life Sci Alliance. .

Abstract

Autophagy is a conserved system that adapts to nutrient starvation, after which proteins and organelles are degraded to recycle amino acids in response to starvation. Recently, the ER was added to the list of targets of autophagic degradation. Autophagic degradation pathways of bulk ER and the specific proteins sorted through the ER are considered key mechanisms in maintaining ER homeostasis. Four ER-resident proteins (FAM134B, CCPG1, SEC62, and RTN3) have been identified as ER-resident cargo receptors, which contain LC3-interacting regions. In this study, we identified an N-terminal-truncated isoform of FAM134B (FAM134B-2) that contributes to starvation-induced ER-related autophagy. Hepatic FAM134B-2 but not full-length FAM134B (FAM134B-1) is expressed in a fed state. Starvation drastically induces FAM134B-2 but no other ER-resident cargo receptors through transcriptional activation by C/EBPβ. C/EBPβ overexpression increases FAM134B-2 recruitment into autophagosomes and lysosomal degradation. FAM134B-2 regulates lysosomal degradation of ER-retained secretory proteins such as ApoCIII. This study demonstrates that the C/EBPβ-FAM134B-2 axis regulates starvation-induced selective ER-phagy.


Conflict of interest statement

The authors declare that they have no conflict of interest.

Figures
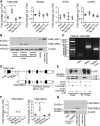
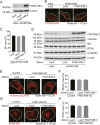
Figure 1.
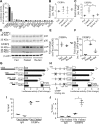
Figure 1.. Starvation triggers the selective induction of FAM134B-2.
(A) qRT-PCR analysis of FAM134B, SEC62, RTN3, and CCPG1 in mouse livers from fed, fasted, and re-fed conditions. (B) Immunoblot analysis of FAM134B in mouse livers (fed, fasted, and re-fed), mouse brain, and recombinant FLAG-FAM134B-1 generated in HEK293T cells. (C) Gel electrophoresis of 5′ RACE products using brain cDNA from fed mice or liver cDNA from fasted mice. (D) Schematic models of mouse FAM134B-1 and FAM134B-2 genes. (E) Co-immunoprecipitation of endogenous LC3B, FLAG-FAM134B-2, and FLAG-FAM134B-2-ΔLIR. FLAG-FAM134B-2 was transiently overexpressed in HEK293T cells. 24 h after transfection, the cells were starved for 6 h in the presence of EBSS and bafilomycin A1 (1 μM). (F) qRT-PCR analysis of FAM134B-1 and FAM134B-2 in mouse livers under fed, fasted, and re-fed conditions. (G) Immunoblot analysis of FAM134B in mouse livers (fed and fasted), recombinant FLAG-FAM134B-1 and 2 generated in HEK293T cells. One-way ANOVA with a Student–Newman post hoc test was used for statistical analysis. *P < 0.05.
Figure S1.
Figure S1.. Identification of FAM134B mRNA in starved liver.
Sequencing data of 5′ RACE products. 5′ RACE products of mouse brain or liver were cloned and sequenced. Red underline indicates FAM134B-1– or FAM134B-2–specific sequence. Black underline indicates common sequence of FAM134B-1 and FAM134B-2.
Figure S2.
Figure S2.. Starvation triggers the induction of FAM134B-2 in liver and other peripheral tissue.
(A) Schematic models of human FAM134B-1 and FAM134B-2 genes. (B) Membrane topology model generated by Protter for human and mouse FAM134B-2. Red indicates the LC3-interacting region (LIR). (C) Gel electrophoresis of RT-PCR product of mouse brain and fasted liver using FAM134B-1 or FAM134B-2 specific primers. (D) Immunoblot analysis of FAM134B in brain, kidney, spleen and white adipose tissue from fed or 16-h fasted mice.
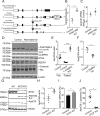
Figure 2.
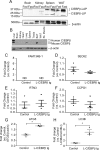
Figure 2.. C/EBPβ mediates FAM134B-2 transcription.
(A) Promoter analysis of the mouse FAM134B-2 gene using a luciferase (Luc) reporter gene assay. HEK293T cells were co-transfected with firefly luciferase reporter plasmid containing the 1.5-kb promoter region of the mouse FAM134B-2 gene, pCMV-LacZ, and empty or indicated transcriptional factor expression plasmids. Results are expressed as the relative Luc/-galactosidase units of induction (n-fold) over the empty plasmid. (B–D) qRT-PCR analysis and (D) immunoblot analysis o f C/EBPα and C/EBPβ in mouse livers from fed, fasted, and re-fed conditions. (E, F) Immunoblot results of (E) C/EBPα and (F) C/EBPβ were quantified using a densitometric analysis. (G, H) Deletion (G) and mutational (H) analysis of the mouse FAM134B-2 gene using a luciferase reporter gene assay. The schematic illustrations represent the serially deleted FAM134B-2/Luc reporter constructs (G) or mutated FAM134B-2/Luc reporter constructs (H). Results are expressed as the relative Luc/β-galactosidase units of induction (n-fold) over the empty plasmid. (I, J) ChIP assay for in vivo binding status of C/EBPα (I) or C/EBPβ (J) on the FAM134B-2 promoter. Mouse liver chromatin extracts from fed or fasted conditions were immunoprecipitated with anti-C/EBP antibodies or normal IgG. Purified DNA was determined with qRT-PCR. Data show percentage to input DNA. One-way ANOVA with a Student–Newman post hoc test was used for statistical analysis. *P < 0.05.
Figure S3.
Figure S3.. C/EBPb doesn't mediate the induction of ER-phagy receptors except for FAM134B-2.
(A) Immunoblot analysis of C/EBPb in brain, kidney, spleen and white adipose tissue from fed or 16-h fasted mice. (B) Immunoblot analysis of C/EBPb in the tissues of liver-specific C/EBPb transgenic (L-C/EBPb tg) mice. (C–F) qRT-PCR analysis of FAM134B-1 (C), SEC62 (D), RTN3 (E), and CCPG1 (F) in livers from L-C/EBPb transgenic mice and control mice. (G, H) Densitometric analysis of ATG5 (G), LC3B (H) in livers from L-C/EBPb transgenic mice and control mice. Student's unpaired t test was used for statistical analysis. *P < 0.05.
Figure 3.
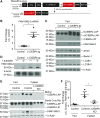
Figure 3.. C/EBPβ regulates FAM134B-2 and autophagy regulators in the mouse liver.
(A) Scheme of construct design for targeting the C/EBPβ transgene. (B) qRT-PCR analysis of FAM134B-2 in livers from WT and L-C/EBPβ tg mice under a fed state. (C) Immunoblot analysis of FAM134B-2, ATG5, Beclin-1, and LC3B in livers from WT and L-C/EBPβ tg mice under a fed state. *Non-specific signal. (D) Immunoblot analysis of FAM134B-2 in livers from WT and L-C/EBPβ tg mice treated with leupeptin (i.p., 15 mg/kg body weight) for 4 h. (E) Immunoblot analysis of FAM134B-2 in livers of L-C/EBPβ KO mice under starvation. Mice were fasted for 16 h. (F) Quantitative densitometry of the immunoblot analysis. *Nonspecific signal. Student’s unpaired t test was used for statistical analysis. *P < 0.05. Source data are available for this figure.
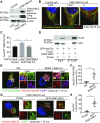
Figure 4.
Figure 4.. Hepatic FAM134B-2 is located in the SER and RER and degraded in the lysosome.
(A) Immunoblot analysis of FAM134B-2, FAM134C, SERCA2, SCD1, RAMP4, SEC61a, and SEC62 in liver ER subfractions. Microsomes were isolated from fasted mice and separated to ER subfractions using iodixanol density gradient ultracentrifugation (Opti-Prep). (B) Immunoblot analysis of FAM134B-2, LC3B, RTN4, CLIMP63, SEC62, and SERCA2 in the mouse liver. Leupeptin (15 mg/kg body weight) or PBS was intraperitoneally injected into fed or fasted mice. After 4 h, the mice were sacrificed. (C–E) Densitometric analysis of FAM134B-2 (C), LC3B (D), and SERCA2 (E) in livers with leupeptin treatment. Student’s unpaired t test was used for statistical analysis. *P < 0.05.
Figure S4.
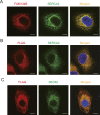
Figure S4.. FAM134B-2 colocalizes with SERCA2 and SEC62.
(A) Representative images of immunofluorescence using HeLa cells. HeLa cells overexpressed C/EBPb. Green = SERCA2, red = FAM134B. (B) Representative images of immunofluorescence using HeLa cells. HeLa cells overexpressed Flag-tagged mouse FAM134B-2. Green = SERCA2, red = Flag (FAM134B-2). (C) Representative images of immunofluorescence using HeLa cells. HeLa cells overexpressed Flag-tagged mouse FAM134B-2. Green = SEC62, red = Flag (FAM134B-2). Scale bar = 10 mm.
Figure S5.
Figure S5.. Over production of FAM134B-2 and disrupted FAM134B-2 mediated ER-phagy.
(A, B) qRT-PCR analysis (A) and immunoblot analysis (B) of FAM134B-2 in mouse primary hepatocytes. Mouse primary hepatocytes were isolated and cultured for the indicated time period. (C) Immunoblot analysis of FAM134B-2 and LC3B in mouse primary hepatocytes. Mouse primary hepatocytes were cultured in EBSS with or without bafilomycin A1 for 8 h. One-way ANOVA with a Student-Newman post-hoc test was used for statistical analysis. *P < 0.05.
Figure S6.
Figure S6.. C/EBPβ mediates FAM134B-2 induction in human cell lines.
(A) qRT-PCR analysis of FAM134B-2 in HEK, U2OS, HeLa, HepG2, and NIH-3T3 cells. (B) Immunoblot analysis of FAM134B in HEK and U2OS cells. The cells were cultured with complete media (CM) or EBSS for 6 h in the absence/presence of bafilomycin A1 (1 μM) for 6 h. *Nonspecific signal. (C) Immunoblot analysis of FAM134B-2 and C/EBPβ in HeLa cells. Cells were transfected with C/EBPβ or EGFP for 24 h. One-way ANOVA with a Student–Newman post hoc test was used for statistical analysis. *P < 0.05.
Figure 5.
Figure 5.. C/EBPβ induces FAM134B-2 expression, the recruitment of FAM134B-2 into autophagosomes, and lysosomal FAM134B-2 degradation.
(A, B) qRT-PCR analysis of FAM134B-1 (A) and FAM134B-2 (B) in HeLa cells. Cells were cultured with complete media (CM) or EBSS for 6 h. (C) Immunoblot analysis of FAM134B-2 in HeLa and HepG2 cells. Cells were cultured with complete media (CM) or EBSS for 6 h in the albescence/presence of bafilomycin A1 (1 μM) for 6 h. *Nonspecific signal. (D) Representative images of immunofluorescence using HeLa cells. HeLa cells overexpressed C/EBPβ and were cultured with bafilomycin A1 or vehicle for 6 h. Green = LC3, red = FAM134B. (E) PCCs between FAM134B and LC3 were quantified. (F) Area of LC3 puncta was quantified. (G) Representative images of immunofluorescence using HeLa cells. HeLa cells overexpressed C/EBPβ and were cultured with bafilomycin A1 for 6 h. Green = LAMP1, red = LC3, magenta = FAM134B. One-way ANOVA with a Student–Newman post hoc test was used for statistical analysis. *P < 0.05.
Figure S7.
Figure S7.. The C/EBPb-FAM134B-2 axis contributes to ApoCIII degradation during fasting but not ER-size homeostasis.
(A–C) Quantification of ER area. HeLa cells stably expressing mCherry-ER were infected with adenovirus containing mouse FAM134B-2, and then treated with FAM134B siRNA. (A) Immunoblot analysis of FAM134B-2 in HeLa-mCherry-ER cells. (B) Representative images of HeLa-mCherry-ER cells. (C) Quantification of ER area. mCherry-positive ER area was presented as an ER-fraction of the total cell area (20 cells). (D) Immunoblot analysis of ER chaperones (Calnexin, Bip, RTN4 and CLIMP63) in HeLa mCherry ER cells. HeLa cells stably expressing mCherry-ER were infected with adenovirus containing mouse FAM134B-2, and then treated with FAM134B siRNA. (E, F) Quantification of sheet-cisternal ER. HeLa FAM134B KO cells were infected with adenovirus containing mouse FAM134B-2 and transfected with mCherry-SEC61B. (E) Representative images of HeLa FAM134B KO cells. (F) Quantification of sheet-like cisternal ER area. mCherry-SEC61B-positive ER area was presented as an ER-fraction of the total cell area (20 cells). (G, H) Quantification of tubular ER. HeLa FAM134B KO cells were infected with adenovirus containing mouse FAM134B-2 and transfected with RTN4-HA. (G) Representative images of HeLa FAM134B KO cells. (H) Quantification of tubular ER area. RTN4-HA-positive ER area was presented as an ER-fraction of the total cell area (20 cells).
Figure S8.
Figure S8.. The C/EBPβ-FAM134B-2 axis contributes to ApoCIII degradation during fasting but not ER-size homeostasis.
(A) The generation of FAM134B KO mice. (B) Densitometric analysis of ApoCIII in liver microsomes from fasted control and FAM134B KO mice. Mice were fasted for 16 h. (C) ApoCIII mRNA in the livers of fasted FAM134B KO mice. Mice were fasted for 16 h. (D) Immunoblot analysis of the ER structure proteins and chaperones REEP5, RTN4, and CLIMP63 in total protein of livers from fasted wild-type and FAM134B KO mice. (E) Densitometric analysis of ApoCIII in livers from control and L-C/EBPβ KO mice. (F) Densitometric analysis of ApoCIII in livers from control and L-C/EBPβ TG mice. (G) Immunoblot analysis of ATG7, ApoCIII, and FAM134B in ATG7 KO HeLa cells. (H) Densitometric analysis of ApoCIII in ATG7 KO HeLa cells. (I) Quantification of GFP-ApoCIII–positive areas in the SERCA2 positive ER. (J) Quantification of mCherry-ApoCIII–positive LAMP1. ATG7 KO HeLa cells were transfected with mCherry-ApoCIII. 24 h after transfection, the cells were starved for 6 h in the presence of EBSS and bafilomycin A1. Student’s unpaired t test was used for statistical analysis. *P < 0.05.
Figure 6.
Figure 6.. FAM134B-2 induces starvation-induced ApoCIII degradation.
(A) Heat map comparing protein levels in hepatic microsomes of FAM134B KO mice under starvation. Mice were fasted for 16 h. The details of the proteomics analysis were described in the Materials and Methods section. (B) Immunoblot analysis of microsomal ApoCIII, ER chaperones, RTN4, and CLIMP63 in the livers from fasted wild-type and FAM134B KO mice. (C) Immunoblot analysis of ApoCIII in the livers of L-C/EBPβ KO mice under fasted conditions. (D) Immunoblot analysis of ApoCIII in the livers of L-C/EBPβ TG mice under fed conditions. Source data are available for this figure.
Figure 7.
Figure 7.. FAM134B-2 induces starvation-induced ApoCIII degradation.
(A–C) Quantification of colocalization of EGFP-ApoCIII and SERCA2 positive ER. FAM134B KO HeLa cells were infected with adenovirus containing mouse FAM134B-2 and transfected with pEGFP-ApoCIII. (A) Immunoblot analysis of FAM134B-2 in HeLa FAM134B KO cells. (B) Representative images of HeLa FAM134B KO cells. (C) Quantification of GFP-ApoCIII positive areas in SERCA2-positive ER. (D) Co-immunoprecipitation of endogenous GFP-ApoCIII, FLAG-FAM134B-2. FLAG-FAM134B-2 was transiently overexpressed in HEK293T cells. 24 h after transfection, the cells were starved for 6 h in the presence of EBSS and bafilomycin A1. (E, F) Quantification of GFP-FAM134B-2 and mCherry-ApoCIII double positive LAMP1. The cells were transfected with GFP-FAM134B-2 and mCherry-ApoCIII. 24 h after transfection, the cells were starved for 6 h in the presence of EBSS and bafilomycin A1 or cultured with complete media. (E) Representative images of HeLa cells. (F) Quantification of GFP-FAM134B-2 and mCherry-ApoCIII double positive LAMP1. (G, H) Quantification of mCherry-ApoCIII–positive LAMP1. FAM134B KO HeLa cells were transfected with GFP-FAM134B-2 and mCherry-ApoCIII. 24 h after transfection, the cells were starved for 6 h in the presence of EBSS and bafilomycin A1. (G) Representative images of HeLa cells. (H) Quantification of mCherry-ApoCIII–positive LAMP1. One-way ANOVA with a Student–Newman post hoc test was used for statistical analysis. *P < 0.05.
Figure S9.
Figure S9.. PPARa and FXR don’t affect FAM134B-2 gene expression in the mouse liver.
(A, B) qRT-PCR analysis of FAM134B-2 (A) and FGF21 (B) in mouse livers. Mice were treated with GW7647 (i.p. 5 mg/kg body weight) for 16 h. (C) qRT-PCR analysis of FAM134B-2 in livers from FXR KO mice.
Figure S10.
Figure S10.. Our FAM134B antibody recognizes both isoforms of FAM134B.
Immunoblot analysis of FAM134B in mouse hepatocytes and C2C12 myoblasts. Mouse hepatocytes and C2C12 myoblasts were transfected with siFAM134B or siScramble. After 24 h, the cells were harvested to obtain whole-cell lysates.

References

    1. Begay V, Smink JJ, Loddenkemper C, Zimmermann K, Rudolph C, Scheller M, Steinemann D, Leser U, Schlegelberger B, Stein H, et al. (2015) Deregulation of the endogenous C/EBPbeta LIP isoform predisposes to tumorigenesis. J Mol Med (Berl) 93: 39–49. 10.1007/s00109-014-1215-5 - DOI - PubMed
    1. Benham AM. (2012) Protein secretion and the endoplasmic reticulum. Cold Spring Harb Perspect Biol 4: a012872 10.1101/cshperspect.a012872 - DOI - PMC - PubMed
    1. Borgese N, Francolini M, Snapp E (2006) Endoplasmic reticulum architecture: Structures in flux. Curr Opin Cell Biol 18: 358–364. 10.1016/j.ceb.2006.06.008 - DOI - PMC - PubMed
    1. Braakman I, Hebert DN (2013) Protein folding in the endoplasmic reticulum. Cold Spring Harb Perspect Biol 5: a013201 10.1101/cshperspect.a013201 - DOI - PMC - PubMed
    1. Ezaki J, Matsumoto N, Takeda-Ezaki M, Komatsu M, Takahashi K, Hiraoka Y, Taka H, Fujimura T, Takehana K, Yoshida M, et al. (2014) Liver autophagy contributes to the maintenance of blood glucose and amino acid levels. Autophagy 7: 727–736. 10.4161/auto.7.7.15371 - DOI - PMC - PubMed

Publication types

MeSH terms

Substances