. 2019 Jul 1;79(13):3192-3204.
doi: 10.1158/0008-5472.CAN-18-3536. Epub 2019 May 17.

Identification of Novel Susceptibility Loci and Genes for Prostate Cancer Risk: A Transcriptome-Wide Association Study in Over 140,000 European Descendants

Affiliations

Identification of Novel Susceptibility Loci and Genes for Prostate Cancer Risk: A Transcriptome-Wide Association Study in Over 140,000 European Descendants

Lang Wu et al. Cancer Res. .

Abstract

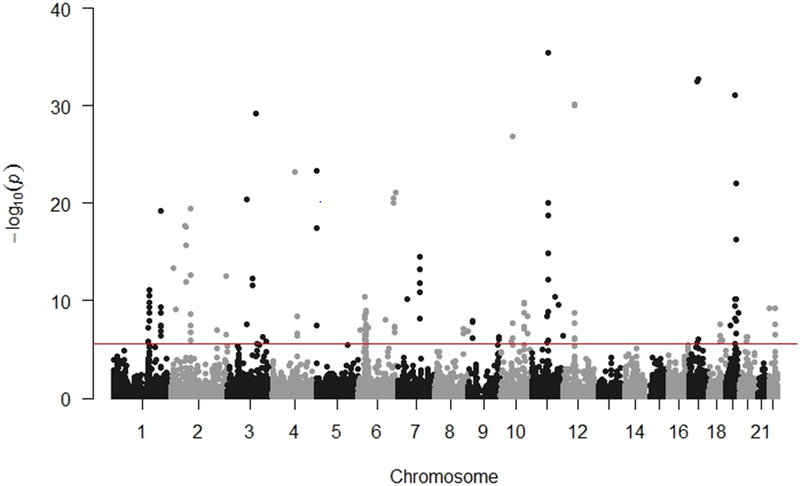
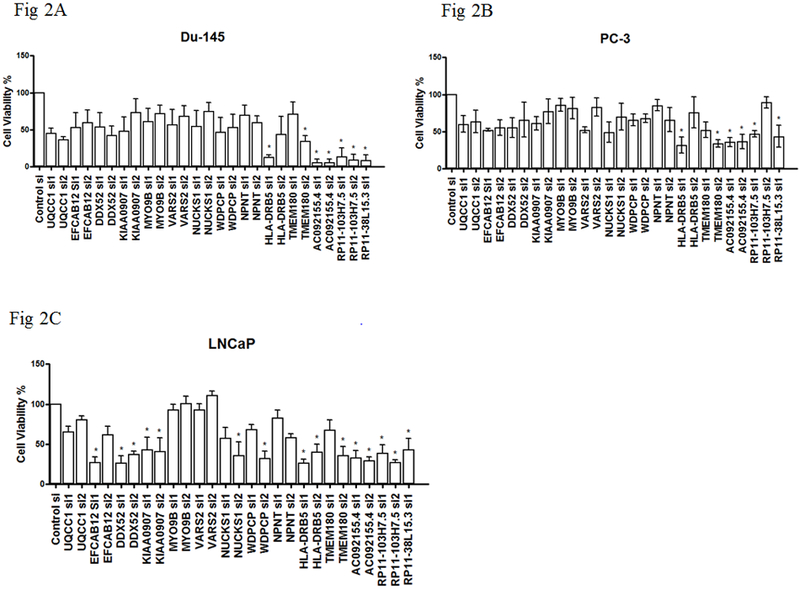
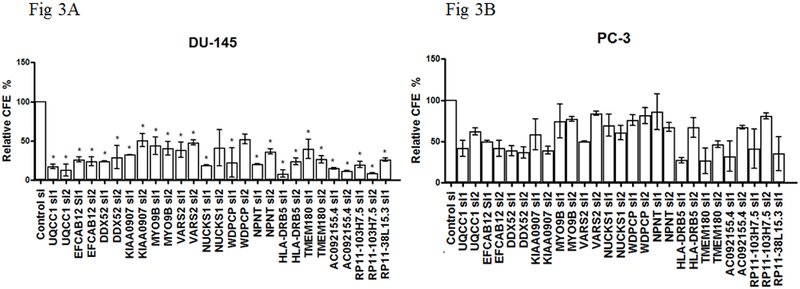
Genome-wide association study-identified prostate cancer risk variants explain only a relatively small fraction of its familial relative risk, and the genes responsible for many of these identified associations remain unknown. To discover novel prostate cancer genetic loci and possible causal genes at previously identified risk loci, we performed a transcriptome-wide association study in 79,194 cases and 61,112 controls of European ancestry. Using data from the Genotype-Tissue Expression Project, we established genetic models to predict gene expression across the transcriptome for both prostate models and cross-tissue models and evaluated model performance using two independent datasets. We identified significant associations for 137 genes at P < 2.61 × 10⁻⁶, a Bonferroni-corrected threshold, including nine genes that remained significant at P < 2.61 × 10⁻⁶ after adjusting for all known prostate cancer risk variants in nearby regions. Of the 128 remaining associated genes, 94 have not yet been reported as potential target genes at known loci. We silenced 14 genes and many showed a consistent effect on viability and colony-forming efficiency in three cell lines. Our study provides substantial new information to advance our understanding of prostate cancer genetics and biology. SIGNIFICANCE: This study identifies novel prostate cancer genetic loci and possible causal genes, advancing our understanding of the molecular mechanisms that drive prostate cancer.


Figures

Figure 1.
Figure 1.. Manhattan plot of association results from the prostate cancer transcriptome-wide association study.
The red line represents P = 2.61 × 10⁻⁶ based on 19,169 tests. Each dot represents the genetically predicted expression of one specific gene by either prostate tissue or cross-tissue prediction models: the x axis represents the genomic position of the corresponding gene, and the y axis represents the negative logarithm of the association P-value. There are two associations with P < 1.00 × 10−40 not shown in this Figure.
Figure 2.
Figure 2.. Effects on cell viability in prostate cancer cells by gene silencing.
(A) DU-145, (B) PC-3 or (C) LNCaP cells were transfected with indicated siRNAs. On day 5, cell viability was determined using Alamar blue. Percent relative viability was calculated as: (siGOI value / mean NT siRNA control value) × 100. Error bars are from three independent experiments in quadruplicate, and represent standard deviation. P-values were determined by one-way ANOVA followed by Dunnett’s multiple comparisons test, which controlled for family-wise error-rate: *P-value < 0.05. NTC: non-target control.
Figure 3.
Figure 3.. Effects on colony formation efficiency (CFE) in prostate cancer cells by gene silencing.
(A) DU-145 or (B) PC-3 cells were transfected with indicated siRNAs, then reseeded after 16 hours for colony formation (CF) assay. At day 14, colonies were fixed with methanol, stained with crystal violet, scanned and batch analyzed by ImageJ. Relative CFE % = 100 +/− (relative CFE in indicated siRNA - CFE in NTC siRNA) / transfection efficiency (“+” if the GOI promotes CF and “-” if it inhibits CF). Error bars are from two independent experiments in triplicate, and represent standard deviation. P-values were determined by Welch’s ANOVA followed by Dunnett’s multiple comparisons test, which controlled for family-wise error-rate: *P-value < 0.05. NTC: non-target control.

References

    1. Siegel RL, Miller KD, Jemal A. Cancer statistics, 2019. CA: a cancer journal for clinicians 2019;69:7–34 - PubMed
    1. Demichelis F, Stanford JL. Genetic predisposition to prostate cancer: Update and future perspectives. Urologic oncology 2015;33:75–84 - PubMed
    1. Crawford ED. Epidemiology of prostate cancer. Urology 2003;62:3–12 - PubMed
    1. Al Olama AA, Kote-Jarai Z, Berndt SI, Conti DV, Schumacher F, Han Y, et al. A meta-analysis of 87,040 individuals identifies 23 new susceptibility loci for prostate cancer. Nature genetics 2014;46:1103–9 - PMC - PubMed
    1. Eeles RA, Olama AA, Benlloch S, Saunders EJ, Leongamornlert DA, Tymrakiewicz M, et al. Identification of 23 new prostate cancer susceptibility loci using the iCOGS custom genotyping array. Nature genetics 2013;45:385–91, 91e1–2 - PMC - PubMed

Publication types

Substances