

Discrepancies between observed data and predictions from mathematical modelling of the impact of screening interventions on Chlamydia trachomatis prevalence
- PMID: 31101863
- PMCID: PMC6525258
- DOI: 10.1038/s41598-019-44003-x
Discrepancies between observed data and predictions from mathematical modelling of the impact of screening interventions on Chlamydia trachomatis prevalence
Abstract
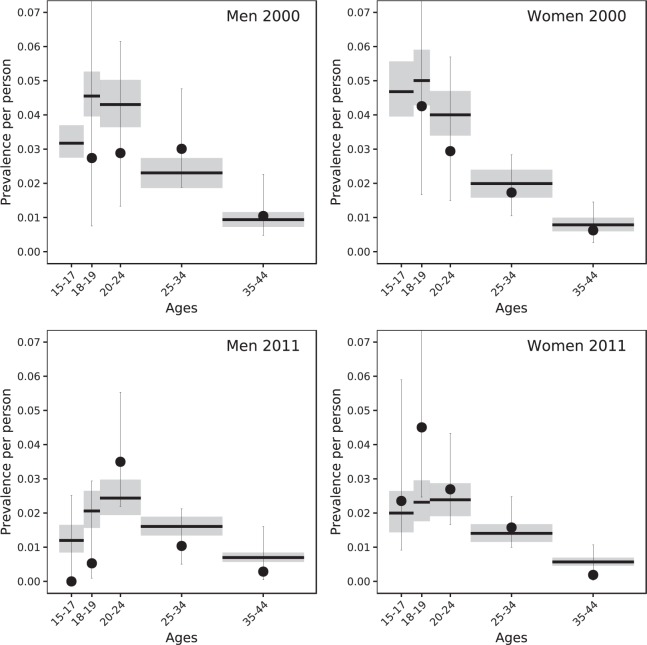
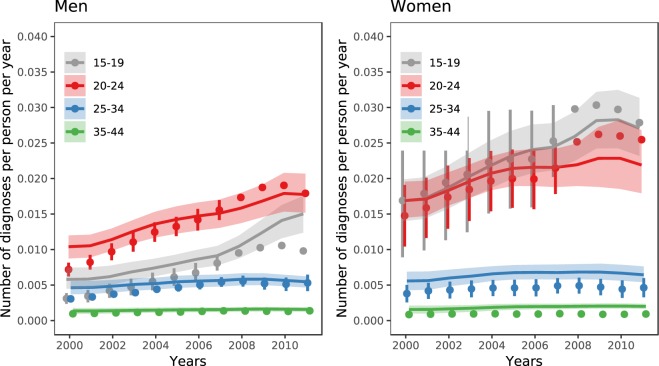
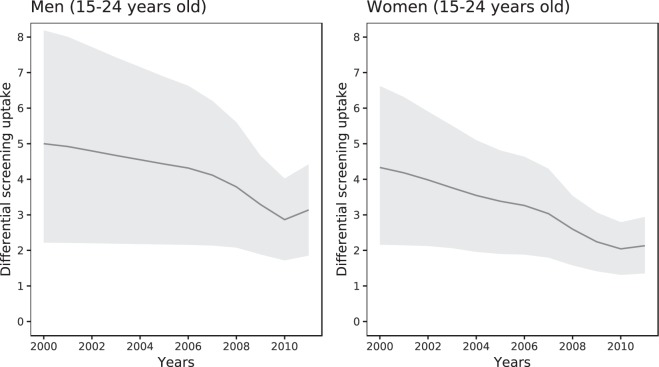
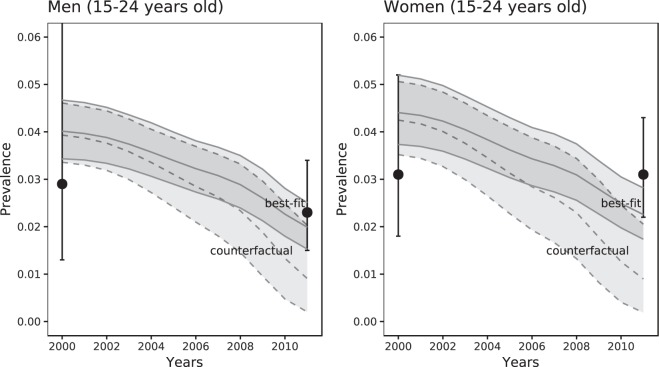
Mathematical modelling studies of C. trachomatis transmission predict that interventions to screen and treat chlamydia infection will reduce prevalence to a greater degree than that observed in empirical population-based studies. We investigated two factors that might explain this discrepancy: partial immunity after natural infection clearance and differential screening coverage according to infection risk. We used four variants of a compartmental model for heterosexual C. trachomatis transmission, parameterized using data from England about sexual behaviour, C. trachomatis testing, diagnosis and prevalence, and Markov Chain Monte Carlo methods for statistical inference. In our baseline scenario, a model in which partial immunity follows natural infection clearance and the proportion of tests done in chlamydia-infected people decreases over time fitted the data best. The model predicts that partial immunity reduced susceptibility to reinfection by 68% (95% Bayesian credible interval 46-87%). The estimated screening rate was 4.3 (2.2-6.6) times higher for infected than for uninfected women in 2000, decreasing to 2.1 (1.4-2.9) in 2011. Despite incorporation of these factors, the model still predicted a marked decline in C. trachomatis prevalence. To reduce the gap between modelling and data, advances are needed in knowledge about factors influencing the coverage of chlamydia screening, the immunology of C. trachomatis and changes in C. trachomatis prevalence at the population level.
Conflict of interest statement
The authors declare no competing interests.
Figures

References
-
- European Centre for Disease Prevention and Control (ECDC). Guidance on chlamydia control in Europe, 2015 (Stockholm, 2016).
-
- World Health Organization (WHO). Global health sector strategy on Sexually Transmitted Infections, 2016–2021 (Geneva, 2016). - PubMed
-
- Public Health England (PHE). National chlamydia screening programme (NCSP): data tables, https://www.gov.uk/government/collections/national-chlamydia-screening-p... (2016).
-
- Centers for DiseaseControl and Prevention (CDC). Sexually Transmitted Diseases Surveillance, Table 10, https://www.cdc.gov/std/stats16/tables/10.htm (2017).
Publication types
MeSH terms
Grants and funding
LinkOut - more resources
Full Text Sources
Miscellaneous
