. 2019 May 17;9(1):7546.
doi: 10.1038/s41598-019-44033-5.

A sulfur and nitrogen cycle informed model to simulate nitrate treatment of reservoir souring

Affiliations

A sulfur and nitrogen cycle informed model to simulate nitrate treatment of reservoir souring

Moein Jahanbani Veshareh et al. Sci Rep. .

Abstract

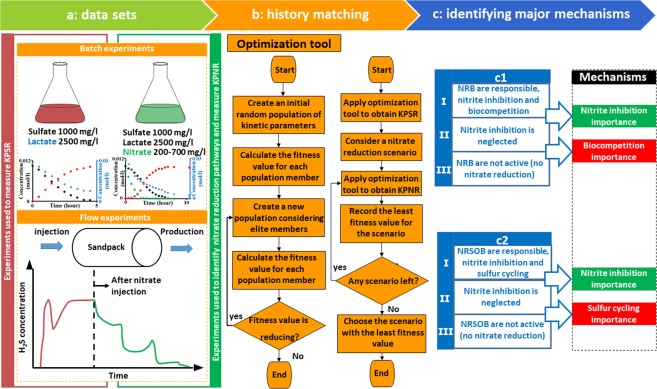
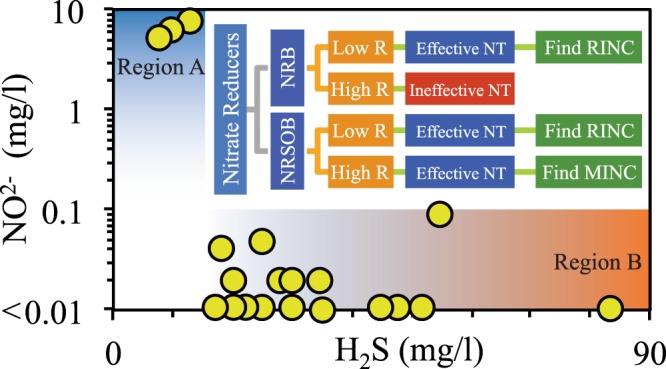
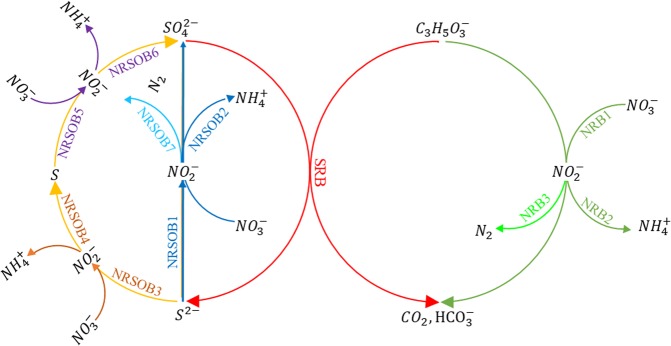
Nitrate treatment has been widely used in various seawater injection projects to treat biologic sulfate reduction or reservoir souring. To design a promising nitrate treatment plan, it is essential to have a comprehensive understanding of reactions that represent the microbial communities of the reservoir and mechanisms through which the souring process is inhibited. We employ a new approach of evaluating different reaction pathways to design reaction models that reflect governing microbial processes in a set of batch and flow experiments. Utilizing the designed models, we suggest dissimilatory nitrate reduction to ammonium is the main reaction pathway. Additionally, we illustrate nitrite inhibition is the major mechanism of nitrate treatment process; independent of nitrate reduction being autotrophic or heterotrophic. We introduce an inhibitory nitrate injection concentration that can inhibit souring regardless of nitrite inhibition effect and the distance between injection and production wells. Furthermore, we demonstrate that the ratio of the nitrite-nitrate reduction rate can be used to estimate nitrate treatment effectiveness. Our findings in regard to importance of nitrite inhibition mechanism and the inhibitory nitrate concentration are in accordance with the field observations.


Conflict of interest statement

The authors declare no competing interests.

Figures

Figure 1
Figure 1
Schematic representation of data sets and methods used in this study. (a) A set of batch and flow experiments including only sulfate reduction (red) and, simultaneous sulfate and nitrate reduction (green). (b) The curve fitting algorithm utilized to obtain kinetic parameters of sulfate reducers (KPSR) as well as kinetic parameters of nitrate reducers (KPNR) (c) Different simulations designed to determine the relative importance of different mechanisms in nitrate treatment of reservoir souring.
Figure 2
Figure 2
(a–d) Profiles of nitrate, sulfate, nitrite and lactate for different initial nitrate concentrations. Experimental data are shown by markers and simulation results (SIM1) are shown by solid lines. (e,f) Compare sulfide and sulfate concentrations measured with SIM1, SIM2 (SIM1 without considering inhibition effect, shown by dashed lines) and SIM3 (SIM1 without considering NRB activity, shown by dotted lines). Note that lactate concentration should be read from the right vertical axis, for other components concentration should be read from the left axis.
Figure 3
Figure 3
Comparison between data of the flow experiments (blue markers), simulation of the Coombe et al. (the dashed line) and authors’ model (the solid line). (a) Sulfide concentration, 1st port; (b) sulfide concentration, 5th port; (c) sulfate concentration, 1st port; (d) sulfate concentration, 5th port; (e), nitrate concentration, 1st port; (f) nitrite concentration, 1st port (the dotted line should be read from the right axis and shows nitrate injection concentration).
Figure 4
Figure 4
(a) Sulfide concentration at various locations of a 1D system, shows the dependency of required inhibitory nitrate concentration to the distance between injection and production wells; the solid green line shows nitrate injection concentration, and should be read from the right vertical axis. (b,c) Illustrates the effect of sulfur cycling and nitrite inhibition on the overall efficiency of the nitrate treatment strategy by NRSOB for the first and the last port, respectively. SIM4 is the simulation considering NRSOB reactions and nitrite inhibition effect, SIM5 is the simulation considering NRSOB reactions without inhibition effect, and SIM6 is the simulation without considering NRSOB activity.
Figure 5
Figure 5
(a) Sulfide production under influence of NRB activity for various values of nitrite-nitrate reduction rate ratio (R) utilizing the model parameters of SIM1 with nitrate initial concentration of 700 mg/l. The solid, dotted, dashed and dashed-dotted lines are for R equals to 2.75, 1.5, 0.75 and 0.25, respectively. (b) Sulfide production affected by NRSOB activity for different values of R in the last port using the model parameters of SIM4. (c) Nitrate concentration corresponding to different cases of (b). In (b) and (c) the dotted, dashed, and solid lines are for R equal to 0.8, 0.4 and 0.2, respectively. Note that different R values are obtained by changing nitrite reduction rate.
Figure 6
Figure 6
The relationship between NO2 and H2S concentrations measured in several production wells of the Halfdan oil field reported by Vigneron et al.. High H2S concentration is observed for low concentrations of NO2 (region A). Significantly lower H2S concentration is observed for high concentrations of NO2 (region B). Wells shown in region B are connected through direct fractures.
Figure 7
Figure 7
Schematic representation of the different reaction pathways for reduction of nitrate, nitrite and sulfate; different groups of (Table S5) are shown by different colors.

References

    1. Ligthelm, D., De Boer, R., Brint, J. & Schulte, W. Reservoir souring: an analytical model for H2S generation and transportation in an oil reservoir owing to bacterial activity. In Offshore Europe, SPE 23141. at https://www.onepetro.org/conference-paper/SPE-23141-MS (Society of Petroleum Engineers, 1991).
    1. Sunde, E., Thorstenson, T., Torsvik, T., Vaag, J. & Espedal, M. Field-related mathematical model to predict and reduce reservoir souring. In SPE International Symposium on Oilfield Chemistry, SPE-25197-MS at https://www.onepetro.org/conference-paper/SPE-25197-MS (Society of Petroleum Engineers, 1993).
    1. Jiang J, et al. Hydrogen sulfide—mechanisms of toxicity and development of an antidote. Sci Rep. 2016;6:20831. doi: 10.1038/srep20831. - DOI - PMC - PubMed
    1. Al-Rasheedi, S., Kalli, C., Thrasher, D. & Al-Qabandi, S. Prediction and evaluation of the impact of reservoir souring in North Kuwait, a case study. In Middle East Oil Show and Conference, SPE-53164-MS at https://www.onepetro.org/conference-paper/SPE-53164-MS (Society of Petroleum Engineers, 1999).
    1. Vance, I. & Thrasher, D. R. Reservoir souring: mechanisms and prevention in Petroleum microbiology (eds Ollivier, B. & Magot, M.) 123–142 (American Society of Microbiology, 2005).

Publication types