. 2019 Jul;224(6):1987-1998.
doi: 10.1007/s00429-019-01888-8. Epub 2019 May 17.

Quantitative organization of the excitatory synapses of the primate cerebellar nuclei: further evidence for a specialized architecture underlying the primate cerebellum

Affiliations

Quantitative organization of the excitatory synapses of the primate cerebellar nuclei: further evidence for a specialized architecture underlying the primate cerebellum

Haian Mao et al. Brain Struct Funct. 2019 Jul.

Abstract

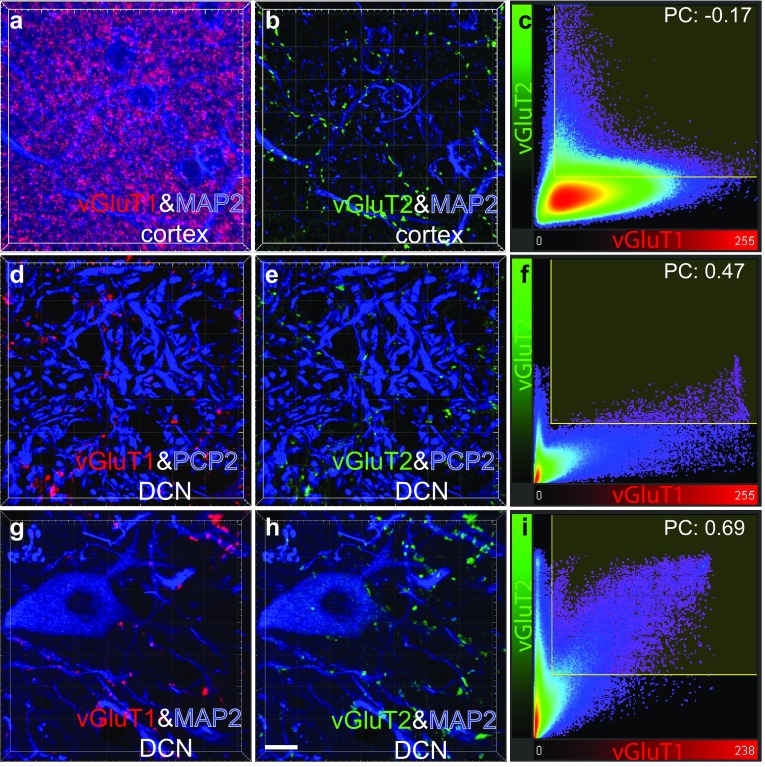
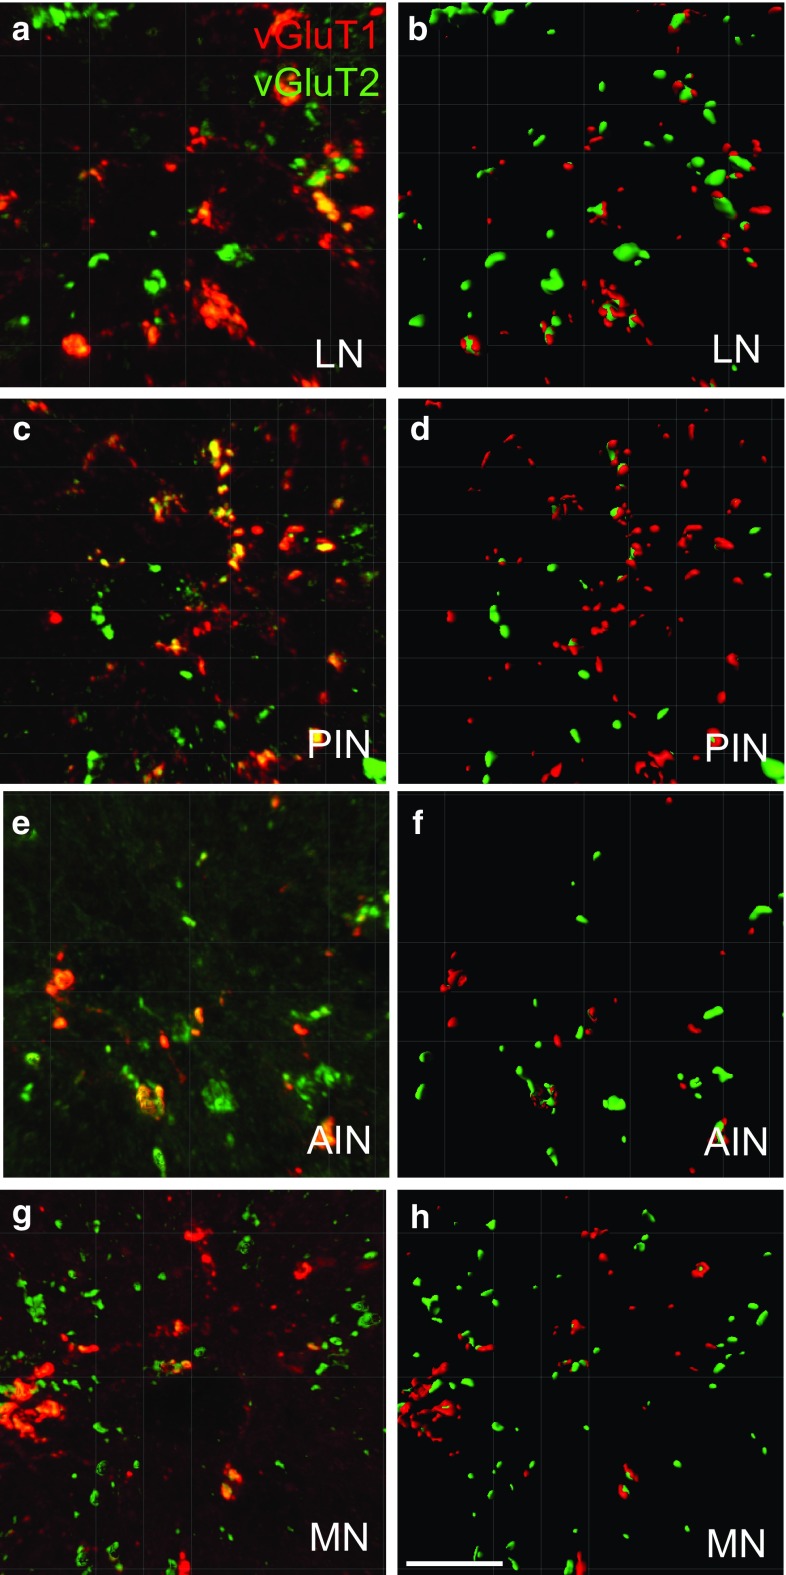
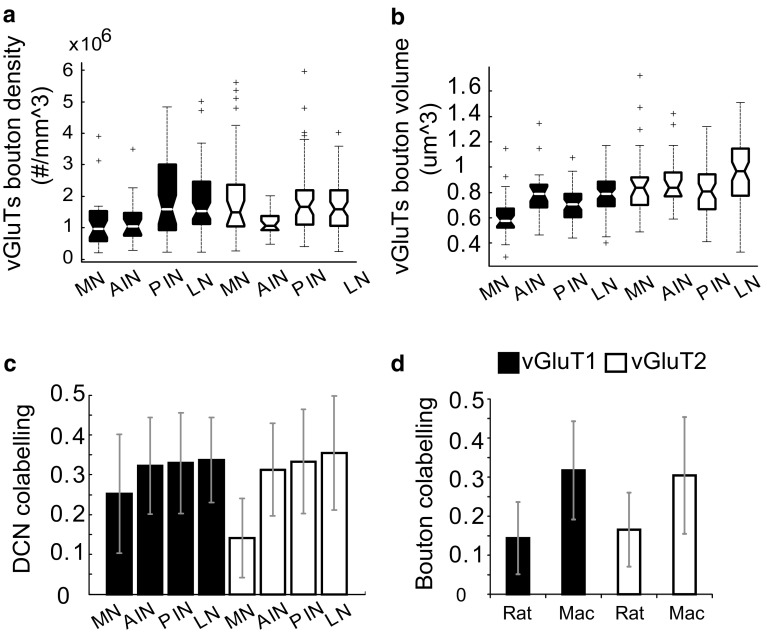
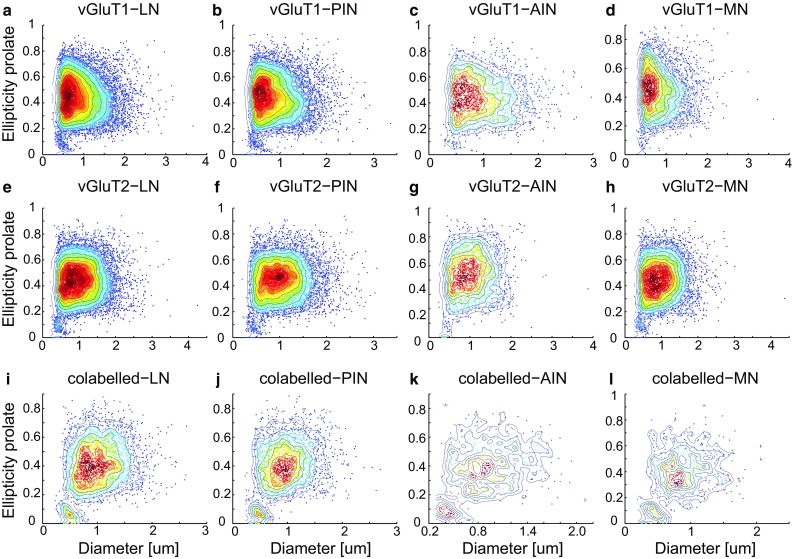
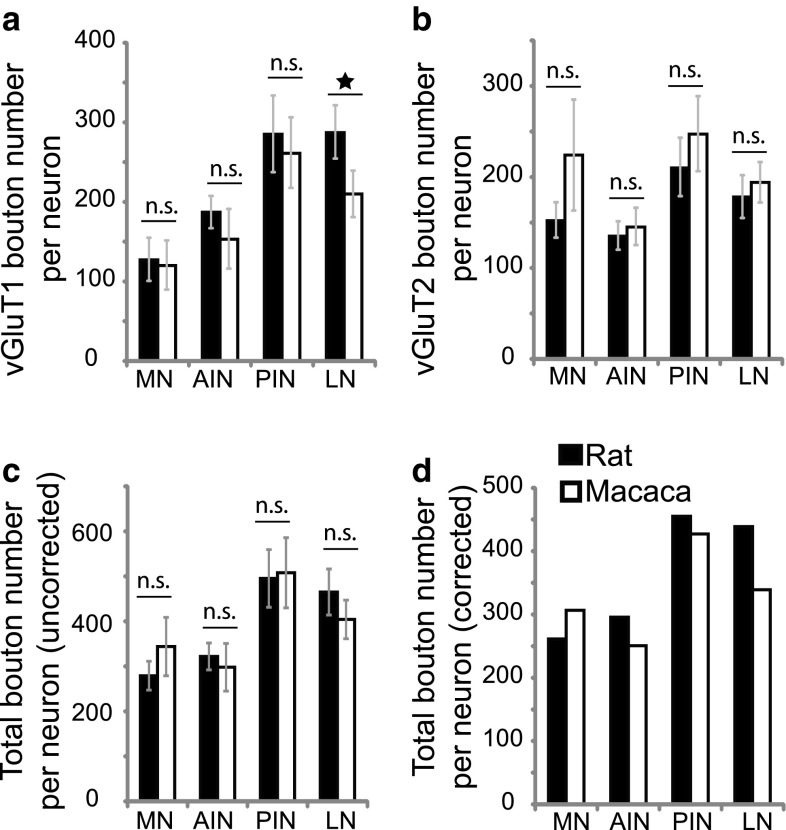
The cerebellar intrinsic connectivity is of remarkable regularity with a similar build repeated many times over. However, several modifications of this basic circuitry occur that can provide important clues to evolutionary adaptations. We have observed differences in the wiring of the cerebellar output structures (the deep cerebellar nuclei, DCN) with higher dendritic length density in the phylogenetically newer DCN. In rats, we showed that an increase in wiring is associated with an increase in the presynaptic vesicular glutamate transporter 1 (vGluT1). In this study, we have extended our analysis to the rhesus monkey and can show similarities and differences between the two species. The similarities confirm a higher density in vGluT1+ boutons in the lateral (LN/dentate) and posterior interpositus nucleus compared to the phylogenetically older DCN. In general, we also observe a lower density of vGluT1 and 2+ boutons in the monkey, which however, yields a similar number of excitatory boutons per neuron in both species. The only exception is the vGlut1+ boutons in the macaque LN/dentate, which showed a significantly lower number of vGluT1+ boutons per neuron. We also detected a higher percentage of co-labelled vGluT1 and 2 boutons in the macaque than we found in the rat. In summary, these results confirm that the hyposcalled dendrites of the monkey LN/dentate also show a lower number of vGluT1+ boutons per neuron. These results provide further support of our model relating the dendritic morphology of the LN/dentate neurons to the morphology of the specially enlarged LN/dentate nucleus in primates.

Keywords: Comparative neuroanatomy; Deep cerebellar nuclei; Lipofuscin fluorescence removal; Quantitative immunofluorescence; Vesicular glutamate transporter.


Conflict of interest statement

The authors declare no competing financial interests.

Figures

Fig. 1
Fig. 1
vGluT1+ and vGluT2+ staining patterns in the cerebellum. The staining pattern of vGluT1, vGluT2 and MAP2 in the cerebellar molecular layer is shown in a, b. The parallel fibers are detected by vGluT1 antibody (red), while the climbing fiber terminals are detected by vGluT2 antibody (green). The dendrites of Purkinje cells are labelled by MAP2 (Microtubule-associated protein 2, blue) (a, b). The colocalization analysis of vGluT1 and vGluT2 is shown in c, with Pearson’s coefficient (PC) − 0.17. The vGluT1, vGluT2 and PCP2 staining pattern in DCN is shown in d, e. The Purkinje cell axons are labelled by PCP2 in blue. The excitatory presynapses are labelled by vGluT1 (red) or vGluT2 (green) or both. The colocalization analysis of the vGluT1 and vGluT2 in DCN is shown in f and yields a PC of 0.47. Another example from the DCN is shown in g, h. The vGluT1, vGluT2 and MAP2 staining shows that the majority of excitatory boutons labelled by vGluT1 (red) or vGluT2 (green) contact the DCN dendrites labelled by MAP2 (blue) (g, h). The pearson’s coefficient of 0.69 indicates colocalization of vGluT1 and vGluT2 in the DCN (i). Scale bar in h is 10 μm and applies also to images (a, b, d, e, g)
Fig. 2
Fig. 2
Examples of vGluT1 and 2 staining in the monkey DCN. Comparison of original microscopic views (a, c, e, g) and surface-rendered views (b, d, f, h) from vGluT1 and vGluT2 stained boutons in different nuclei. The Ridler–Calvard algorithm was used for the red channel, vGluT1, while the thresholding for vGluT2 was user defined at 68/255. Scale bar 10 μm in h applies to all other images as well
Fig. 3
Fig. 3
Boxplots of the density, volume and co-labelling of vGluT1- and vGluT2-stained boutons in different nuclei. ac The results from the rhesus monkey DCN. a The density of vGluT1 and vGluT2 profiles. The vGluT1 density is highest in LN/dentate and PIN and lowest in MN and AIN (p = 1.87 × 10−6). The vGluT2 density is comparable between nuclei (p = 0.049) except for a lower density in the AIN. b The volumes of vGluT1 and 2 profiles. The mean vGluT1 and vGluT2 bouton volumes are 0.7 μm3 and 0.9 μm3, respectively. c Co-labelled percentage of vGluT1 and vGluT2 is compared in different nuclei of the monkey, with the average value of 30% for vGluT1 and 31% for vGluT2. d The co-labelling of vGluT1 and vGluT2 is significantly lower in the rat (around 15%) than in the monkey
Fig. 4
Fig. 4
Intensity color-coded scatter plots. Scatter plots of two shape parameters (ellipticity prolate and diameter) and their relation to the profile diameters for vGluT1 (ad) and vGluT2 (eh). Plotted are the values for the different DCN subnuclei. The overall pattern is very similar, with one large cluster encompassing most of the profiles and one smaller cluster (to the lower left of the larger cluster) showing special subpopulations. The co-labelled boutons show similar shapes between nuclei (il). The color coding indicates the intensity of the scatter plot. Red represents higher and blue represents lower intensities
Fig. 5
Fig. 5
Bouton number per individual DCN neuron. The vGluT1- and vGluT2-labelled boutons are normalized by the neuronal density and compared in the rat and monkey DCN. The vGluT1 bouton number per neuron is similar in the rat and monkey, except in the LN in which the (95% confidence intervals) error bars do not overlap (a). The vGluT2-labelled bouton per neuron is similar in the rat and monkey DCN (b). The sum of vGluT1 and vGluT2 (uncorrected total) bouton number per neuron (c) was adjusted to remove the twice counted double-labelled boutons. This was done by subtracting the co-labelled vGluT1 bouton number per neuron from the total vGluT1 bouton number per neuron and then adding the total vGluT2 bouton number per neuron (d, “corrected”). In the monkey, the total bouton number per neuron is highest in the PIN, with a value of 427 boutons per neuron

References

    1. Aarts E, Verhage M, Veenvliet JV, Dolan CV, van der Sluis S. A solution to dependency: using multilevel analysis to accommodate nested data. Nat Neurosci. 2014;17:491–496. doi: 10.1038/nn.3648. - DOI - PubMed
    1. Billinton N, Knight AW. Seeing the wood through the trees: a review of techniques for distinguishing green fluorescent protein from endogenous autofluorescence. Anal Biochem. 2001;291:175–197. doi: 10.1006/abio.2000.5006. - DOI - PubMed
    1. Boele HJ, Koekkoek SK, De Zeeuw CI, Ruigrok TJ. Axonal sprouting and formation of terminals in the adult cerebellum during associative motor learning. J Neurosci. 2013;33:17897–17907. doi: 10.1523/JNEUROSCI.0511-13.2013. - DOI - PMC - PubMed
    1. Boulland JL, Qureshi T, Seal RP, Rafiki A, Gundersen V, Bergersen LH, Fremeau RT, Jr, Edwards RH, Storm-Mathisen J, Chaudhry FA. Expression of the vesicular glutamate transporters during development indicates the widespread corelease of multiple neurotransmitters. J Comp Neurol. 2004;480:264–280. doi: 10.1002/cne.20354. - DOI - PubMed
    1. Braitenberg V, Schüz A. Cortex: statistics and geometry of neuronal connectivity. Berlin: Springer; 1998.

LinkOut - more resources