

Exposure time versus cytotoxicity for anticancer agents
- PMID: 31102023
- PMCID: PMC8127868
- DOI: 10.1007/s00280-019-03863-w
Exposure time versus cytotoxicity for anticancer agents
Abstract
Purpose: Time is a critical factor in drug action. The duration of inhibition of the target or residence time of the drug molecule on the target often guides drug scheduling.
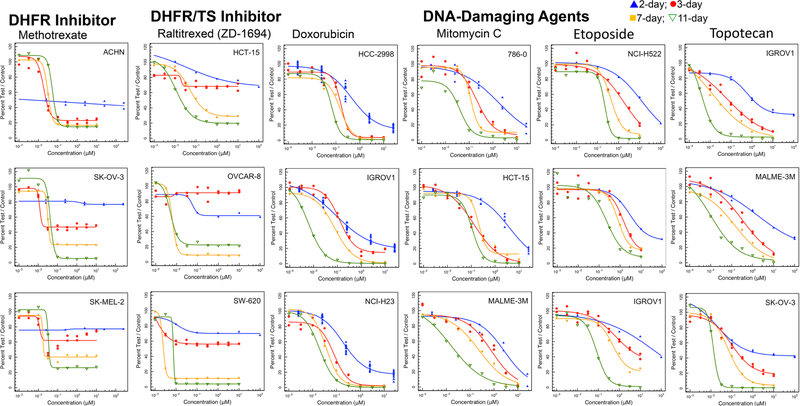
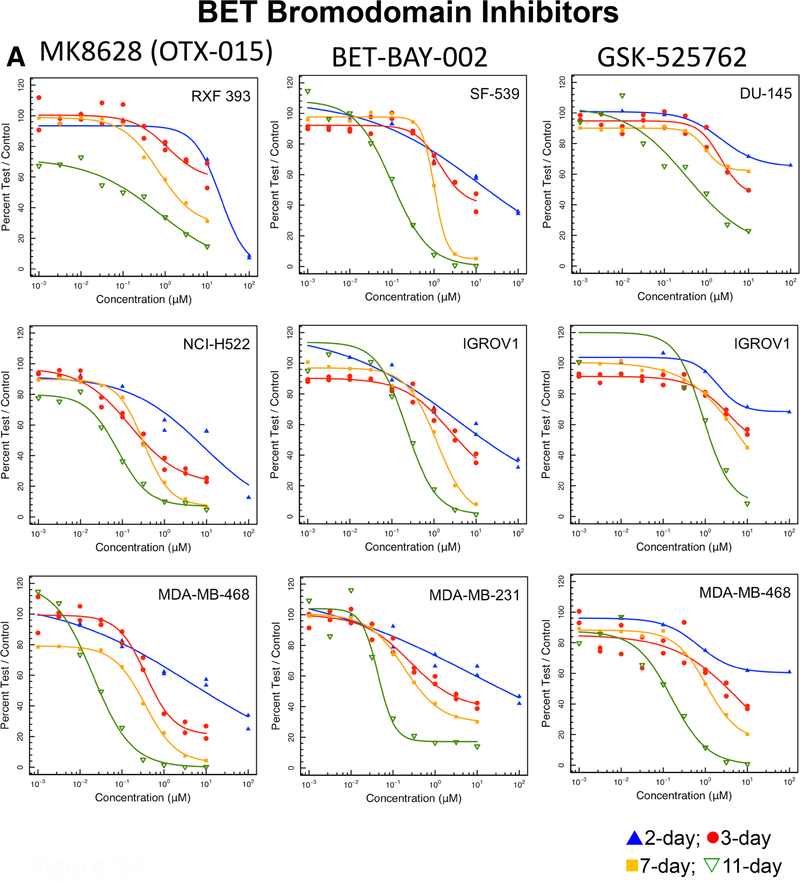
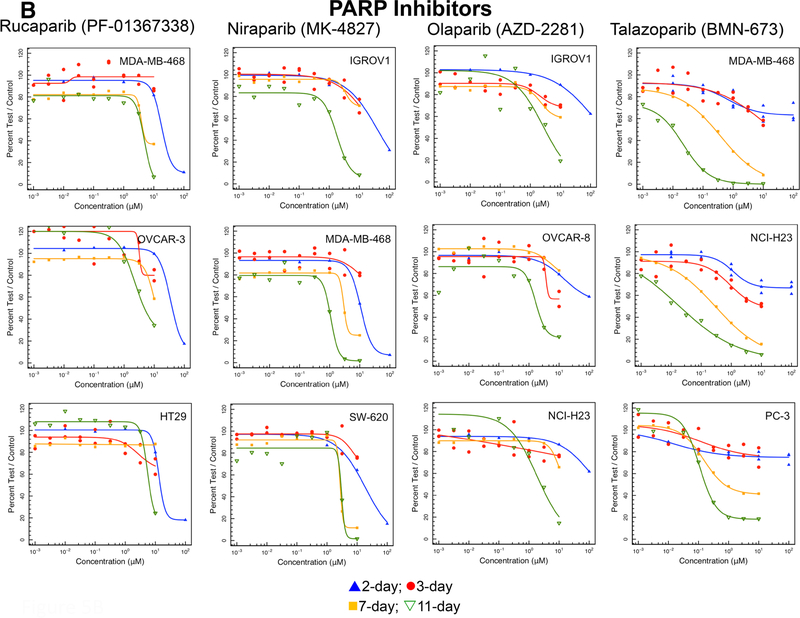
Methods: The effects of time on the concentration-dependent cytotoxicity of approved and investigational agents [300 compounds] were examined in the NCI60 cell line panel in 2D at 2, 3, 7 and in 3D 11 days.
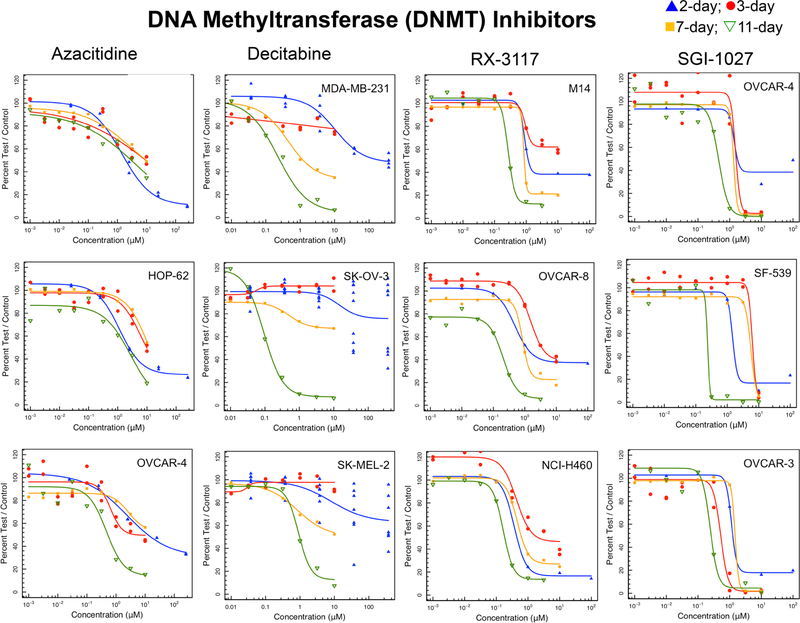
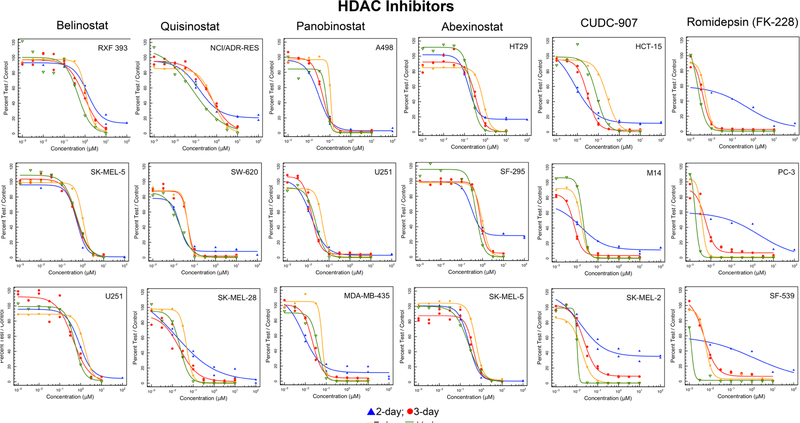
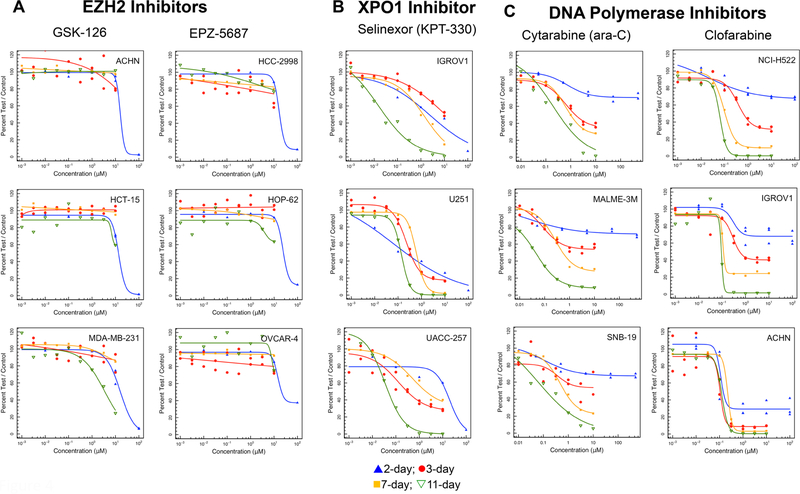
Results: There was a moderate positive linear relationship between data from the 2-day NCI60 screen and the 3-, 7- and 11-day and a strong positive linear relationship between 3-, 7- and 11-day luminescence screen IC50s by Pearson correlation analysis. Cell growth inhibition by agents selective for a specific cell cycle phase plateaued when susceptible cells were growth inhibited or killed. As time increased the depth of cell growth inhibition increased without change in the IC50. DNA interactive agents had decreasing IC50s with increasing exposure time. Epigenetic agents required longer exposure times; several were only cytotoxic after 11 days' exposure. For HDAC inhibitors, time had little or no effect on concentration response. There were potency differences amongst the three BET bromodomain inhibitors tested, and an exposure duration effect. The PARP inhibitors, rucaparib, niraparib, and veliparib reached IC50s < 10 μM in some cell lines after 11 days.
Conclusions: The results suggest that variations in compound exposure time may reflect either mechanism of action or compound chemical half-life. The activity of slow-acting compounds may optimally be assessed in spheroid models that can be monitored over prolonged incubation times.
Keywords: Concentration times time; CxT; Epigenetic agents; NCI60.
Conflict of interest statement
Compliance with ethical standards
Figures
Similar articles
-
HTS384 NCI60: The Next Phase of the NCI60 Screen.Cancer Res. 2024 Aug 1;84(15):2403-2416. doi: 10.1158/0008-5472.CAN-23-3031. Cancer Res. 2024. PMID: 38861359 Free PMC article.
-
Analysis of Food and Drug Administration-approved anticancer agents in the NCI60 panel of human tumor cell lines.Mol Cancer Ther. 2010 May;9(5):1451-60. doi: 10.1158/1535-7163.MCT-10-0106. Epub 2010 May 4. Mol Cancer Ther. 2010. PMID: 20442306 Free PMC article.
-
Synthesis and Evaluation of 2-Naphthaleno trans-Stilbenes and Cyanostilbenes as Anticancer Agents.Anticancer Agents Med Chem. 2018;18(4):556-564. doi: 10.2174/1871521409666170412115703. Anticancer Agents Med Chem. 2018. PMID: 28403783 Free PMC article.
-
BET inhibitors: a novel epigenetic approach.Ann Oncol. 2017 Aug 1;28(8):1776-1787. doi: 10.1093/annonc/mdx157. Ann Oncol. 2017. PMID: 28838216 Review.
-
Rituximab: a review of its use in non-Hodgkin's lymphoma and chronic lymphocytic leukaemia.Drugs. 2003;63(8):803-43. doi: 10.2165/00003495-200363080-00005. Drugs. 2003. PMID: 12662126 Review.
Cited by
-
HTS384 NCI60: The Next Phase of the NCI60 Screen.Cancer Res. 2024 Aug 1;84(15):2403-2416. doi: 10.1158/0008-5472.CAN-23-3031. Cancer Res. 2024. PMID: 38861359 Free PMC article.
-
The Influence of Paracetamol on the Penetration of Sorafenib and Sorafenib N-Oxide Through the Blood-Brain Barrier in Rats.Eur J Drug Metab Pharmacokinet. 2020 Dec;45(6):801-808. doi: 10.1007/s13318-020-00639-z. Eur J Drug Metab Pharmacokinet. 2020. PMID: 32776310 Free PMC article.
-
Computationally Guided Design, Synthesis, and Evaluation of Novel Non-Hydroxamic Histone Deacetylase Inhibitors, Based on N-Trifluoroacetamide as a Zinc-Binding Group, Against Breast Cancer.Pharmaceuticals (Basel). 2025 Feb 28;18(3):351. doi: 10.3390/ph18030351. Pharmaceuticals (Basel). 2025. PMID: 40143128 Free PMC article.
-
In vivo assessment of the drug interaction between sorafenib and paracetamol in rats.Cancer Chemother Pharmacol. 2020 Jun;85(6):1039-1048. doi: 10.1007/s00280-020-04075-3. Epub 2020 May 11. Cancer Chemother Pharmacol. 2020. PMID: 32394097 Free PMC article.
-
Drug-Eluting Porous Embolic Microspheres for Trans-Arterial Delivery of Dual Synergistic Anticancer Therapy for the Treatment of Liver Cancer.Adv Healthc Mater. 2023 Dec;12(30):e2301548. doi: 10.1002/adhm.202301548. Epub 2023 Jun 26. Adv Healthc Mater. 2023. PMID: 37315950 Free PMC article.
References
-
- Perego P, Hempel G, Linder S, Bradshaw TD, Larsen AK, Peters GJ, Phillips RM, on behalf of the EORTC PAMM Group (2018) Cellular pharmacology studies of anticancer agents: recommendations from the EORTC-PAMM group. Cancer Chemother Pharmacol 81:427–41 - PubMed
-
- Henderson ES, Adamson RH, Denham C, Oliverio VT (1965) The metabolic fate of tritiated methotrexate I. absorption, excretion and distribution in mice, rats, dogs and monkeys. Cancer Res 25:1008–1017 - PubMed
-
- Ludwig R, Alberts DS (1984) Chemical and biological stability of anticancer drugs used in a human tumor clonogenic assay. Cancer Chemother Pharmacol 12:142–145 - PubMed
Publication types
MeSH terms
Substances
Grants and funding
LinkOut - more resources
Full Text Sources
Research Materials
