Review
. 2019 Jun;11(3):409-418.
doi: 10.1007/s12551-019-00539-w. Epub 2019 May 17.

Function-related conformational dynamics of G protein-coupled receptors revealed by NMR

Affiliations
Review

Function-related conformational dynamics of G protein-coupled receptors revealed by NMR

Takumi Ueda et al. Biophys Rev. 2019 Jun.

Abstract

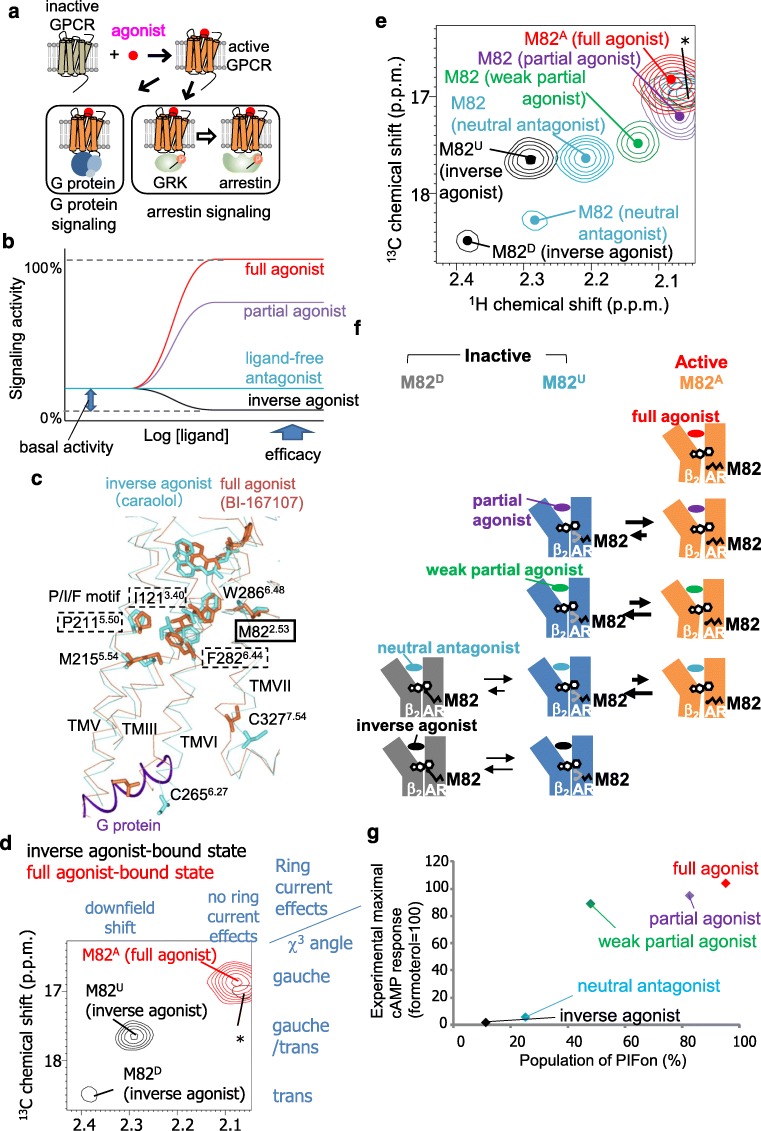
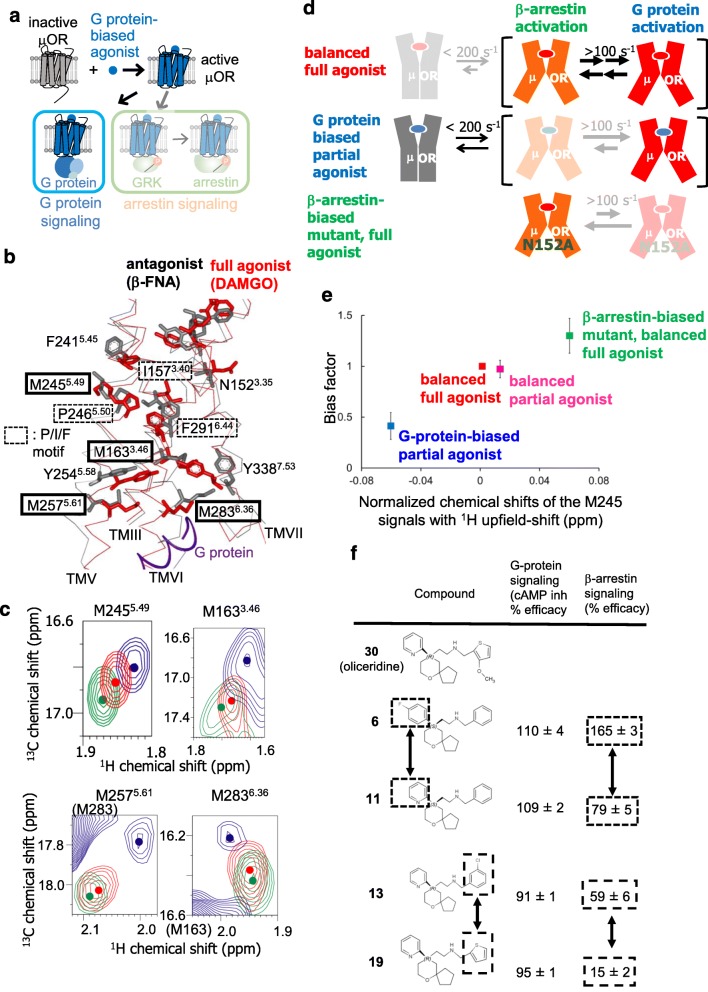
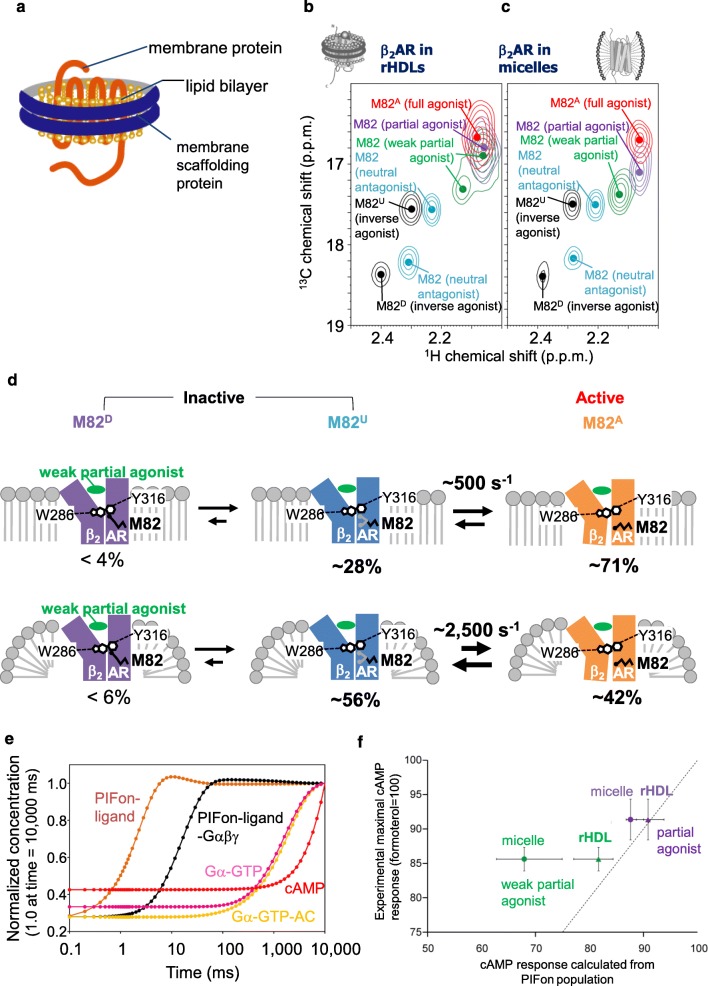
G protein-coupled receptors (GPCRs) function as receptors for various neurotransmitters, hormones, cytokines, and metabolites. GPCR ligands impart differing degrees of signaling in the G protein and arrestin pathways, in phenomena called biased signaling, and each ligand for a given GPCR has a characteristic level of ability to activate or deactivate its target, which is referred to as its efficacy. The ligand efficacies and biased signaling of GPCRs remarkably affect the therapeutic properties of the ligands. However, these features of GPCRs can only be partially understood from the crystallography data, although numerous GPCR structures have been solved. NMR analyses have revealed that GPCRs have multiple interconverting substates, exchanging on various timescales, and that the exchange rates are related to the ligand efficacies and biased signaling. In addition, NMR analyses of GPCRs in the lipid bilayer environment of rHDLs revealed that the exchange rates are modulated by the lipid bilayer environment, highlighting the importance of the function-related dynamics in the lipid bilayer. In this review, we will describe several solution NMR studies that have clarified the conformational dynamics related to the ligand efficacy and biased signaling of GPCRs.

Keywords: Adrenergic receptor; Membrane protein; Nanodiscs; Nuclear magnetic resonance; Opioid receptor.


Conflict of interest statement

Takumi Ueda declares that he has no conflict of interest. Yutaka Kofuku declares that he has no conflict of interest. Junya Okude declares that he has no conflict of interest. Shunsuke Imai declares that he has no conflict of interest. Yutaro Shiraishi declares that he has no conflict of interest. Ichio Shimada declares that he has no conflict of interest.

Figures

Fig. 1
Fig. 1
Ligand efficacy-related conformational dynamics of β2 adrenergic receptor. a Schematic diagram of GPCR signaling. Activated GPCRs induce signal transduction mediated by G proteins. In addition, activated GPCRs may be phosphorylated by GPCR kinases (GRKs), and the phosphorylated GPCRs stimulate G protein-independent signal transduction mediated by arrestin. b Plots of signaling activity versus ligand concentration, representing different common GPCR efficacies. c The crystal structure of β2AR with an inverse agonist, carazolol (PDB code: 2RH1) (cyan), and that with a full agonist, BI-167107, and a G protein (PDB code: 3SN6) (orange) are overlaid at TM2 and shown in side views with the extracellular sides on top, viewed from TM6. The middle regions of TM2, TM3, TM5, TM6, and TM7 are shown in Cα traces, and the side-chains of M822.53, I1213.40, P2115.50, M2155.54, C2656.27, F2826.44, W2866.48, and C3277.54, and the bound ligands are depicted by sticks. The C-terminal region of the α subunit of the G-protein is shown as a purple ribbon. d Overlay of the 1H-13C SOFAST-HMQC spectra of [α,β,β-2H3-, methyl-13C-Met] β2AR in the carazolol-bound (black) and formoterol-bound (red) states. The relationship between the 1H chemical shifts and the local environments and that between the 13C chemical shifts and the side-chain conformations are shown on the top and right side of the spectra, respectively. e Overlay of the 1H-13C SOFAST-HMQC spectra of [α,β,β-2H3-, methyl-13C-Met] β2AR in the carazolol-bound (black), alprenolol-bound (cyan), tulobuterol-bound (green), clenbuterol-bound (violet), and formoterol-bound (red) states. Only the regions with M82 resonances are shown. The centers of the resonances from M82 are indicated with dots. f Proposed mechanism for the various efficacies of β2AR with different ligands. β2AR adopts three conformations with different M82 environments: the PIFon conformation, which corresponds to the M82A signal, induces signaling, whereas the PIFoff1 and PIFoff2 conformations, which correspond to the M82U and M82D signals, do not. In the full agonist formoterol–bound state, β2AR primarily adopts the PIFon conformation, exhibiting almost the full efficacy of β2AR. In the partial agonist clenbuterol–bound and partial agonist tulobuterol–bound states, β2AR exists in equilibrium between the PIFon and PIFoff2 conformations, exhibiting significant signaling with reduced efficacies. In the tulobuterol-bound state, where the efficacy is lower than that of the clenbuterol-bound state, the population of the PIFon conformation is smaller. In the neutral antagonist alprenolol–bound state, β2AR primarily adopts the PIFoff1 and PIFoff2 conformations, in equilibrium with a small population of the PIFon conformation. The presence of the small population of the PIFon conformation accounts for the basal activity of β2AR. In the inverse agonist carazolol–bound state, β2AR exists in equilibrium between the PIFoff1 and PIFoff2 conformations, exhibiting the inhibition of the basal activities. g Plots of the reported maximum cAMP responses against the population of PIFon in each ligand-bound state, calculated from the M82 signals
Fig. 2
Fig. 2
Biased signaling–related conformational dynamics of μ-opioid receptor. a Schematic diagram of signaling mediated by μOR in the presence of the G protein–biased agonist. b The crystal structures of μOR with an irreversible antagonist, β-funaltrexamine (PDB code: 4DKL) (black), and with a full agonist, BU72, and a G protein (PDB code: 6GDG) (red) are shown in side views with the extracellular sides on the upper sides, viewed from TMVI. The middle regions of TMIII, TMV, TMVI, and TMVII are shown in Cα traces, and the side-chains of N1523.35, I1573.40, M1633.46, F2415.45, M2455.49, P2465.50, M2575.61, M2836.36, F2916.44, and Y3387.53, and the bound ligands are depicted by sticks. The C-terminal region of the α subunit of the G protein is shown as a red ribbon. c Overlaid 1H-13C HMQC spectra of the [2H-8AA, αβ-2H-, methyl-13C-Met] μOR in the DAMGO-bound (red) and oliceridine-bound (blue) states and that of the μOR/N1523.35A mutant in the DAMGO-bound state (green). Only the regions with M2455.49, M2575.61, M2836.36, and the 1H upfield-shifted M1633.46 resonances are shown. The centers of the resonances from M1633.46, M2455.49, M2575.61, and M2836.36 are indicated with dots. d Mechanisms leading to the functional selectivity of μOR for different ligands. In the balanced full agonist state with DAMGO bound, μOR primarily adopts the active conformation (red), in which the intracellular surface is characterized by multiple substates with exchange rates larger than 100 s−1. In the G protein–biased partial agonist TRV130–bound state, MOR exists in an equilibrium between the inactive (gray) and active conformations, with exchange rates smaller than 200 s−1, and the equilibrium within the active substates is shifted toward the conformation preferred for G protein activation. In the DAMGO-bound state of the MOR N1523.35A mutant, where MOR adopts only the active conformation, the equilibrium among the active substates is shifted toward the conformation preferred for arrestin activation. e Correlation between the normalized chemical shifts of the M2455.49 NMR signals and the value of the bias factor, which is the ratio of the β-arrestin signaling efficacy to the G protein signaling efficacy. f Structure-function relationships of derivatives of the MOR ligand, oliceridine. Modification of either of the two aromatic rings that are highlighted in boxes results in the selective modulation of β-arrestin signaling
Fig. 3
Fig. 3
Function-related dynamics of β2AR in the lipid bilayer environment. a Schematic representation of an rHDL. b Overlaid 1H–13C HMQC spectra of [2H-9AA, αβγ-2H-, methyl-13C-Met] β2AR in rHDLs bound to the inverse agonist carazolol (black), the neutral antagonist alprenolol (cyan), the weak partial agonist tulobuterol (green), the partial agonist clenbuterol (violet), or the full agonist formoterol (red). c Overlaid 1H–13C HMQC spectra of [2H-9AA, αβγ-2H-, methyl-13C-Met] β2AR in DDM micelles, colored as in panel (b). In b and c, only the regions with M82 resonances are shown, and the centers of the M82 resonances are indicated by dots. d Differences between the corresponding exchange rates and populations of the conformational substates in β2AR, in nanodiscs and in DDM micelles. The upper and lower panels depict the conformational equilibria of the β2AR complex with the weak partial agonist tulobuterol, in nanodiscs and in DDM micelles, respectively. Approximate relative populations of the three states are indicated below the drawings. e Simulation of the G protein signaling cascade of β2AR. Calculated time course of the concentrations of β2AR in the PIFon conformation, in the G protein-free form (PIFon-ligand), the β2AR -Gαβγ complex (PIFon-ligand-Gαβγ), the Gα in the GTP-bound form (Gα-GTP), the Gα-adenylate cyclase complex (Gσ-GTP-AC), and cAMP, upon activation by tulobuterol. The concentrations were normalized by those at 10,000 ms. f Correlation between the simulated cAMP response based on the PIFon populations observed in the M82 NMR signal and the experimental maximal cAMP responses. Plots of the relative amounts (percentages) of cAMP formed upon activation of CHO-K1 cells by the partial agonists tulobuterol and clenbuterol, which were previously identified as such by cAMP accumulation assays, versus the relative concentration of cAMP in activated cells, calculated from the measured populations of PIFon. Both values were normalized to those in the fully active states and thus are expected to be close to each other whenever the PIFon populations determined by NMR are similar to those in vivo. Circles and triangles represent the cAMP responses, based on the PIFon populations of β2AR in DDM micelles and in nanodiscs, respectively. The dotted line represents the hypothetical situation where the simulated cAMP response would be equal to the experimental maximal cAMP response. The error bars along the horizontal axis represent the cAMP concentrations, calculated based on the lowest and highest PIFon populations estimated from the M82 NMR signals

Similar articles

Cited by

References

    1. Ballesteros JA, Weinstein H. Integrated methods for the construction of three-dimensional models and computational probing of structure-function relations in G-protein coupled receptors. Methods Neurosci. 1995;25:366–428.
    1. Bayburt TH, Grinkova YV, Sligar SG. Self-assembly of discoidal phospholipid bilayer nanoparticles with membrane scaffold proteins. Nano Lett. 2002;2:853–856.
    1. Bhabha G, Lee J, Ekiert DC, Gam J, Wilson IA, Dyson HJ, Benkovic SJ, Wright PE. A dynamic knockout reveals that conformational fuctuations influence the chemical step of enzyme catalysis. Science. 2011;332:234–238. - PMC - PubMed
    1. Bohn LM, Lefkowitz RJ, Gainetdinov RR, Peppel K, Caron MG, Lin FT. Enhanced morphine analgesia in mice lacking β-arrestin 2. Science. 1999;286:2495–2498. - PubMed
    1. Brüschweiler S, Yang Q, Run C, Chou JJ. Substrate-modulated ADP/ATP-transporter dynamics revealed by NMR relaxation dispersion. Nat Struct Mol Biol. 2015;22:636–641. - PMC - PubMed

LinkOut - more resources