. 2019 Sep 7;40(34):2883-2896.
doi: 10.1093/eurheartj/ehz235.

Serum metabolic signatures of coronary and carotid atherosclerosis and subsequent cardiovascular disease

Affiliations

Serum metabolic signatures of coronary and carotid atherosclerosis and subsequent cardiovascular disease

Ioanna Tzoulaki et al. Eur Heart J. .

Abstract

Aims: To characterize serum metabolic signatures associated with atherosclerosis in the coronary or carotid arteries and subsequently their association with incident cardiovascular disease (CVD).

Methods and results: We used untargeted one-dimensional (1D) serum metabolic profiling by proton nuclear magnetic resonance spectroscopy (1H NMR) among 3867 participants from the Multi-Ethnic Study of Atherosclerosis (MESA), with replication among 3569 participants from the Rotterdam and LOLIPOP studies. Atherosclerosis was assessed by coronary artery calcium (CAC) and carotid intima-media thickness (IMT). We used multivariable linear regression to evaluate associations between NMR features and atherosclerosis accounting for multiplicity of comparisons. We then examined associations between metabolites associated with atherosclerosis and incident CVD available in MESA and Rotterdam and explored molecular networks through bioinformatics analyses. Overall, 30 1H NMR measured metabolites were associated with CAC and/or IMT, P = 1.3 × 10⁻¹⁴ to 1.0 × 10⁻⁶ (discovery) and P = 5.6 × 10⁻¹⁰ to 1.1 × 10⁻² (replication). These associations were substantially attenuated after adjustment for conventional cardiovascular risk factors. Metabolites associated with atherosclerosis revealed disturbances in lipid and carbohydrate metabolism, branched chain, and aromatic amino acid metabolism, as well as oxidative stress and inflammatory pathways. Analyses of incident CVD events showed inverse associations with creatine, creatinine, and phenylalanine, and direct associations with mannose, acetaminophen-glucuronide, and lactate as well as apolipoprotein B (P < 0.05).

Conclusion: Metabolites associated with atherosclerosis were largely consistent between the two vascular beds (coronary and carotid arteries) and predominantly tag pathways that overlap with the known cardiovascular risk factors. We present an integrated systems network that highlights a series of inter-connected pathways underlying atherosclerosis.

Keywords: Atherosclerosis; Coronary artery calcium; Epidemiological studies; Intima-media thickness; Metabolic phenotyping; Metabolomics.


Figures

Figure 1
Figure 1
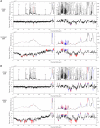
Manhattan-type plot showing the analysis of the 30 590 Carr-Purcell-Meiboom-Gill nuclear magnetic resonance (upper panel) and one-dimensional nuclear magnetic resonance (lower panel) features with (A) coronary artery calcium and (B) intima-media thickness in minimal adjusted model (Model 1: age, sex, cohort, and ethnicity) and fully adjusted model (Model 2: low and high-density lipoproteins, lipid and blood pressure lowering treatment, systolic blood pressure, smoking status, and diabetes). The signed −log10 P-value (on the y-axis) is derived from Model 1. The black dots represent the data points remaining significant after multiple testing correction (1.8 × 10⁻⁵ for one-dimensional nuclear magnetic resonance and 3.7 × 10⁻⁶ for Carr-Purcell-Meiboom-Gill nuclear magnetic resonance, respectively), the blue dots are Model 1 significant in MESA and replicated in the Rotterdam Study and LOLIPOP (with a P-value <0.05), and the red dots are Model 2 significant. The horizontal axis is the nuclear magnetic resonance chemical shift (in ppm). Median spectra intensity is given in the pooled dataset non-missing for coronary artery calcium/intima-media thickness together with chemical compounds. Nuclear magnetic resonance assignments: 1, lipids (low-density lipoprotein and very low-density lipoprotein, CH3-CH2-R, CH3-CH2-C=); 2, isoleucine; 3, leucine; 4, valine; 5, lipids (low-density lipoprotein and very low-density lipoprotein, CH3-CH2-R, (CH2)n); 6, lactate; 7, alanine; 8, lipids (low-density lipoprotein and very low-density lipoprotein, CH2-CH2-C=, CH2-CH2-CO); 9, arginine; 10, lysine; 11, acetate; 12, lipids (CH2-CH2-CH=CH); 13, N-acetylglycoproteins; 14, methionine; 15, glutamine; 16, lipids (CH2-CO); 17, 3-hydroxybutyrate; 18, glutamate; 19, pyruvate; 20, 5-oxoproline; 21, citrate; 22, lipids (CH=CH-CH2-CH=CH); 23, aspartate; 24, albumin; 25, N,N-dimethylglycine; 26, creatine; 27, creatinine; 28, phenylalanine; 29, histidine; 30, tyrosine; 31, choline; 32, beta-glucose; 33, beta-glucose; 34, glycine; 35, glycerol; 36, myo-inositol; 37, mannose; 38, 1,5-anhydrosorbitol; 39, glyceryl groups of lipids; 40, acetaminophen+ glucuronide; 41, lipids (CH=CH); 42, uridine; 43, 1-methyl histidine; 44, 3-methylhistidine; and 45, formate.
Figure 2
Figure 2
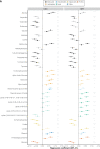
(A) Regression coefficients per standard deviation (95% confidence interval) between one-dimensional nuclear magnetic resonance metabolites associated with coronary artery calcium and/or intima-media thickness using the sentinel (most significant) ppm within each nuclear magnetic resonance region (cluster) pooled across all three cohorts (N = 7436) and coronary artery calcium and intima-media thickness. The solid lines represent Model 1 (adjusted for age, sex, cohort, and ethnicity) and the dotted lines Model 2 (further adjusted for low-density lipoprotein and high-density lipoprotein, lipid and blood pressure lowering treatment, systolic blood pressure, smoking status, and diabetes). The significance threshold is given for Models 1 and 2 where *P 0.05, **P 0.01, and ***P 1.8e−05 (metabolome wide significance level for one-dimensional nuclear magnetic resonance data, see Supplementary material online, Table S1). (B) Hazard ratios (95% confidence interval) per standard deviation between the one-dimensional nuclear magnetic resonance metabolites associated with coronary artery calcium and/or intima-media thickness and incident cardiovascular disease events in MESA and Rotterdam studies (N = 630 events). The significance threshold is given for Models 1 and 2 where *P 0.05, **P 0.01, and *** P 0.001.
Figure 2
Figure 2
(A) Regression coefficients per standard deviation (95% confidence interval) between one-dimensional nuclear magnetic resonance metabolites associated with coronary artery calcium and/or intima-media thickness using the sentinel (most significant) ppm within each nuclear magnetic resonance region (cluster) pooled across all three cohorts (N = 7436) and coronary artery calcium and intima-media thickness. The solid lines represent Model 1 (adjusted for age, sex, cohort, and ethnicity) and the dotted lines Model 2 (further adjusted for low-density lipoprotein and high-density lipoprotein, lipid and blood pressure lowering treatment, systolic blood pressure, smoking status, and diabetes). The significance threshold is given for Models 1 and 2 where *P 0.05, **P 0.01, and ***P 1.8e−05 (metabolome wide significance level for one-dimensional nuclear magnetic resonance data, see Supplementary material online, Table S1). (B) Hazard ratios (95% confidence interval) per standard deviation between the one-dimensional nuclear magnetic resonance metabolites associated with coronary artery calcium and/or intima-media thickness and incident cardiovascular disease events in MESA and Rotterdam studies (N = 630 events). The significance threshold is given for Models 1 and 2 where *P 0.05, **P 0.01, and *** P 0.001.
Figure 3
Figure 3
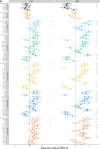
Associations between lipoprotein particles from Bruker analysis in MESA (N = 3753). The solid lines represent Model 1 and the dashed lined Model 3. (A) The regression coefficient (95% confidence interval) per standard deviation of each lipoprotein between coronary artery calcium and each nuclear magnetic resonance lipoprotein feature was adjusted for age, sex, ethnicity, and analysis phase (Model 1) and further adjusted for basic cardiovascular risk factors (diabetes, systolic blood pressure, smoking and medication for hypercholesterolaemia, diabetes or high blood pressure) (Model 3). (B) Hazard ratios (95% confidence interval) for incident cardiovascular disease events (N = 242) and lipoproteins are shown. A significance threshold with adjusted Bonferroni correction is given for Models 1 and 2 where *Padj ≤0.005, **Padj ≤0.001, and ***Padj≤ 0.0001. The P-value Bonferroni corrected by the number of PCs (10) that account for more than 95% of the total variation in the data set. A P <0.05/10 (<0.005) was therefore used to denote statistical significance in these analyses (see Methods section). Analysis of 105 lipoprotein subclasses was carried out including different chemical components of intermediate-density lipoprotein (density 1.006–1.019 kg/L), very low-density lipoprotein (0.950–1.006 kg/L), low-density lipoprotein (density 1.09–1.63 kg/L), and high-density lipoprotein (density 1.063–1.210 kg/L). The low-density lipoprotein sub-fraction was fractionated into six density classes (low-density lipoprotein-1 1.019–1.031 kg/L, low-density lipoprotein-2 1.031–1.034 kg/L, low-density lipoprotein-3 1.034–1.037 kg/L, low-density lipoprotein-4 1.037–1.040 kg/L, low-density lipoprotein-5 1.040–1.044 kg/L, low-density lipoprotein-6 1.044–1.063 kg/L), and the high-density lipoprotein sub-fraction in four density classes (high-density lipoprotein-1 1.063–1.100 kg/L, high-density lipoprotein-2 1.100–1.125 kg/L, high-density lipoprotein-3 1.125–1.175 kg/L, and high-density lipoprotein-4 1.175–1.210 kg/L).
Figure 3
Figure 3
Associations between lipoprotein particles from Bruker analysis in MESA (N = 3753). The solid lines represent Model 1 and the dashed lined Model 3. (A) The regression coefficient (95% confidence interval) per standard deviation of each lipoprotein between coronary artery calcium and each nuclear magnetic resonance lipoprotein feature was adjusted for age, sex, ethnicity, and analysis phase (Model 1) and further adjusted for basic cardiovascular risk factors (diabetes, systolic blood pressure, smoking and medication for hypercholesterolaemia, diabetes or high blood pressure) (Model 3). (B) Hazard ratios (95% confidence interval) for incident cardiovascular disease events (N = 242) and lipoproteins are shown. A significance threshold with adjusted Bonferroni correction is given for Models 1 and 2 where *Padj ≤0.005, **Padj ≤0.001, and ***Padj≤ 0.0001. The P-value Bonferroni corrected by the number of PCs (10) that account for more than 95% of the total variation in the data set. A P <0.05/10 (<0.005) was therefore used to denote statistical significance in these analyses (see Methods section). Analysis of 105 lipoprotein subclasses was carried out including different chemical components of intermediate-density lipoprotein (density 1.006–1.019 kg/L), very low-density lipoprotein (0.950–1.006 kg/L), low-density lipoprotein (density 1.09–1.63 kg/L), and high-density lipoprotein (density 1.063–1.210 kg/L). The low-density lipoprotein sub-fraction was fractionated into six density classes (low-density lipoprotein-1 1.019–1.031 kg/L, low-density lipoprotein-2 1.031–1.034 kg/L, low-density lipoprotein-3 1.034–1.037 kg/L, low-density lipoprotein-4 1.037–1.040 kg/L, low-density lipoprotein-5 1.040–1.044 kg/L, low-density lipoprotein-6 1.044–1.063 kg/L), and the high-density lipoprotein sub-fraction in four density classes (high-density lipoprotein-1 1.063–1.100 kg/L, high-density lipoprotein-2 1.100–1.125 kg/L, high-density lipoprotein-3 1.125–1.175 kg/L, and high-density lipoprotein-4 1.175–1.210 kg/L).
Figure 4
Figure 4
(A) Partial correlations between markers of coronary artery calcium or intima-media thickness in MESA (N = 3948), using sentinel ppm for each one-dimensional or Carr-Purcell-Meiboom-Gill assigned metabolite (N = 35). Metabolite assessed in Carr-Purcell-Meiboom-Gill data. Adjusted analysis controlling for sex, age, ethnicity, and measurement phase. ***The threshold after Bonferroni correction for 560 tests ensuring a Family-Wise Error Rate control at 0.1% (0.001/560), ** at 1% (0.01/560), and * at 5% (0.05/560). (B) Spearman correlation matrix between metabolites associated with coronary artery calcium and/or intima-media thickness (N = 35) and cardiovascular disease risk factors, using the sentinel (most significant) ppm within each nuclear magnetic resonance region (cluster) in MESA (N = 3948) with colour-keyed correlation coefficient. Hierarchical clustering was used to reorder the correlation matrix. The size of the squares is proportional to the significance level; statistical significance was set to a Bonferroni threshold correction ensuring a Family-Wise Error Rate control at 5%. Metabolite detected in the Carr-Purcell-Meiboom-Gill data.
Figure 5
Figure 5
Multicompartmental metabolic network characterizing subclinical atherosclerosis. Metabolites highlighted in strong colours passed the multiple testing correction in MESA (1.8 × 10⁻⁵) and were replicated in independent populations (the Rotterdam Study and LOLIPOP) for Model 1 (adjusted for age, sex, cohort, and ethnicity) in relation to coronary artery calcium and/or intima-media thickness. Nodes and edges in the graph represent metabolites and reactions from the Kyoto Encyclopaedia of Genes and Genomes. Metabolites from Kyoto Encyclopaedia of Genes and Genomes are included in the ‘metabonetwork’ if they were present on the set of shortest paths between the metabolites associated with coronary artery calcium/intima-media thickness. The direction of association between metabolites and coronary artery calcium/intima-media thickness is illustrated in the graph by the orange (direct) and blue (inverse) colours, and was consistent within each pathway. Full names of abbreviations are listed in the Supplementary material online, Table S14.
Take home figure
Take home figure
Metabolites associated at metabolome-wide significant level with at least one measure of atherosclerosis assessed via coronary artery calcium or intima-media thickness before (solid lines) and after (dotted lines) adjustment for conventional cardiovascular risk factors.
None

Comment in

References

    1. Ezzati M, Obermeyer Z, Tzoulaki I, Mayosi BM, Elliott P, Leon DA.. Contributions of risk factors and medical care to cardiovascular mortality trends. Nat Rev Cardiol 2015;12:508–530. - PMC - PubMed
    1. Timmis A, Townsend N, Gale C, Grobbee R, Maniadakis N, Flather M, Wilkins E, Wright L, Vos R, Bax J, Blum M, Pinto F, Vardas P, Goda A, Demiraj AF, Weidinger F, Metzler B, Ibrahimov F, Pasquet AA, Claeys M, Thorton Y, Kusljugic Z, Smajic E, Velchev V, Ivanov N, Antoniades L, Agathangelou P, Táborský M, Gerdes C, Viigima M, Juhani PM, Juilliere Y, Cattan S, Aladashvili A, Hamm C, Kuck K-H, Papoutsis K, Bestehorn K, Foussas S, Giannoulidou G, Varounis C, Kallikazaros I, Kiss RG, Czétényi T, Becker D, Gudnason T, Kearney P, McDonald K, Rozenman Y, Ziv B, Bolognese L, Luciolli P, Boriani G, Berkinbayev S, Rakisheva A, Mirrakhimov E, Erglis A, Jegere S, Marinskis G, Beissel J, Marchal N, Kedev S, Xuereb RG, Tilney T, Felice T, Popovici M, Bax J, Mulder B, Simoons M, Elsendoorn M, Steigen TK, Atar D, Kalarus Z, Tendera M, Cardoso JS, Ribeiro J, Mateus C, Tatu-Chitoiu G, Seferovic P, Beleslin B, Simkova I, Durcikova P, Belicova V, Fras Z, Radelj S, Gonzalez Juanatey JR, Legendre S, Braunschweig F, Kaufmann UP, Rudiger-Sturchler M, Tokgozoglu L, Unver A, Kovalenko V, Nesukay E, Naum A, de Courtelary PT, Martin S, Sebastiao D, Ghislain D, Bardinet I, Logstrup S.. European Society of Cardiology: cardiovascular disease statistics 2017. Eur Heart J 2018;39:508–579. - PubMed
    1. Tzoulaki I, Elliott P, Kontis V, Ezzati M.. Worldwide exposures to cardiovascular risk factors and associated health effects: current knowledge and data gaps. Circulation 2016;133:2314–2333. - PubMed
    1. Libby P, Bornfeldt KE, Tall AR.. Atherosclerosis: successes, surprises, and future challenges. Circ Res 2016;118:531–534. - PMC - PubMed
    1. Herrington DM, Mao C, Parker SJ, Fu Z, Yu G, Chen L, Venkatraman V, Fu Y, Wang Y, Howard TD, Jun G, Zhao CF, Liu Y, Saylor G, Spivia WR, Athas GB, Troxclair D, Hixson JE, Vander Heide RS, Wang Y, Van Eyk JE.. Proteomic architecture of human coronary and aortic atherosclerosis. Circulation 2018;137:2741–2756. - PMC - PubMed

Publication types