

Dissimilarities across age groups in the associations between complementary feeding practices and child growth: Evidence from rural Togo
- PMID: 31102494
- PMCID: PMC6859998
- DOI: 10.1111/mcn.12843
Dissimilarities across age groups in the associations between complementary feeding practices and child growth: Evidence from rural Togo
Abstract
Adequate complementary feeding (CF) practices are essential for achieving optimal growth but challenging to measure comprehensively. This paper describes CF practices in 2,034 children aged 6-23 months and investigates their relationships with length-for-age z-score (LAZ) and stunting, using cross-sectional data collected from May to July 2014 in rural Northern Togo. The World Health Organization infant and young child feeding indicators were computed, along with ancillary indicators on feeding style and timing of introduction of complementary foods. The associations between those indicators and children's LAZ and stunting were assessed using linear and logistic regressions after stratification by age group and adjustment for children, maternal, and household characteristics. CF practices were suboptimal, and their associations with child's growth varied across indicators and age groups. In children aged 6-11 months, reaching the minimum dietary diversity and the minimum acceptable diet was associated with higher LAZ (p < .05). In 18- to 23-month-old children, only the consumption of iron-rich food was associated with both LAZ (p = .02) and stunting (p = .05). The late introduction of family foods was associated with higher odds of being stunted and lower LAZ in children aged 12-17 months (p < .001). The untimely introduction of porridge was associated with higher odds of stunting in children aged 9-23 months (p < .05). Unexpectedly, helping the child to eat was negatively associated with linear growth in all age groups. These findings nurture the ongoing process of review of the World Health Organization infant and young child feeding indicators showing that, in their current version, they hardly capture the links between CF and child's growth at different ages.
Keywords: Togo; complementary feeding practices; feeding style; infant and young child feeding indicators; linear growth; stunting.
© 2019 John Wiley & Sons Ltd.
Conflict of interest statement
The authors declare that they have no conflicts of interest.
Figures
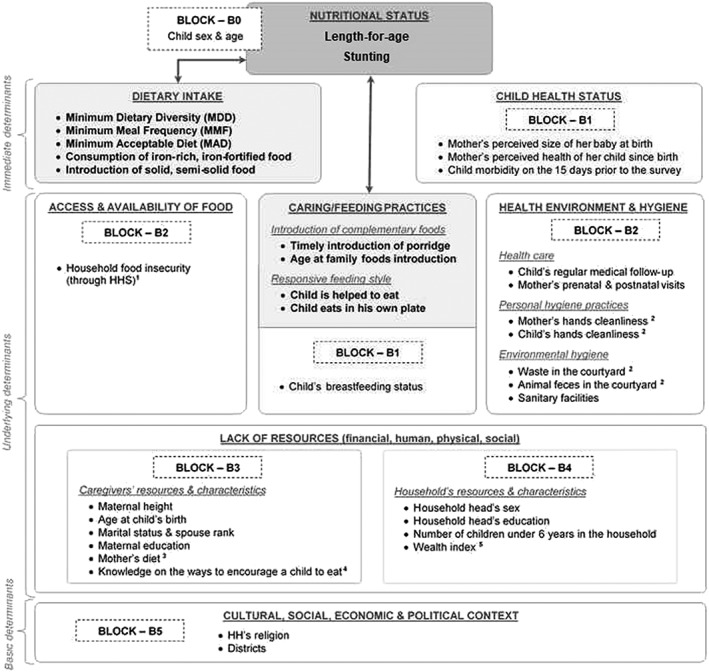
 Outcome variables;
  Main predictors;
  Studied associations 1Household Hunger Scale score (HHS): since in our dataset the HHS standard categorical indicator classified too few households in severe hunger to run a consistent analysis, we re‐categorized the households following the HHS score distribution in our sample. Households with a score of 0‐2 were classified as experiencing no to moderate hunger; those with a score of 3‐6 were considered as suffering from severe hunger. 2Hygiene: Household's environmental hygiene was assessed using spot‐check observational method (Ruel & Arimond, 2002; Sonego & Mosler, 2016). The investigators notably checked the household's courtyard condition taking notice of waste and animal feces. Maternal and child hands cleanliness was estimated through the same methodology, differentiating between "clean", "dusty" and "dirty" hands. Given the rural context "clean" and "dusty" were combined and opposed to "dirty". 3Mothers' diet: was assessed through the women dietary diversity score (WDDS ‐10). Usually used to compute the minimum dietary diversity of women (MDD‐W), that score based on a 24‐h recall classifies in ten food groups all food items consumed by women on the last 24‐h (Nguyen et al., 2013). 4Mothers' knowledge on the ways to encourage a child to eat: evaluated through a score allocating or removing one point respectively to each good or bad practices mentioned by mothers, who were then classified in terciles according to their score. 5Wealth index: generated using a multiple correspondence analysis including both data on household's assets (ex: mobile phone, bicycle, motorcycle, flashlight) and information on housing quality and facilities (building materials, toilet facility, main sources of light, drinking water, cooking fuel). All households were classified into quintiles according to their index value.
References
-
- Abubakar, A. , Holding, P. , Mwangome, M. , & Maitland, K. (2011). Maternal perceptions of factors contributing to severe under‐nutrition among children in a rural African setting. Rural and Remote Health, 1, 1423. https://doi.org/1423 [pii] - PMC - PubMed
-
- Ballard, T. , Coates, J. , Swindale, A. , & Deitchler, M. (2011). Household hunger scale: Indicator definition and measurement guide. Retrieved from https://www.fantaproject.org/sites/default/files/resources/HHS-Indicator...
