

Hydrogen-rich saline promotes microglia M2 polarization and complement-mediated synapse loss to restore behavioral deficits following hypoxia-ischemic in neonatal mice via AMPK activation
- PMID: 31103039
- PMCID: PMC6525972
- DOI: 10.1186/s12974-019-1488-2
Hydrogen-rich saline promotes microglia M2 polarization and complement-mediated synapse loss to restore behavioral deficits following hypoxia-ischemic in neonatal mice via AMPK activation
Abstract
Background: Hypoxia-ischemia (HI) during the perinatal period is one of the most common causes of acute mortality and chronic neurologic morbidity. Hydrogen-rich saline (HS) treatment in neonatal mice has been reported to alleviate brain injury following HI, but the mechanisms involved are not known.
Methods: A modified version of the Rice-Vannucci method for the induction of neonatal HI brain injury was performed on postnatal day 7 mouse pups. Animals or BV2-cells received HS and an AMPK inhibitor at indicative time post-injury.
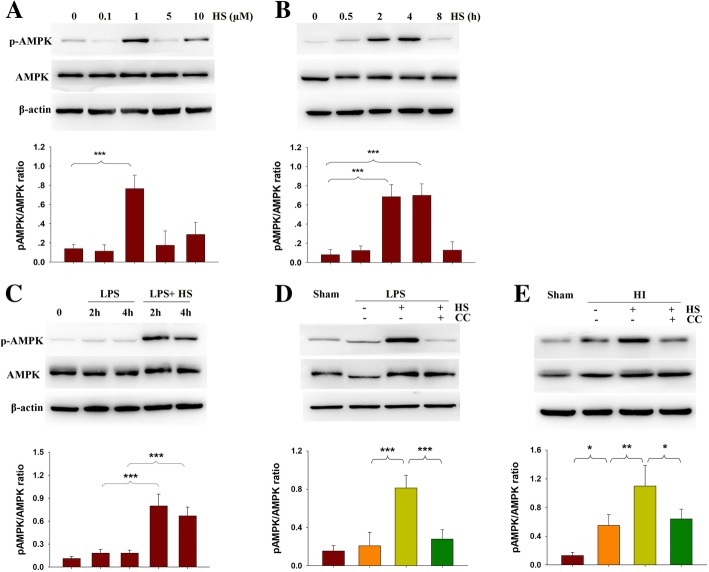
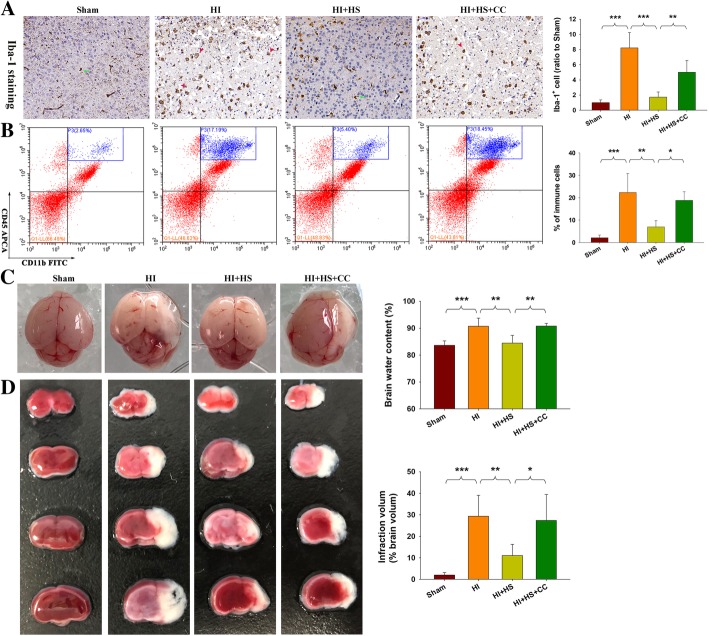
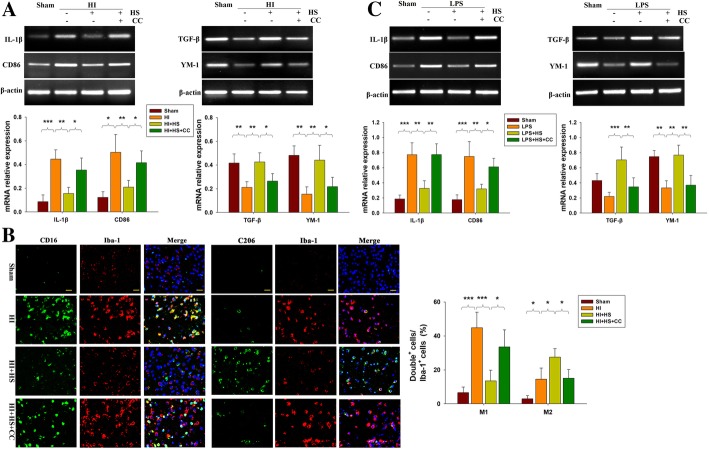
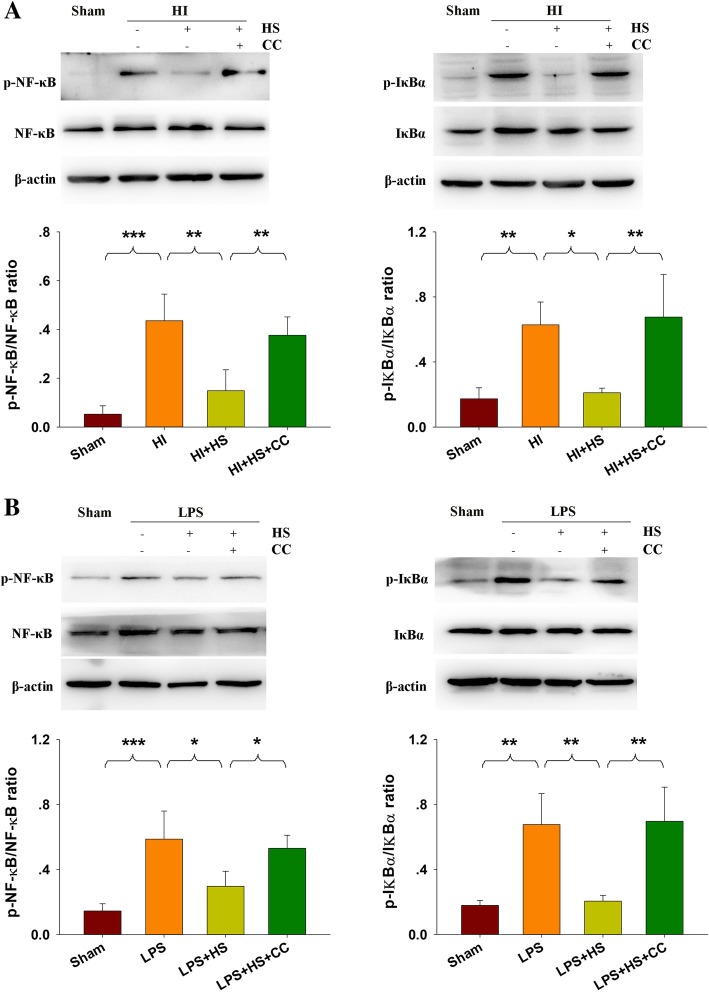
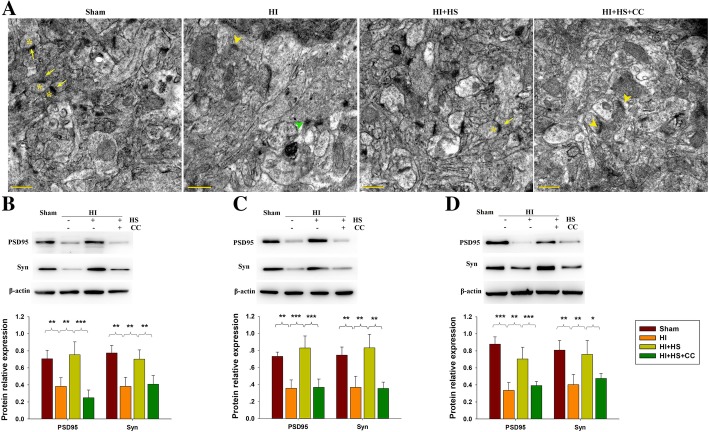
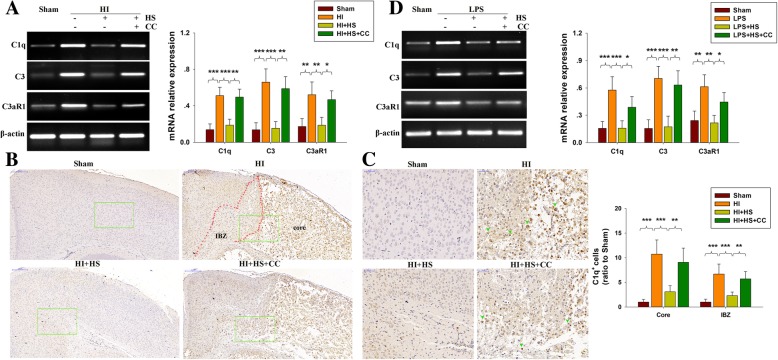
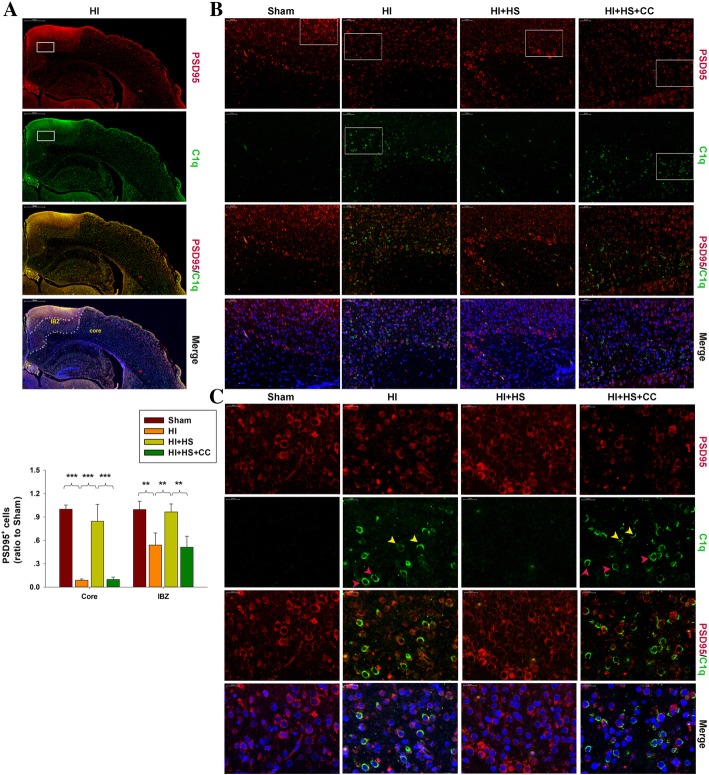
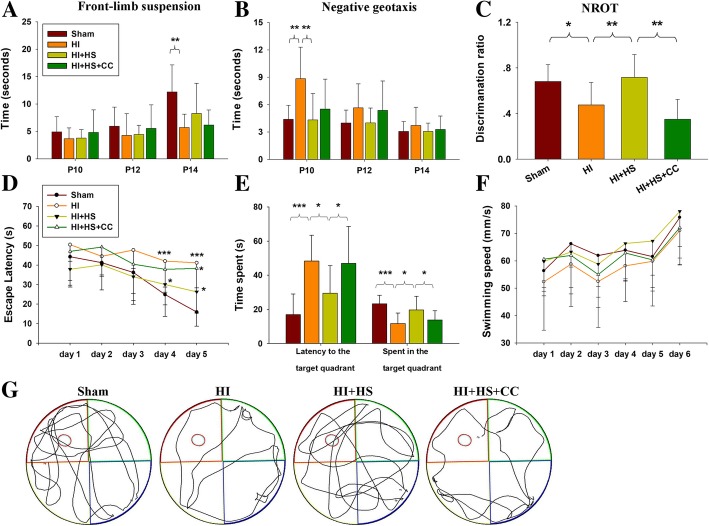
Results: In the current study, we show that HS treatment attenuated the accumulation of CD11b+/CD45high cells, suppressed HI-induced neuro-inflammation, induced microglial anti-inflammatory M2 polarization, was associated with promoting AMPK activation, and inhibited nuclear factor-κB activation as demonstrated both in vivo and in vitro. In addition, HS treatment reversed HI-induced neurological disabilities, was associated with improving damaged synapses, and restored the expression levels of synaptophysin and postsynaptic density protein 95 following HI insult. Furthermore, HI insult which increased levels of complement component C1q, C3, and C3aR1 was observed. Importantly, C1q deposited in the infarct core and lesion boundary zone following HI injury, was found to co-localize within regions of synapse loss, whereas HS treatment reversed these effects of HI on synapse loss and complement component levels. Notably, the AMPK inhibitor reversed the beneficial effects of HS as described above.
Conclusions: These results demonstrate that HS restored behavioral deficits after HI in neonatal mice. These beneficial effects, in part, involve promoting microglia M2 polarization and complement-mediated synapse loss via AMPK activation.
Keywords: Complement; Hydrogen-rich saline; Hypoxia-ischemia; M2 polarization; Synapse loss.
Conflict of interest statement
The authors declare that they have no competing interests.
Figures
Similar articles
-
Hydrogen-Rich Saline Regulates Microglial Phagocytosis and Restores Behavioral Deficits Following Hypoxia-Ischemia Injury in Neonatal Mice via the Akt Pathway.Drug Des Devel Ther. 2020 Sep 21;14:3827-3839. doi: 10.2147/DDDT.S264684. eCollection 2020. Drug Des Devel Ther. 2020. PMID: 33061290 Free PMC article.
-
The Impact of the Histone Deacetylase Inhibitor-Sodium Butyrate on Complement-Mediated Synapse Loss in a Rat Model of Neonatal Hypoxia-Ischemia.Mol Neurobiol. 2025 Apr;62(4):5216-5233. doi: 10.1007/s12035-024-04591-w. Epub 2024 Nov 12. Mol Neurobiol. 2025. PMID: 39531190 Free PMC article.
-
l-Cysteine suppresses hypoxia-ischemia injury in neonatal mice by reducing glial activation, promoting autophagic flux and mediating synaptic modification via H2S formation.Brain Behav Immun. 2018 Oct;73:222-234. doi: 10.1016/j.bbi.2018.05.007. Epub 2018 May 8. Brain Behav Immun. 2018. PMID: 29751053
-
Immunomodulatory Mechanism and Potential Therapies for Perinatal Hypoxic-Ischemic Brain Damage.Front Pharmacol. 2020 Dec 11;11:580428. doi: 10.3389/fphar.2020.580428. eCollection 2020. Front Pharmacol. 2020. PMID: 33536907 Free PMC article. Review.
-
Complement and microglia dependent synapse elimination in brain development.WIREs Mech Dis. 2022 May;14(3):e1545. doi: 10.1002/wsbm.1545. Epub 2021 Nov 4. WIREs Mech Dis. 2022. PMID: 34738335 Free PMC article. Review.
Cited by
-
An Inhibitor of NF-κB and an Agonist of AMPK: Network Prediction and Multi-Omics Integration to Derive Signaling Pathways for Acteoside Against Alzheimer's Disease.Front Cell Dev Biol. 2021 Jul 19;9:652310. doi: 10.3389/fcell.2021.652310. eCollection 2021. Front Cell Dev Biol. 2021. PMID: 34350171 Free PMC article.
-
Nanoparticulate MgH2 ameliorates anxiety/depression-like behaviors in a mouse model of multiple sclerosis by regulating microglial polarization and oxidative stress.J Neuroinflammation. 2023 Jan 30;20(1):16. doi: 10.1186/s12974-023-02696-y. J Neuroinflammation. 2023. PMID: 36710351 Free PMC article.
-
NEAT1 inhibits the angiogenic activity of cerebral arterial endothelial cells by inducing the M1 polarization of microglia through the AMPK signaling pathway.Cell Mol Biol Lett. 2024 Apr 29;29(1):62. doi: 10.1186/s11658-024-00579-5. Cell Mol Biol Lett. 2024. PMID: 38684954 Free PMC article.
-
New Insights Into the Roles of Microglial Regulation in Brain Plasticity-Dependent Stroke Recovery.Front Cell Neurosci. 2021 Aug 5;15:727899. doi: 10.3389/fncel.2021.727899. eCollection 2021. Front Cell Neurosci. 2021. PMID: 34421544 Free PMC article. Review.
-
Hydrogen-Rich Saline Regulates Microglial Phagocytosis and Restores Behavioral Deficits Following Hypoxia-Ischemia Injury in Neonatal Mice via the Akt Pathway.Drug Des Devel Ther. 2020 Sep 21;14:3827-3839. doi: 10.2147/DDDT.S264684. eCollection 2020. Drug Des Devel Ther. 2020. PMID: 33061290 Free PMC article.
References
Publication types
MeSH terms
Substances
Grants and funding
- No. 81873768 and 81671213/National Natural Science Foundation of China
- No.81770436/National Natural Science Foundation of China
- No.2017GSF218091/Key Research and Development Foundation of Shandong Province
- No. ZR2016HM33/Natural Science Foundation of Shandong Province
- No.2016YFC1300403/national key project of chronic non-communicable disease of China
LinkOut - more resources
Full Text Sources
Research Materials
Miscellaneous
