. 2019 Jul 3;103(1):147-160.e8.
doi: 10.1016/j.neuron.2019.04.020. Epub 2019 May 15.

A Flexible Model of Working Memory

Affiliations

A Flexible Model of Working Memory

Flora Bouchacourt et al. Neuron. .

Abstract

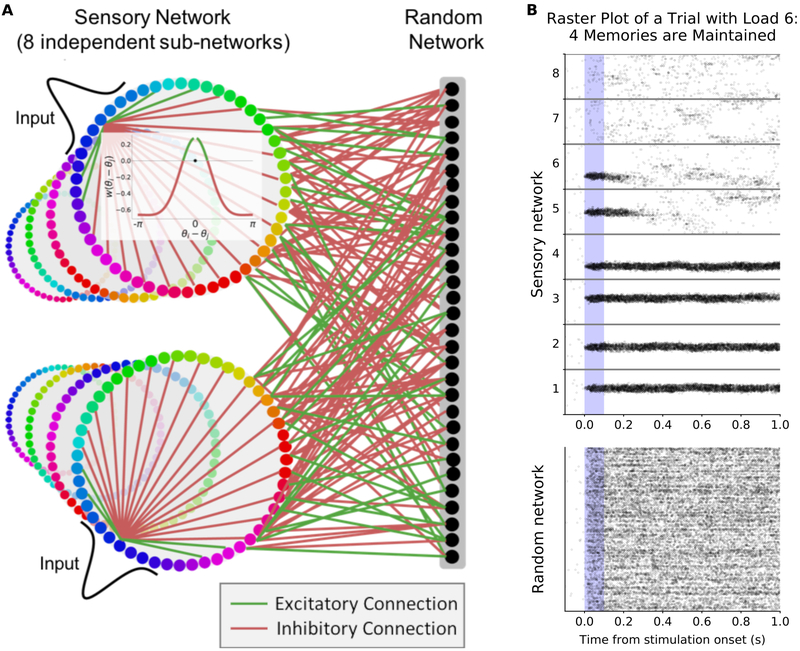
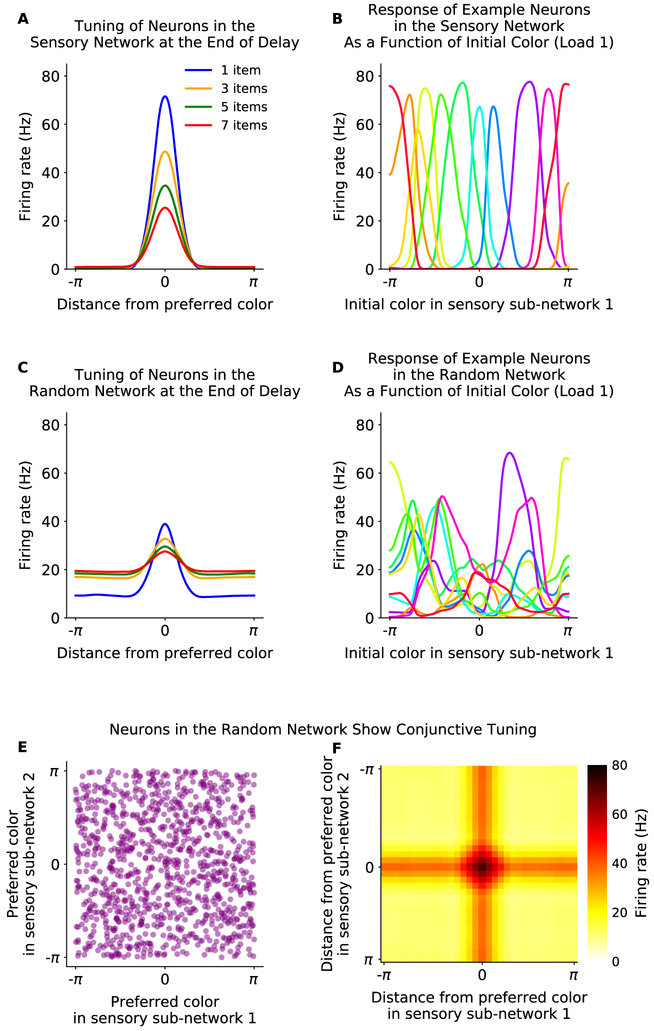
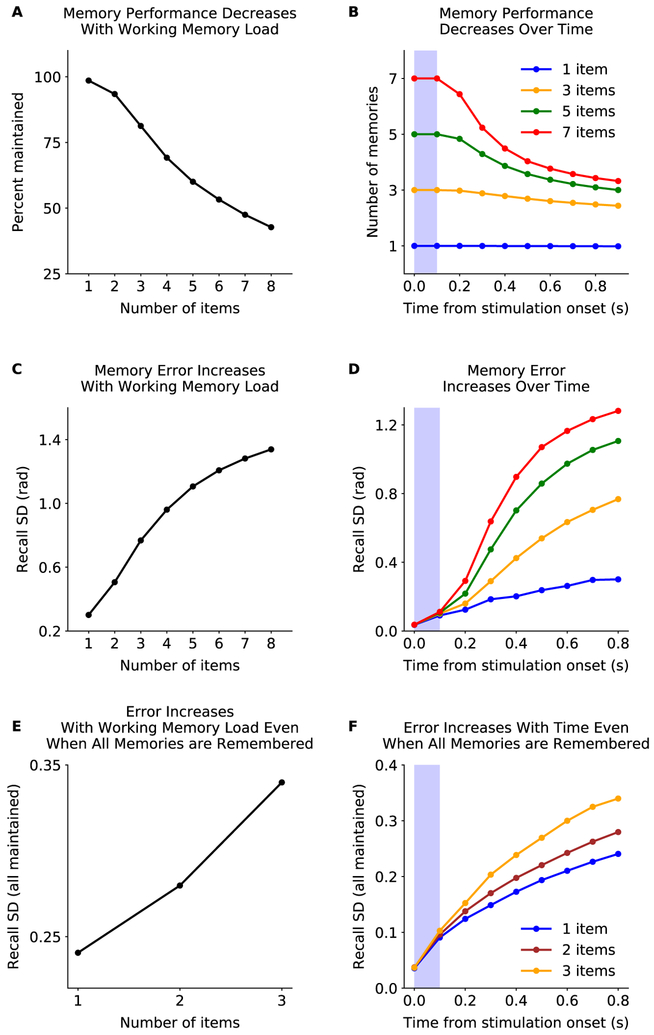
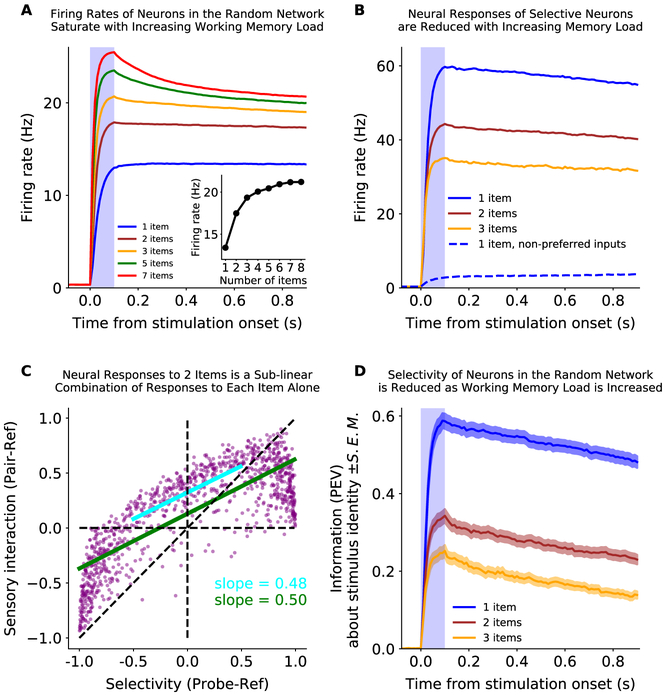
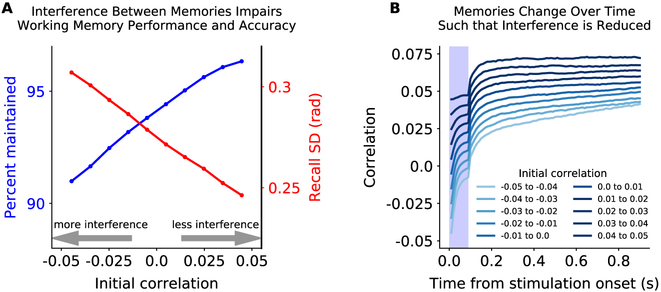
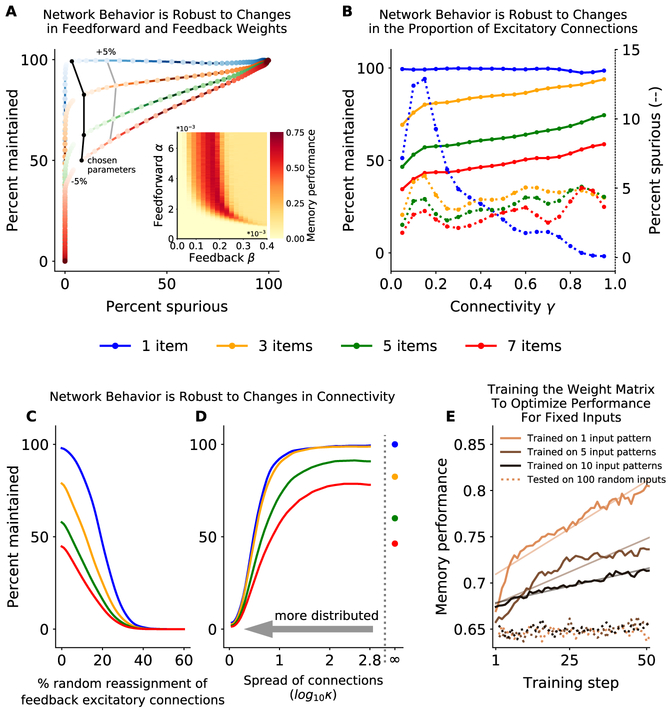
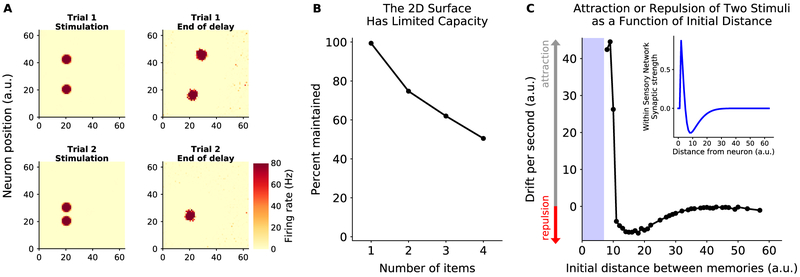
Working memory is fundamental to cognition, allowing one to hold information "in mind." A defining characteristic of working memory is its flexibility: we can hold anything in mind. However, typical models of working memory rely on finely tuned, content-specific attractors to persistently maintain neural activity and therefore do not allow for the flexibility observed in behavior. Here, we present a flexible model of working memory that maintains representations through random recurrent connections between two layers of neurons: a structured "sensory" layer and a randomly connected, unstructured layer. As the interactions are untuned with respect to the content being stored, the network maintains any arbitrary input. However, in our model, this flexibility comes at a cost: the random connections overlap, leading to interference between representations and limiting the memory capacity of the network. Additionally, our model captures several other key behavioral and neurophysiological characteristics of working memory.

Keywords: capacity limitations; cognitive control; cognitive flexibility; computational model; excitation-inhibition balance; mixed selectivity; working memory.


Conflict of interest statement

Declaration of Interests

The authors declare no competing interests.

Figures

Figure 1:
Figure 1:. Flexible working memory through interactions between a structured network and a random network.
(A) Model layout. The sensory network is composed of 8 ring-like sub-networks (although other architectures can be used, Figs. 8, S4F, and S8). The inset shows center-surround connectivity within a sensory sub-network (excitatory connections in green, inhibitory in red). The connections to the random network are randomly assigned and balanced. (B) Raster plot of an example trial with 8 sensory sub-networks (512 neurons each) randomly connected to the same random network (1024 neurons). Six sensory sub-networks (1-6) receive a Gaussian input for 0.1 seconds during the ‘stimulus presentation’ period (shaded blue region). Representations are maintained (without external drive) for four of the inputs. See also Fig. S1A.
Figure 2:
Figure 2:. Tuning in the sensory and random networks.
(A) Neurons in the sensory sub-networks have physiologically realistic tuning curves. Average response of neurons (y-axis) is shown at the end of the delay period, relative to each neuron’s preferred stimulus input (x-axis). Tuning decreases with increased working memory load (colored lines). (B) Example tuning curves in the sensory network. (C) Neurons in the random network show physiologically realistic tuning, inherited from the sensory network. Tuning decreases with memory load (colored lines). (D) Example tuning curves of a subset of neurons in the random network. (E and F) Neurons in the random network show conjunctive tuning. (E) Neurons respond to the conjunction of stimulus identity and location. The preferred stimulus of neurons in the random network is uncorrelated between sensory sub-networks, due to the randomness of projections (shown here as preferred input for sensory sub-network 1, x-axis, and subnetwork 2, y-axis). (F) Neurons in the random network preferentially respond to a conjunction of stimulus inputs across sensory networks. This is shown here by the two-dimensional tuning curve of neurons from the random network to inputs to sensory sub-network 1 and 2. The firing rate (color axis) is aligned on the x-axis to the preferred input for sensory sub-network 1, and on the y-axis to the preferred input for sensory sub-network 2, revealing a peaked response at the conjunction of the two stimuli.
Figure 3:
Figure 3:. Memory performance decreases with working memory load.
(A) The network has a limited memory capacity. The percentage of memories maintained decreases with memory load (‘number of items’; see Methods for details). (B) Forgetting during the delay period is faster for higher memory loads. (C) Memory precision decreases with working memory load. The precision was measured as the standard deviation of the circular error computed from the maximum likelihood estimate of the memory from the sensory network (decoded from 0.8s to 0.9s after the stimulus onset). See also Fig. S1B. (D) Memory precision decreases over time and with load. Decoding time window is 0.1s forward from the time point referenced. (E-F) The decrease in memory precision with memory load is not simply due to forgetting. Same as in C-D, respectively, but only considering simulations where all memories are maintained.
Figure 4:
Figure 4:. The effect of working memory load on neural responses.
(A) The average overall firing rate of neurons in the random network increases with memory load and saturates at the capacity limit of the network. Inset: The mean firing rate during the second half of the delay period as a function of initial load (‘number of items’). (B) The firing rate of selective neurons in the random network is reduced when inputs are added to other sub-networks. Selective neurons (N=71, 6.9% of the random network) were classified as having a greater response to a preferred input than to other, non-preferred, inputs into other sensory networks (preferred is blue, solid; non-preferred is blue, dashed; see Methods for details). The response to a preferred stimulus (blue) is reduced when it is presented with one or two items in other sub-networks (brown and yellow, respectively). (C) Divisive-normalization-like regularization of neural response is observed across the entire random network. The response of neurons in the random network to two inputs in two sub-networks is shown as a function of the response to one input alone. The x-axis is the ‘selectivity’ of the neurons, measured as the response to the ‘probe’ input into sub-network 2 relative to the ‘reference’ input into sub-network 1. The y-axis is the ‘sensory interaction’ of the neurons, measured as the response to the ‘pair’ of both the ‘probe’ and the ‘ref’ inputs, relative to the ‘ref’ alone. A linear fit to the full distribution (green) or the central tendency (blue) shows a positive y-intercept (0.13 and 0.32 for full and central portion) and a slope of 0.5, indicating the response to the pair of inputs is an even mixture of the two stimulus inputs alone. (D) The information about the identity of a memory decreases with memory load. Information was measured as the percent of variance in the firing rate of neurons in the random network explained by input identity (see Methods for details). Shaded region is S.E.M.
Figure 5:
Figure 5:. Interference between inputs reduces performance and accuracy.
(A) Percent of memories maintained (blue, as in Fig. 3A) and memory accuracy (red, as in Fig. 3E) increased when two inputs into two sensory sub-networks are more correlated in the random network. Correlation was measured as the dot product of the vector of random network responses to each input (see Methods for details). So, an increase in correlation reflects increasing overlap of each memory’s excitatory/inhibitory projections into the random network, reducing interference. (B) Memory representations change over time in a way that increases correlation and, thus, reduces interference.
Figure 6:
Figure 6:. Neural dynamics are orthogonal to the mnemonic subspace.
Simulations use a network with weak direct sensory input into the random network and weak recurrence within the random network (see Methods for details). (A) Temporal cross-correlation of neural activity in the random network. Correlation (color axis) is measured between the vector of firing rates in the random network across time (x and y axes). Correlation was low between the stimulation and delay time periods and within the delay period, reflecting dynamic changes in the representation of memory. This was not due to forgetting: all memories are maintained in these simulations. Note non-linear color axis to highlight difference between stimulation and delay periods. (B) Slices of the matrix represented in A: correlation of population state from the first 50ms of the stimulus period (purple) and the last 50ms of the delay period (orange) against all other times. (C) Neural activity is dynamic, but memory encoding is stable. Here the response of the random network population is projected onto the mnemonic subspace (see Methods for details). Each trace corresponds to the response to a different input into sensory sub-network 1, shown over time (from lighter to darker colors). (D) Mnemonic subspace is defined by two orthogonal, quasi-sinusoidal representations of inputs, capturing the circular nature of sensory sub-networks. (E-G) Same as A-C but for a load of 4. Only uses simulations where the memory in sensory sub-network 1 was maintained (other three might be forgotten). (H) The mnemonic subspace is stable across working memory load. Decodability of memory was measured as discriminability between inputs (d’; mean ± S.E.M., see Methods for details). Decodability was similar for mnemonic subspaces defined for a single input (dashed line) and for each load (solid line); no significant difference for load 2, 3, 7 and 8 (p = 0.69, p = 0.081, p = 0.21, and p = 0.54, respectively) but the single input subspace was better for loads 4-6 (p = 0.0012, p < 10−1 and p = 0.044 respectively, all by two-sample Wald test). In general, as expected, decodability is reduced with load (p < 0.001). See also Figs. S2, S3.
Figure 7:
Figure 7:. The network is robust to changes in parameters.
(A) Network performance is robust to changing feedforward/feedback weights. The probability of correctly maintaining a memory (y-axis) and the probability of a spurious memory in non-stimulated sensory sub-networks (x-axis) varies with the product of feedforward and feedback weights (darker colors move away from optimal value). Isolines show network performance across memory load when the product of weights is changed by ±5%. Performance decreases with memory load (colored lines) for all parameter values. Inset: Memory performance of the network (color axis; see Methods for details) as a function of feedforward and feedback weights. Here γ = 0.35. (B) Optimal feedforward and feedback weights can be found for a broad range of γ values that maximize the percent of inputs maintained (solid lines) and minimize the number of spurious memories (dashed line). Memory performance is decreased with load (colored lines), for all parameters. (C and D) Network behavior is robust to changes in connectivity. The percent of remembered inputs (y-axis) for different memory loads (colored lines) decreases as connections between random and sensory networks are either (C) randomly re-assigned (breaking symmetry) or (D) locally redistributed in the sensory network. See Methods for details and Fig. S4E for examples of redistribution for different values of κ. Bit depth constrained calculations to log10κ < 2.8; ∞ indicates no redistribution (i.e. the original random network). (E) Training random network connections improves memory performance for trained inputs but does not generalize. Networks were trained to maximize memory performance for 1, 5 or 10 inputs patterns (solid lines, see Methods for details). Learning was slower when the number of inputs to be simultaneously optimized was increased, reflected in a reduced slope of learning (linear fit). Memory performance did not improve for 100 random, untrained, input patterns, across all loads (dashed lines), showing training did not generalize. See also Fig. S7.
Figure 8:
Figure 8:. Memories can be maintained in different sensory architectures.
(A) Example trials of two memories maintained in a 2D sensory network. Firing rate during stimulation (left) and at the end of delay (right) for trials with two initial inputs. Memories interact such that distant memories are repulsed from one another (top) while nearby memories are attracted to one another and can merge (bottom). (B) Memories interfere in the random network, limiting the network’s capacity. (C) Plot of the speed of attraction/repulsion of memories (y-axis) as a function of the initial distance d between memories (x-axis). Attraction and repulsion were defined relative to the initial vector between inputs (see Methods for details). Note that for d < 10. the two initial inputs cannot be distinguished from each other (shaded blue region), and thus movement cannot be computed. (Inset) Connection weights within the sensory network, as a function of distance. The center-surround structure in the 2D sensory network explains the observed attraction/repulsion of memories.

Comment in

  • Working Memory: Flexible but Finite.
    Adam KCS, Serences JT. Adam KCS, et al. Neuron. 2019 Jul 17;103(2):184-185. doi: 10.1016/j.neuron.2019.06.025. Neuron. 2019. PMID: 31319047 Free PMC article.

References

    1. Adam KC, Vogel EK, Awh E, 2017. Clear evidence for item limits in visual working memory. Cognitive Psychology 97, 79–97. - PMC - PubMed
    1. Almeida R, Barbosa J, Compte A, 2015. Neural circuit basis of visuo-spatial working memory precision: a computational and behavioral study. American Journal of Physiology-Heart and Circulatory Physiology. - PMC - PubMed
    1. Atallah BV, Bruns W, Carandini M, Scanziani M, 2012. Parvalbumin-expressing interneurons linearly transform cortical responses to visual stimuli. Neuron. Neuron 73, 159–170. - PMC - PubMed
    1. Barak O, Tsodyks M, 2014. Working models of working memory. Current opinion in neurobiology 25, 20–24. - PubMed
    1. Bays PM, 2014. Noise in neural populations accounts for errors in working memory. Journal of Neuroscience 34, 3632–3645. - PMC - PubMed

Publication types