

Detecting biological heterogeneity patterns in ADNI amnestic mild cognitive impairment based on volumetric MRI
- PMID: 31104279
- PMCID: PMC7203761
- DOI: 10.1007/s11682-019-00115-6
Detecting biological heterogeneity patterns in ADNI amnestic mild cognitive impairment based on volumetric MRI
Abstract
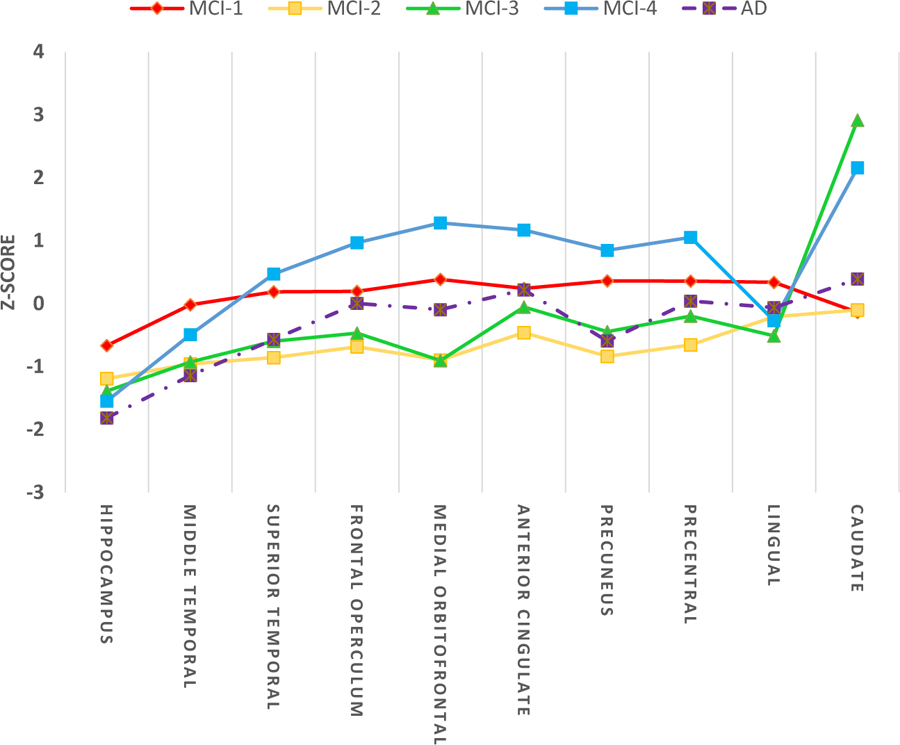
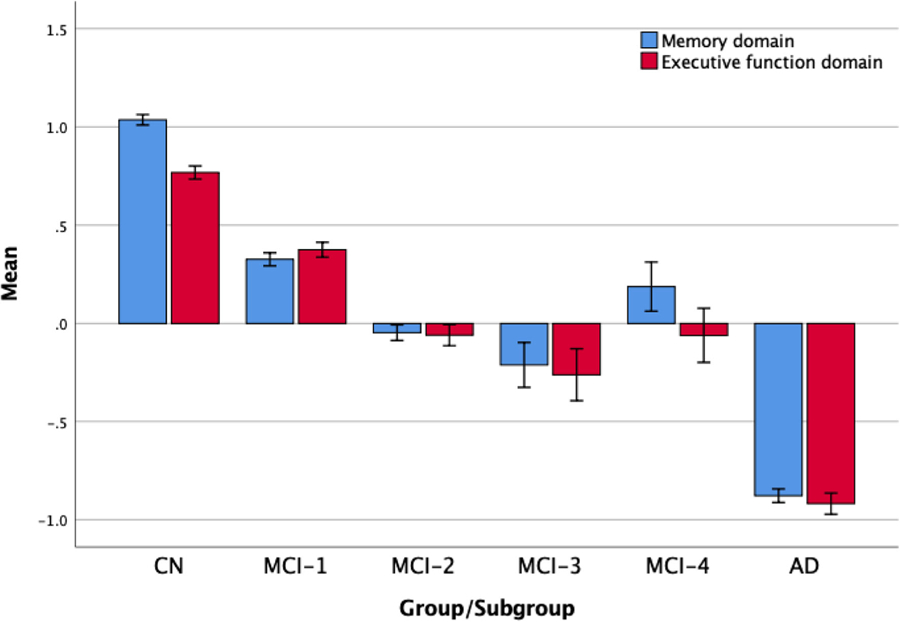
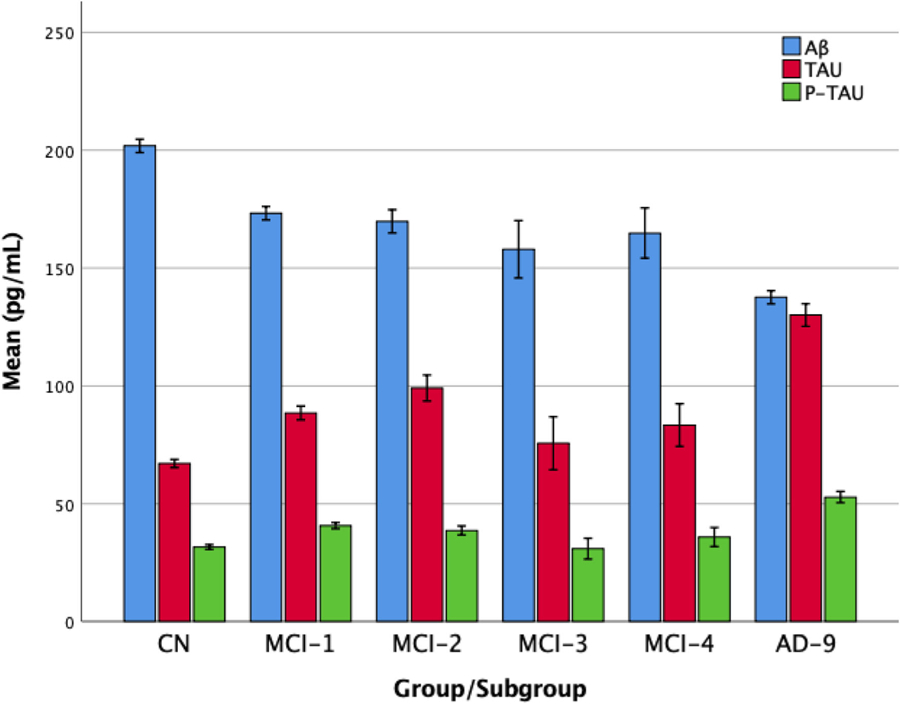
There is substantial biological heterogeneity among older adults with amnestic mild cognitive impairment (aMCI). We hypothesized that this heterogeneity can be detected solely based on volumetric MRI measures, which potentially have clinical implications and can improve our ability to predict clinical outcomes. We used latent class analysis (LCA) to identify subgroups among persons with aMCI (n = 696) enrolled in the Alzheimer's Disease Neuroimaging Initiative (ADNI), based on baseline volumetric MRI measures. We used volumetric measures of 10 different brain regions. The subgroups were validated with respect to demographics, cognitive performance, and other AD biomarkers. The subgroups were compared with each other and with normal and Alzheimer's disease (AD) groups with respect to baseline cognitive function and longitudinal rate of conversion. Four aMCI subgroups emerged with distinct MRI patterns: The first subgroup (n = 404), most similar to normal controls in volumetric characteristics and cognitive function, had the lowest incidence of AD. The second subgroup (n = 230) had the most similar MRI profile to early AD, along with poor performance in memory and executive function domains. The third subgroup (n = 36) had the highest global atrophy, very small hippocampus and worst overall cognitive performance. The fourth subgroup (n = 26) had the least amount of atrophy, however still had poor cognitive function specifically in in the executive function domain. Individuals with aMCI who were clinically categorized within one group other showed substantial heterogeneity based on MRI volumetric measures.
Keywords: Alzheimer’s disease; Amnestic MCI; Cognitive function; Latent class analysis; Volumetric MRI.
Conflict of interest statement
Figures
Similar articles
-
Biological heterogeneity in ADNI amnestic mild cognitive impairment.Alzheimers Dement. 2014 Sep;10(5):511-521.e1. doi: 10.1016/j.jalz.2013.09.003. Epub 2014 Jan 10. Alzheimers Dement. 2014. PMID: 24418061 Free PMC article.
-
Longitudinal changes in surface based brain morphometry measures in amnestic mild cognitive impairment and Alzheimer's Disease.Neuroimage Clin. 2023;38:103371. doi: 10.1016/j.nicl.2023.103371. Epub 2023 Mar 8. Neuroimage Clin. 2023. PMID: 36924681 Free PMC article.
-
Predicting progression from subjective cognitive decline to mild cognitive impairment or dementia based on brain atrophy patterns.Alzheimers Res Ther. 2024 Jul 5;16(1):153. doi: 10.1186/s13195-024-01517-5. Alzheimers Res Ther. 2024. PMID: 38970077 Free PMC article.
-
Neuropsychological and neuroimaging characteristics of amnestic mild cognitive impairment subtypes: a selective overview.CNS Neurosci Ther. 2015 Oct;21(10):776-83. doi: 10.1111/cns.12391. Epub 2015 Mar 26. CNS Neurosci Ther. 2015. PMID: 25809732 Free PMC article. Review.
-
Magnetic resonance imaging in Alzheimer's disease and mild cognitive impairment.J Neurol. 2019 Jun;266(6):1293-1302. doi: 10.1007/s00415-018-9016-3. Epub 2018 Aug 17. J Neurol. 2019. PMID: 30120563 Free PMC article.
Cited by
-
Predicting the progression of MCI and Alzheimer's disease on structural brain integrity and other features with machine learning.Geroscience. 2025 Apr 26. doi: 10.1007/s11357-025-01626-5. Online ahead of print. Geroscience. 2025. PMID: 40285975
-
Application of predictive models in boosting power of Alzheimer's disease clinical trials: A post hoc analysis of phase 3 solanezumab trials.Alzheimers Dement (N Y). 2022 Mar 14;8(1):e12223. doi: 10.1002/trc2.12223. eCollection 2022. Alzheimers Dement (N Y). 2022. PMID: 35310531 Free PMC article.
-
NORHA: A NORmal Hippocampal Asymmetry Deviation Index Based on One-Class Novelty Detection and 3D Shape Features.Brain Topogr. 2023 Sep;36(5):644-660. doi: 10.1007/s10548-023-00985-6. Epub 2023 Jun 29. Brain Topogr. 2023. PMID: 37382838
-
Disentangling Heterogeneity in Alzheimer's Disease and Related Dementias Using Data-Driven Methods.Biol Psychiatry. 2020 Jul 1;88(1):70-82. doi: 10.1016/j.biopsych.2020.01.016. Epub 2020 Jan 31. Biol Psychiatry. 2020. PMID: 32201044 Free PMC article. Review.
-
Stratified support pattern-based internet-assisted self-management therapy for diabetes mellitus -mild cognitive impairment: a randomized controlled trial protocol.BMC Endocr Disord. 2023 Nov 2;23(1):240. doi: 10.1186/s12902-023-01485-1. BMC Endocr Disord. 2023. PMID: 37919711 Free PMC article.
References
-
- Armitage P, Berry G, Matthews JNS (2008). Statistical methods in medical research. John Wiley & Sons.
-
- Beauchaine TP (2003). Taxometrics and developmental psychopathology. Development and Psychopathology, 15, 501–527. - PubMed
-
- Bondi MW, Edmonds EC, Jak AJ, Clark LR, Delano-Wood L, McDonald CR, Nation DA, Libon DJ, Au R, Galasko D, & Salmon DP (2014). Neuropsychological criteria for mild cognitive impairment improves diagnostic precision, biomarker associations, and progression rates. Journal of Alzheimer’s Disease, 42, 275–289. - PMC - PubMed
-
- Celeux G, & Soromenho G (1996). An entropy criterion for assessing the number of clusters in a mixture model. Journal of Classification, 13, 195–212.
MeSH terms
Grants and funding
LinkOut - more resources
Full Text Sources
Medical
Research Materials
