. 2019 Jun 13;177(7):1781-1796.e25.
doi: 10.1016/j.cell.2019.04.028. Epub 2019 May 16.

Identification of a DNA N6-Adenine Methyltransferase Complex and Its Impact on Chromatin Organization

Affiliations

Identification of a DNA N6-Adenine Methyltransferase Complex and Its Impact on Chromatin Organization

Leslie Y Beh et al. Cell. .

Abstract

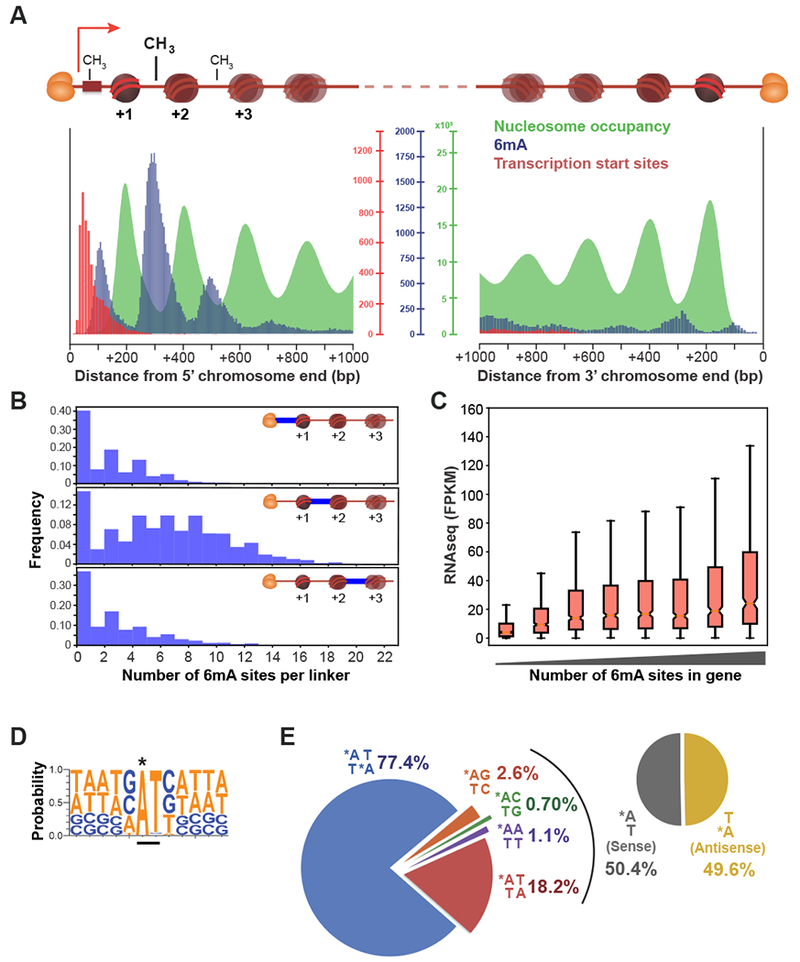
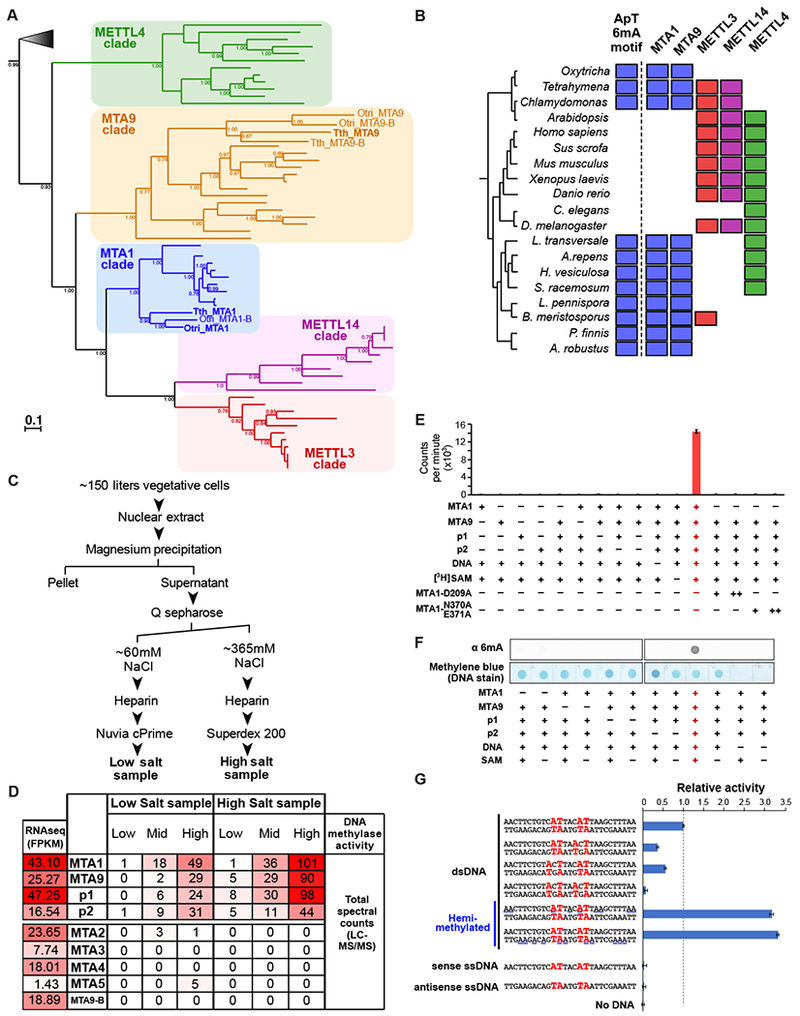
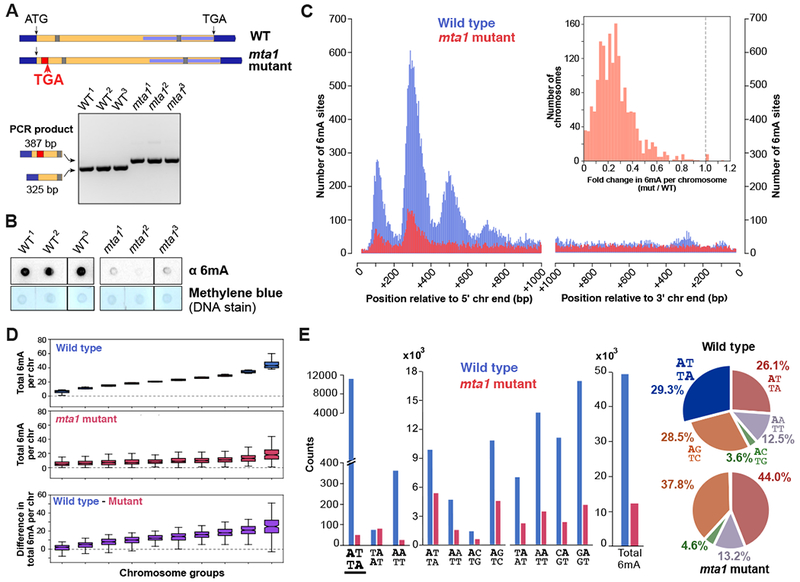
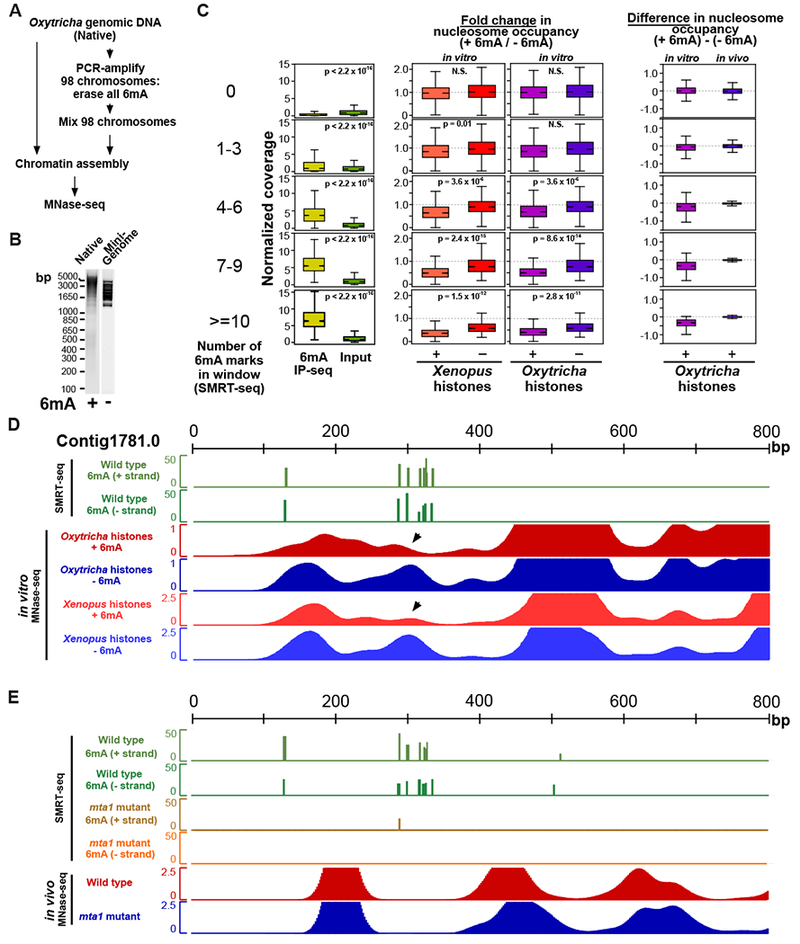
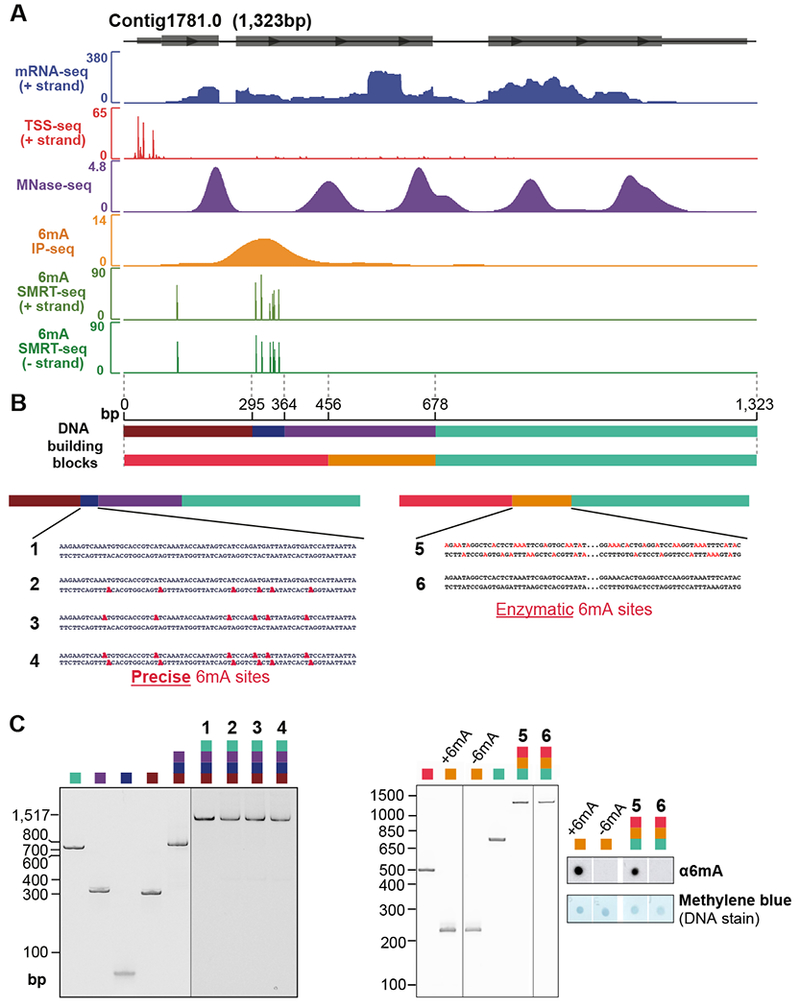
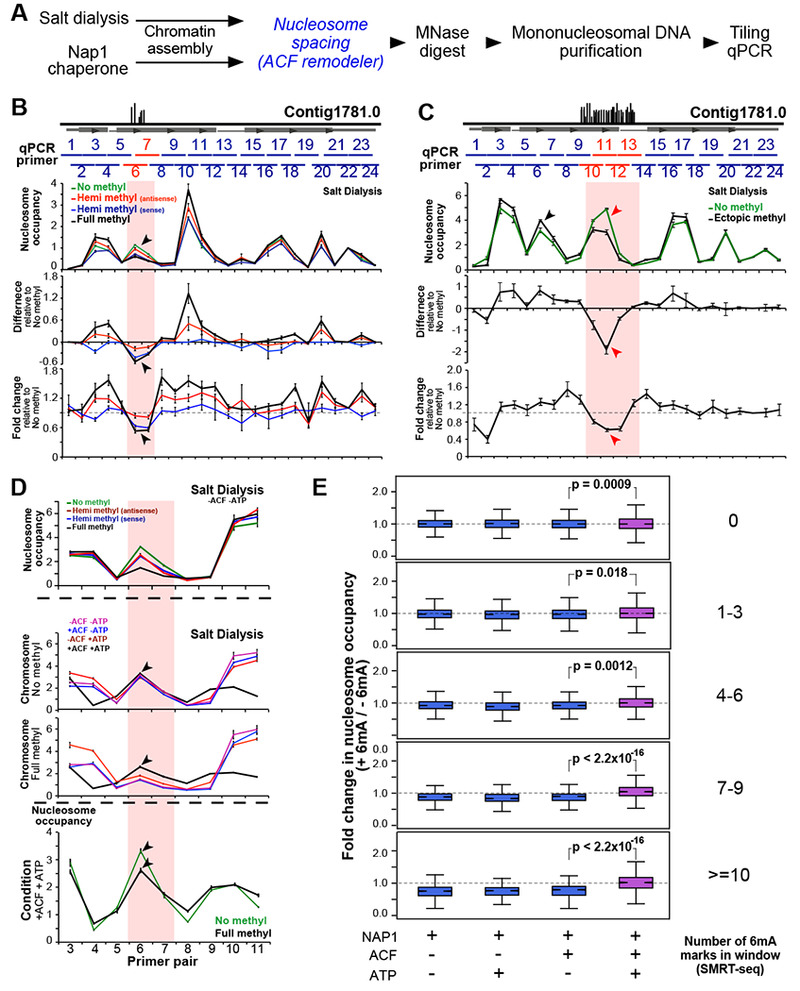
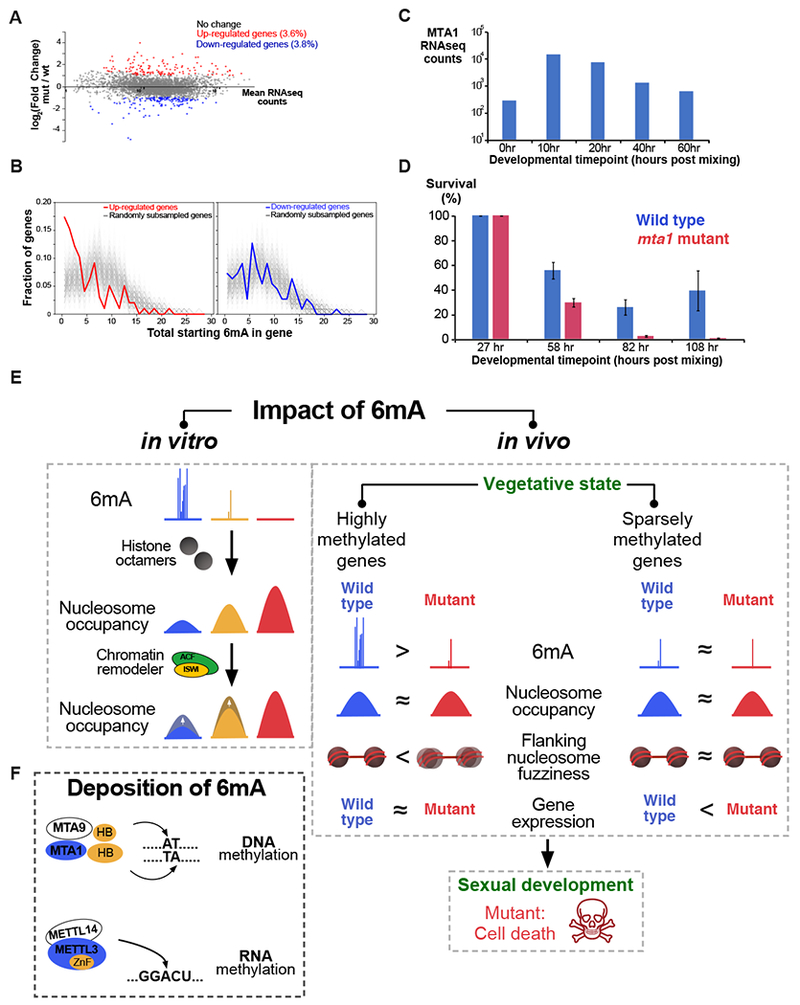
DNA N6-adenine methylation (6mA) has recently been described in diverse eukaryotes, spanning unicellular organisms to metazoa. Here, we report a DNA 6mA methyltransferase complex in ciliates, termed MTA1c. It consists of two MT-A70 proteins and two homeobox-like DNA-binding proteins and specifically methylates dsDNA. Disruption of the catalytic subunit, MTA1, in the ciliate Oxytricha leads to genome-wide loss of 6mA and abolishment of the consensus ApT dimethylated motif. Mutants fail to complete the sexual cycle, which normally coincides with peak MTA1 expression. We investigate the impact of 6mA on nucleosome occupancy in vitro by reconstructing complete, full-length Oxytricha chromosomes harboring 6mA in native or ectopic positions. We show that 6mA directly disfavors nucleosomes in vitro in a local, quantitative manner, independent of DNA sequence. Furthermore, the chromatin remodeler ACF can overcome this effect. Our study identifies a diverged DNA N6-adenine methyltransferase and defines the role of 6mA in chromatin organization.

Keywords: DNA methylation; N6-methyladenine; chromatin remodeling; nucleosome positioning; synthetic chromosomes.


Conflict of interest statement

Declaration of Interests

The authors declare no competing interests.

Figures

Figure 1.
Figure 1.. Epigenomic profiles of Oxytricha chromosomes
(A) Meta-chromosome plots of chromatin organization at Oxytricha macronuclear chromosome ends. Heterodimeric telomere end-binding protein complexes (orange ovals) protect each end in vivo. Horizontal red bar: promoter. The 5’ chromosome end is proximal to TSSs. “Nucleosome occupancy”: normalized MNase-seq coverage; “6mA”: total 6mA number; “Transcription start sites”: total number of called TSSs. (B) Histograms of the total number of 6mA marks within each linker in Oxytricha chromosomes. Distinct linkers are depicted as horizontal blue lines. (C) poly(A)-enriched RNAseq levels positively correlate with 6mA. Genes are sorted according to the total number of 6mA marks 0-800 bp downstream of the TSS. FPKM = Fragments per Kilobase of transcript per Million mapped RNAseq reads. Notch in the boxplot denotes median, ends of boxplot denote first and third quartiles, upper whisker denotes third quantile + 1.5 × interquartile range (IQR), and lower whisker denotes data quartile 1 – 1.5 × IQR. (D) Composite analysis of 65,107 methylation sites reveals that 6mA (marked with *) occurs within an 5’-ApT-3’ dinucleotide motif. (E) Distribution of various 6mA dinucleotide motifs across the genome. Asterisk: 6mA.
Figure 2.
Figure 2.. Purification and characterization of the ciliate 6mA methyltransferase
(A) Phylogenetic analysis of MT-A70 proteins. Bold MTA1 and MTA9 genes are experimentally characterized in this study. Paralogs of MTA1 and MTA9 are labeled as “-B”. Posterior probabilities > 0.65 are shown. Gray triangle represents outgroup of bacterial sequences. The complete phylogenetic tree is shown in Figure S2G. Gene names are in Table S2. Tth: Tetrahymena thermophila; Otri: Oxytricha trifallax. (B) Phylogenetic distribution of the occurrence of ApT 6mA motifs and MT-A70 protein families. Filled square denotes its presence in a taxon. The basal yeast clade is comprised of L. transversale, A.repens, H. vesiculosa, S. racemosum, L. pennispora, B. meristosporus, P. finnis, and A. robustus. (C) Experimental scheme depicting the partial purification of DNA methyltransferase activity from Tetrahymena nuclear extracts. (D) Gene expression and protein abundance of candidate genes in partially purified Tetrahymena nuclear extracts. UniProt IDs are listed in Table S2. RNAseq data are from (Xiong et al., 2012). FPKM = Fragments per Kilobase of transcript per Million mapped RNAseq reads. “Low”, “Mid”, and “High” DNA methylase activity correspond to fractions eluting from the Nuvia cPrime and Superdex 200 columns in panel C. “Total spectrum counts”: total number of LC-MS/MS fragmentation spectra that match peptides from a target protein. (E) DNA methyltransferase assay using [3H]SAM. Vertical axis represents scintillation counts. Error bars represent s.e.m. (n = 3). (F) Dot blot assay using cold SAM. (G) DNA methyltransferase assay performed on different nucleic acid substrates in the presence of MTA1, MTA9, p1, and p2. Sense ssDNA are 5’→3’; antisense are 3’→5’. ApT dinucleotides are labeled in bold red. Horizontal blue lines in hemimethylated dsDNA substrates denote possible locations where 6mA may be installed by EcoGII (prior to this assay). “Relative activity” denotes scintillation counts normalized against the unmethylated 27bp dsDNA substrate with two ApT motifs (top-most dsDNA substrate). An enlarged bar plot of relative activity on 27bp unmethylated dsDNA substrates is included in Figure S3K. Error bars represent s.e.m. (n = 3).
Figure 3.
Figure 3.. Genome-wide loss of 6mA in mta1 mutants
(A) Schematic depicting the disruption of Oxytricha MTA1 open reading frame. Flanking dark blue bars: 5’ and 3’ UTR; yellow = open reading frame; red = retention of 62 bp ectopic DNA segment; grey bar = intron; internal light blue bar = annotated MT-A70 domain; “ATG” = start codon; “TGA” = stop codon. Agarose gel analysis shows PCR confirmation of ectopic DNA retention. (B) Dot blot analysis of RNase-treated genomic DNA. (C) Histogram of 6mA counts near 5’ and 3’ Oxytricha chromosome ends. Inset depicts histogram of fold change in total 6mA in each chromosome, between mutant and wild type cell lines. (D) Chromosomes are sorted into 10 groups according to total 6mA in wild type cells (blue boxplots). For each group, the total 6mA per chromosome in mutants, and the difference in total 6mA per chromosome is plotted below. Boxplot features are as described in Figure 1C. (E) Motif distribution in wild type and mta1 mutants. Loss of ApT dimethylated motif is underlined.
Figure 4.
Figure 4.. Effects of 6mA on nucleosome organization in vitro and in vivo
(A) Experimental workflow for the generation of mini-genome DNA. (B) Agarose gel analysis of Oxytricha gDNA (‘Native’) and mini-genome DNA before chromatin assembly. (C) Methylated regions exhibit lower nucleosome occupancy in vitro but not in vivo. Overlapping 51bp windows were analyzed across 98 chromosomes. For each window, the change in nucleosome occupancy in the absence versus presence of 6mA was calculated. Boxplot features are as described in Figure 1C. P-values were calculated using a two-sample unequal variance t-test. “N.S”: non-significant, with p > 0.05. (D) Reduction in nucleosome occupancy at methylated loci in vitro (black arrowheads). For in vitro MNase-seq, “+ 6mA” refers to chromatin assembled on Oxytricha gDNA, while “−6mA” denotes chromatin assembled on mini-genome DNA. Vertical axis for SMRT-seq data denotes confidence score [−10 log(p-value)] of detection of 6mA, while that for in vitro MNase-seq data denotes nucleosome occupancy. (E) No change in nucleosome occupancy in linker regions despite loss of 6mA in mta1 mutants. Vertical axes are the same as panel (D).
Figure 5.
Figure 5.. Modular synthesis of full-length Oxytricha chromosomes
(A) Features of the chromosome selected for synthesis. Grey boxes represent exons. All data tracks represent normalized coverage except for SMRT-seq, which represents the confidence score [−10 log(p-value)] of detection of each methylated base. (B) Schematic of chromosome construction. Different colors denote DNA building blocks ligated to form the full-length chromosome. Precise 6mA sites (bold red) represent cognate 6mA positions revealed by SMRT-seq in native genomic DNA. These are introduced via oligonucleotide synthesis. For chromosome 5, 6mA sites (non-bold red) represent possible locations ectopically installed by a bacterial 6mA methyltransferase, EcoGII. Intervening sequence within chromosomes 5 and 6 is represented as “…” (C) Native polyacrylamide gel analysis and anti-6mA dot blot analysis of building blocks and purified synthetic chromosomes.
Figure 6.
Figure 6.. Quantitative modulation of nucleosome occupancy by 6mA
(A) Experimental workflow. Chromatin is assembled using either salt dialysis or the NAP1 histone chaperone. Italicized blue steps are selectively included. (B) Tiling qPCR analysis of synthetic chromosome with cognate 6mA sites. Horizontal grey box represents annotated gene, and vertical black lines depict native 6mA positions. Horizontal blue bars span ~100bp regions amplified by qPCR. Red horizontal lines represent the region containing 6mA. ‘Hemi methyl’ chromosomes contain 6mA on the antisense and sense strands, respectively, while the ‘Full methyl’ chromosome has 6mA on both strands. Black arrowheads: decrease in nucleosome occupancy specifically at the 6mA cluster. (C) Tiling qPCR analysis of ectopically methylated synthetic chromosome. Vertical black lines illustrate possible 6mA sites installed enzymatically. Red arrowheads: decrease in nucleosome occupancy in the ectopically methylated region. Black arrowheads: position of cognate 6mA sites (not in this construct). (D) Tiling qPCR analysis of chromatin from panel B that is subsequently incubated with ACF and/or ATP. ACF equalizes nucleosome occupancy between the 6mA cluster and flanking regions in the presence of ATP (black line). Nucleosome occupancy at the methylated region is not restored to the same level as the unmethylated control (black arrowheads). (E) MNase-seq analysis of chromatin is assembled on native gDNA (“+” 6mA) and mini-genome DNA (“−“ 6mA) using NAP1 +/− ACF and ATP. P-values were calculated using a two-sample unequal variance t-test.
Figure 7.
Figure 7.. Effects of 6mA on gene expression and cell viability in vivo.
(A) Horizontal axis: the mean RNAseq counts across all biological replicates from wild type and mta1 mutant data for each gene. Vertical axis: log2(fold change) in gene expression (mutant / wild type). (B) Upregulated genes tend to be sparsely methylated compared to randomly subsampled genes (grey lines). See Methods for analysis procedure. (C) RNAseq analysis of MTA1 expression during the sexual cycle of Oxytricha. RNAseq timecourse data are from (Swart et al., 2013). The total duration of the sexual cycle is ~60 hr. (D) Survival analysis of Oxytricha cells during the sexual cycle. The total cell number at each timepoint is normalized to 27 hr data to obtain the percentage survival. Error bars represent s.e.m. (n = 4). (E) Model illustrating the impact of 6mA methylation by MTA1c on nucleosome organization and gene expression. (F) Comparison of DNA and RNA N6-adenine methyltransferases. Blue denotes catalytic subunit, yellow denotes subunit with predicted DNA or RNA binding domain.

References

    1. Altschul SF, Madden TL, Schäffer AA, Zhang J, Zhang Z, Miller W, and Lipman DJ (1997). Gapped BLAST and PSI-BLAST: a new generation of protein database search programs. Nucleic Acids Res 25, 3389–3402. - PMC - PubMed
    1. Ammermann D, Steinbrück G, Baur R, and Wohlert H (1981). Methylated bases in the DNA of the ciliate Stylonychia mytilus. Eur. J. Cell Biol 24, 154–156. - PubMed
    1. An W, and Roeder RG (2003). Reconstitution and Transcriptional Analysis of Chromatin In Vitro. Methods Enzymol 377, 460–474. - PubMed
    1. Batut P, Dobin A, Plessy C, Carninci P, and Gingeras TR (2013). High-fidelity promoter profiling reveals widespread alternative promoter usage and transposon-driven developmental gene expression. Genome Res 23, 169–180. - PMC - PubMed
    1. Beh LY, Müller MM, Muir TW, Kaplan N, and Landweber LF (2015). DNA-guided establishment of nucleosome patterns within coding regions of a eukaryotic genome. Genome Res 25, 1727–1738. - PMC - PubMed

Publication types

MeSH terms

Substances