. 2019 Jul 1;50(1):57-72.e6.
doi: 10.1016/j.devcel.2019.04.035. Epub 2019 May 16.

Quantitative Super-Resolution Microscopy of the Mammalian Glycocalyx

Affiliations

Quantitative Super-Resolution Microscopy of the Mammalian Glycocalyx

Leonhard Möckl et al. Dev Cell. .

Abstract

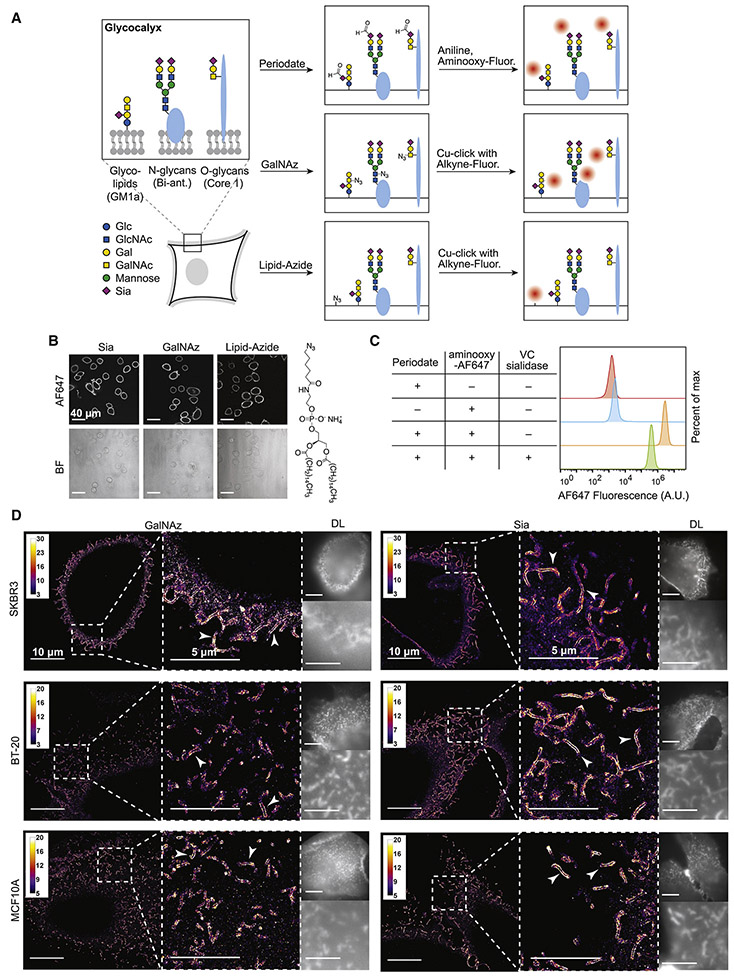
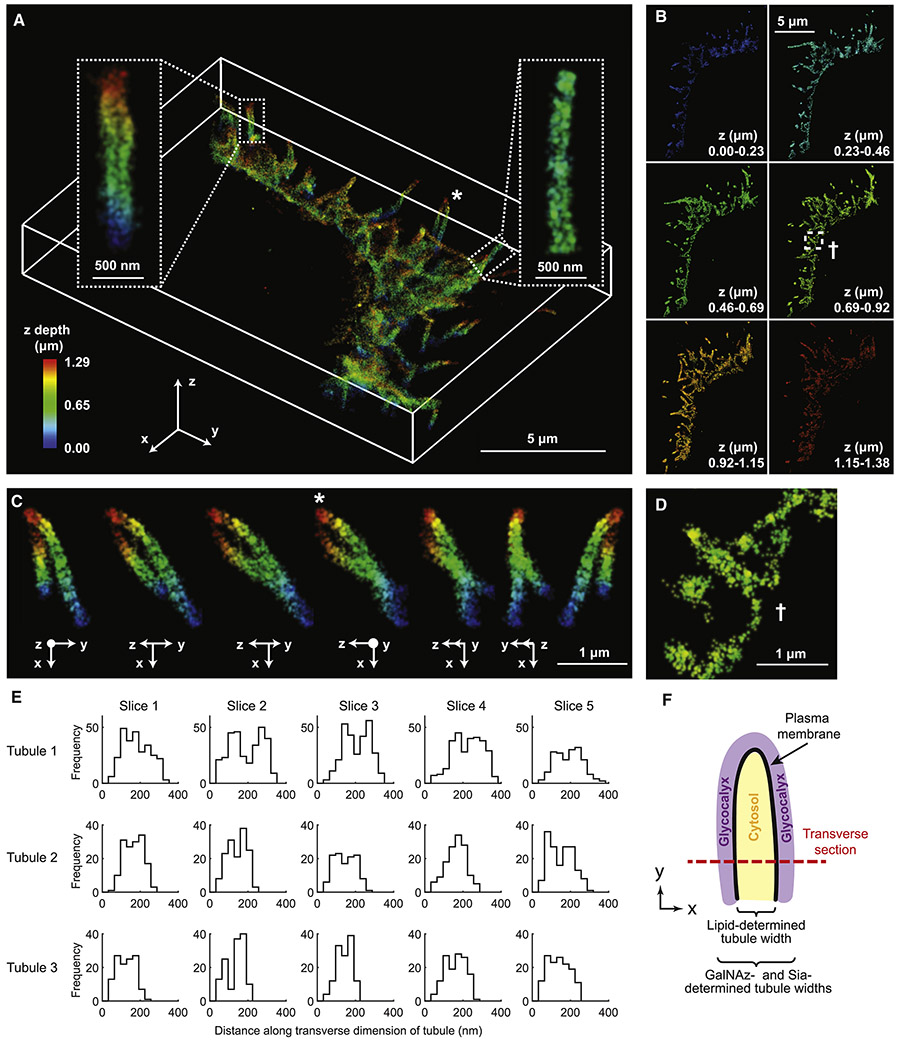
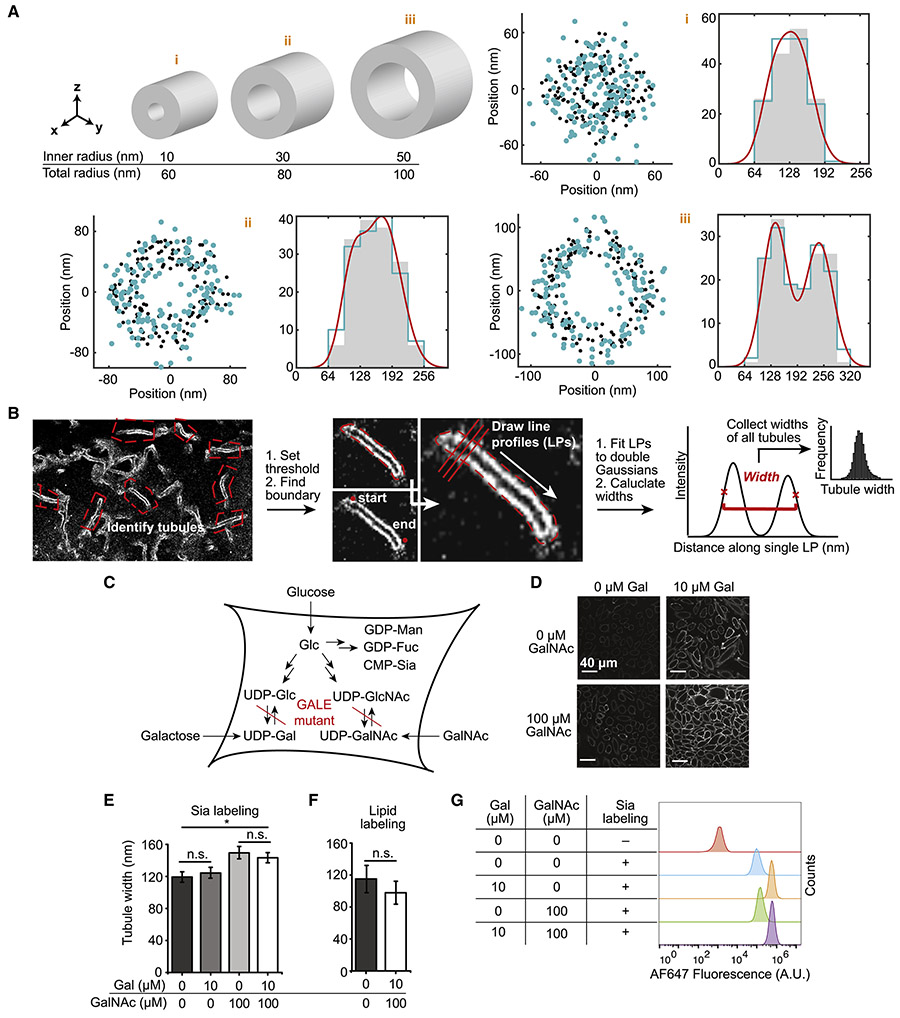
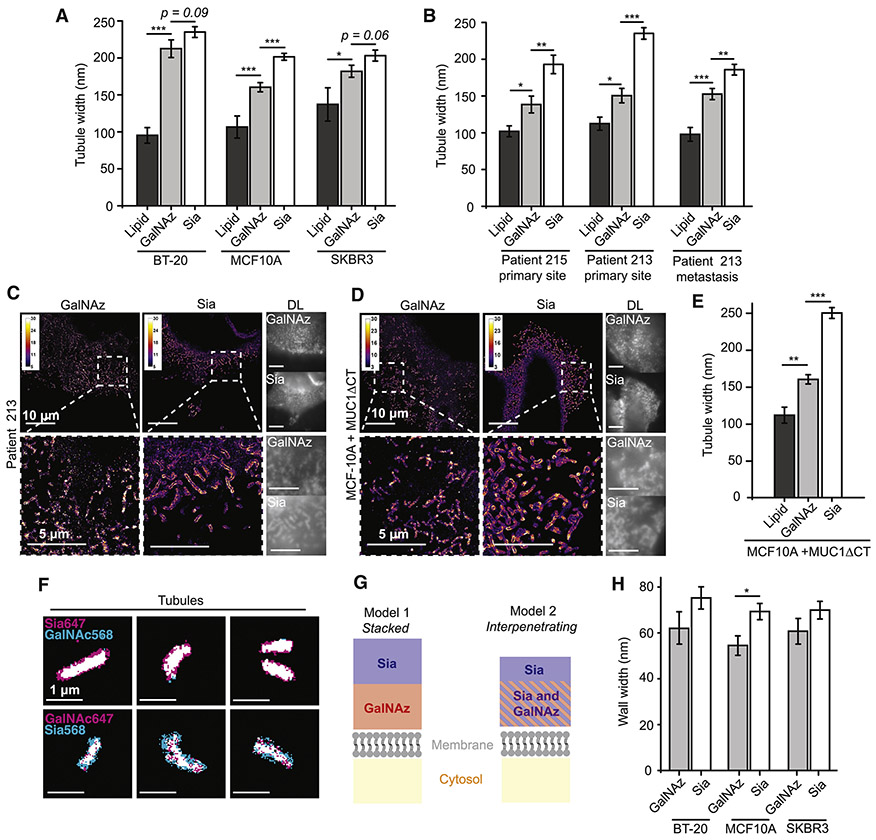
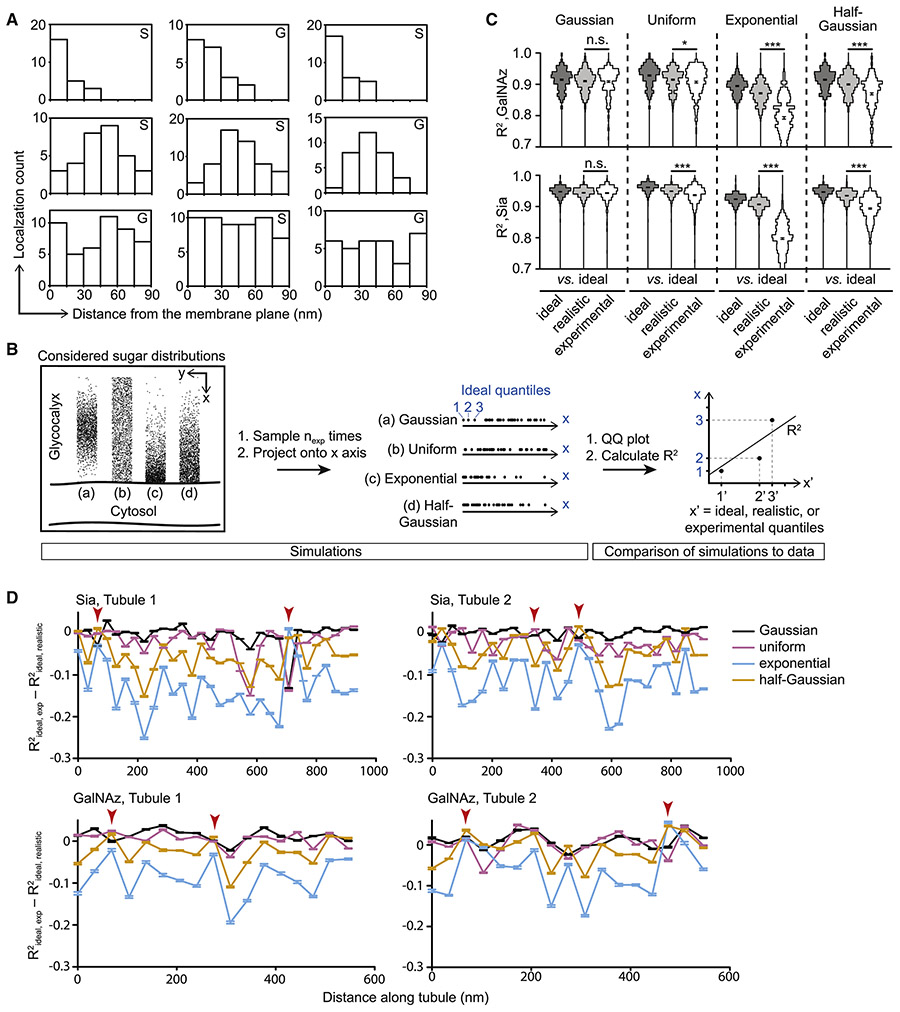
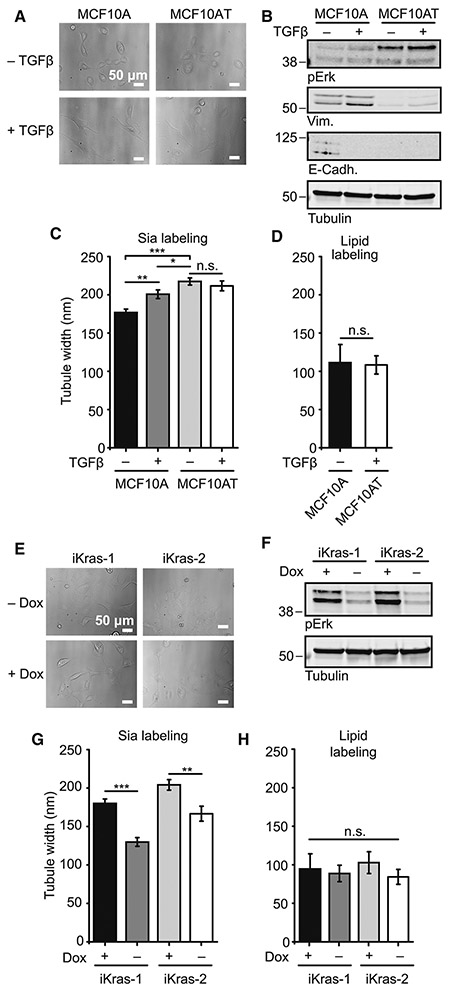
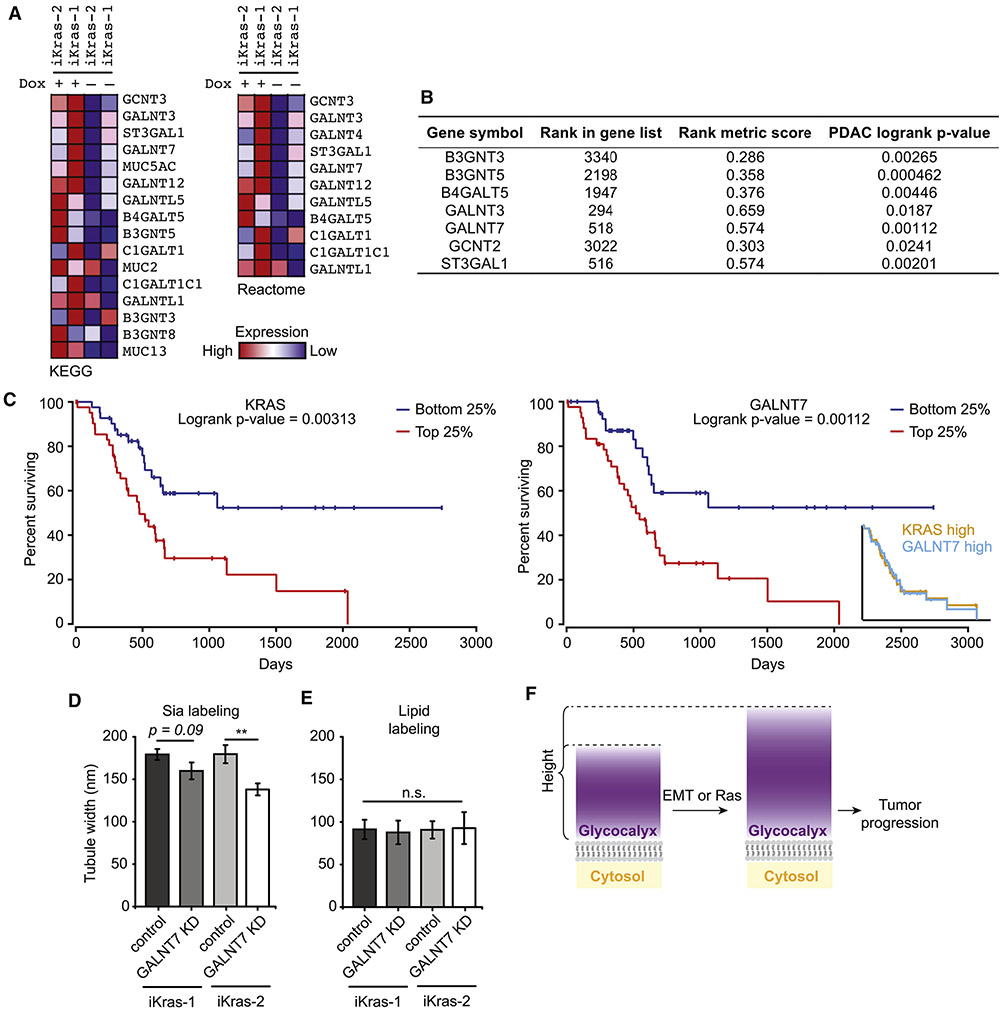
The mammalian glycocalyx is a heavily glycosylated extramembrane compartment found on nearly every cell. Despite its relevance in both health and disease, studies of the glycocalyx remain hampered by a paucity of methods to spatially classify its components. We combine metabolic labeling, bioorthogonal chemistry, and super-resolution localization microscopy to image two constituents of cell-surface glycans, N-acetylgalactosamine (GalNAc) and sialic acid, with 10-20 nm precision in 2D and 3D. This approach enables two measurements: glycocalyx height and the distribution of individual sugars distal from the membrane. These measurements show that the glycocalyx exhibits nanoscale organization on both cell lines and primary human tumor cells. Additionally, we observe enhanced glycocalyx height in response to epithelial-to-mesenchymal transition and to oncogenic KRAS activation. In the latter case, we trace increased height to an effector gene, GALNT7. These data highlight the power of advanced imaging methods to provide molecular and functional insights into glycocalyx biology.

Keywords: GALNT7; KRAS; bioorthogonal chemistry; glycobiology; glycocalyx; membrane biophysics; metabolic labeling; ovarian cancer; pancreatic adenocarcinoma; super-resolution microscopy.


Figures

Figure 1.
Figure 1.. Labeling and SR imaging of the mammalian glycocalyx.
(A) Left. Central glycoconjugates found in the mammalian glycocalyx and important representatives of each are shown. Labeling schemes are shown for sialic acids (top row), GalNAz (middle row), and the lipid membrane (bottom row). GalNAz labels N-acetylgalactosamine (GalNAc) and N-acetylglucosamine (GlcNAc). Glc is glucose; Gal is galactose; Bi-ant. refers to bi-antennary. (B) Confocal imaging of SKBR3 cells with Sia, GalNAz, and lipid labeling. Contrast settings are not equal for all fluorescent micrographs, to show all areas of cellular fluorescence. Lipid labeling is typically dimmer than GalNAz labeling, which is dimmer than Sia labeling. Structure of lipid-azide is depicted on the right. (C) Flow cytometry analysis of Sia-labeled SKBR3 cells with and without prior treatment with 30 nM Vibrio cholerae (VC) sialidase for 2 h at 37 °C. Cells were labeled using the same protocol as for SR microscopy, then lifted with trypsin, fixed, and subjected to flow cytometry. VC sialidase is specific to a subset of Sia linkages. (D) SR reconstructions of SKBR3, BT-20, and MCF10A cells with Sia and GalNAz labeling. Note spiny protrusions exhibiting high signal that cover the entire membrane region (arrowheads show two examples for each condition). Reconstructions are shown as 2D histograms with 32 nm bin width. DL = Diffraction limited. Scalebars for DL images refer to the same width as the scalebars in the corresponding reconstructions.
Figure 2.
Figure 2.. 3D SR imaging reveals cell-surface protrusions as glycocalyx-covered membrane tubules suitable for quantitation.
(A) 3D reconstruction of Sia on BT-20 cells. Tetraacylated N-azidoacetylmannosamine (ManNAz) incorporated BT-20 cells were labeled with AF647 using Cu-click and subjected to TILT3D microscopy. ManNAz was used rather than periodate to label sialic acids in order to minimize coverslip background. Left and right insets correspond to tubules that extend perpendicular to and within the xy-plane, respectively. (B) Projection of the 3D reconstruction onto the xy-plane. The z-slices had a thickness of ~250 nm. (C) Effect of the orientation of tubules on their projections. Shown is a magnification of the tubules located at the asterisk in Figure 2A. (D) Magnification of the base of a single tubule taken from a z-slice (dagger in Figure 2B). (E) Quantitation of tubule width in 3D. A traverse section of three tubules was taken, and a histogram of single molecule localizations was plotted. (F) Schematic of the tubules as glycocalyx-covered membrane protrusions along with the two key parameters to be determined. The lipid-determined tubule width corresponds to the plasma membrane-to-plasma membrane distance. The GalNAz- and Sia-determined tubule widths correspond to lipid-determined tubule width summed with the glycocalyx height on each side of tubule.
Figure 3.
Figure 3.. Tubule width is a measure for glycocalyx height and can be extracted with high throughput from 2D SR reconstructions.
(A) Effect of projection of a 3D tubule into 2D. Three exemplary cylinders (i)-(iii) as proxies for membrane tubules are shown. The inner diameter corresponds to the membrane-to-membrane diameter of a tubule, and the difference between total and inner diameter corresponds to the glycocalyx height on the tubule. Black dots are sampled localizations from exemplary cylinders, turquoise dots incorporate localization precision, and red lines represent the fit. (B) Analysis routine to extract tubule widths from SR reconstructions. (C) ldlD CHO cells have a mutation in the GALE gene which leads to the absence of the key sugars UDP-Gal and UDP-GalNAc. The phenotype can be rescued by supplementation of the media with GalNAc and galactose. (D) Confocal analysis of non-rescued, partly rescued, and fully rescued Sia-labeled ldlD CHO cells. Contrast settings equal between all images. (E) Sia-determined tubule width of ldlD CHO cell rescue panel. Sugar supplementation was performed at the concentrations shown for 2 days prior to labeling and analysis. Error bars: SEM; * = p < 0.05. (F) Tubule width measurements of lipid labeled ldlD CHO cells. (G) Flow cytometry of starved and rescued ldlD CHO cells showing total AF647 fluorescence from cells labeled as in Figure 3E.
Figure 4.
Figure 4.. As a population, Sia residues likely reside distal to GalNAz residues.
(A) Periodate-mediated Sia labeling, GalNAz incorporation, and lipid-azide incorporation were performed on BT-20, MCF10A, and SKBR3 cells. Tubule width measurements were taken using the workflow presented in Figure 3B. Error bars are SEM. * = p < 0.05, ** = p < 0.005, *** = p < 0.0005 by Student’s two-tailed t-test. (B) Tissue from Patient 213 and Patient 215 were obtained from chemotherapy-naïve patients diagnosed with High-Grade Serous Cancer. Labeling and measurement were performed as in (A). (C) Representative SR reconstructions for GalNAz- and Sia-labeled Patient 213 cells. (D) Representative SR reconstructions of MCF10A cells expressing signaling deficient MUC1ΔCT on a doxycycline promoter. (E) MCF10A+MUCΔCT were labeled and measured as in (A). (F) MCF10A + MUC1ΔCT cells were sequentially Sia- and GalNAz-labeled (cf. Methods), with conjugation to AF647 or CF568 for two-color and swapped two-color reconstructions. Binary images, which maximize contrast, of six individual magnified views are shown. Note that binarization obscures the hollowness of the tubules. (G) Two models of the glycocalyx architecture that could explain the distal position of Sia relative to GalNAz. GalNAz could either reside below Sia (Model 1), or GalNAz and Sia could interpenetrate, with Sia, as a population, extending further into the extracellular space (Model 2). (H) Wall width analysis of samples generated in (A). Individual Gaussians from the double-Gaussian fit were extracted from tubules resolved as hollow. Error bars are SEM. * = p < 0.05.
Figure 5.
Figure 5.. The glycocalyx exhibits a nanoscale architecture with sugar residues exhibiting a maximal density some distance away from the membrane.
(A) Nine representative localization distributions from single 90×30 nm windows along a single wall of GalNAz (G) or Sia (S)-labeled tubules. Top row depicts examples of exponential- or half-Gaussian-like distributions, middle row depicts Gaussian-like distributions, and bottom row depicts uniform-like distributions. (B) Schematic of analysis workflow for comparing possible ground truth sugar distributions with experimental localizations. (C) R2 values from QQ analysis shown binned as violin plots. Each of the twelve columns represents a comparison of two distributions (see x-axis labels). Analysis of GalNAz-labeled tubules is shown on top, and analysis of Sia-labeled tubules is shown on bottom. P-values are derived from t-tests of the means and standard deviations of the violin plots shown. Error bars: SEM; * = p < 0.05; *** = p < 0.0005. (D) Quantification of glycocalyx microheterogeneity along a single tubule wall. Values close to zero for R2ideal, exp minus R2ideal, realistic indicate good agreement between the experimental localization distribution and the simulated distribution to which it was compared. Arrowheads indicate example positions where the experimental data has a non-Gaussian sugar distribution.
Figure 6.
Figure 6.. Glycocalyx height increases upon transformation.
(A) Bright field images of MCF10A and MCF10AT cells with and without TGFβ treatment for > 7 days. Changes in gross morphology upon transformation are visible. (B) Western blot analysis of epithelial to mesenchymal transition (EMT) in MCF10A and HRasG12V transduced MCF10A (MCF10AT) cells. pErk signaling increases in MCF10AT cells as expected from stable expression of HRasG12V. Vimentin increases and E-Cadherin decreases in TGFβ treated MCF10A cells. Vimentin increases in TGFβ treated MCF10AT cells, with E-Cadherin below detection by blot. (C) MCF10A and MCF10AT with or without TGFβ treatment were Sia-labeled and measured as in Figure 4A. (D) Lipid-determined tubule widths for MCF10A and MCF10AT+TGFβ, the cells with the lowest and highest Sia-measured glycocalyx height, respectively. (E) Bright field images of iKras-1 and -2 cells with and without dox treatment for > 7 days. Changes in gross morphology upon transformation are visible. (F) Western blot analysis of iKras lines. Dox removal decreases oncogenic Ras signaling, as evidenced by pErk both iKras-1 and iKras-2. (G) iKras-1 and iKras-2 cells with and without dox treatment were labeled for Sia and measured as in Figure 4A. (H) Lipid-determined tubule widths for iKras-1 and iKras-2 cells with and without dox treatment.
Figure 7.
Figure 7.. GALNT7 is upregulated with oncogenic Ras activation and contributes to glycocalyx bulk.
(A) Genes from the KEGG- and Reactome-O-glycosylation pathways that are significantly upregulated in dox-treated iKras-1 and iKras-2 cells compared to dox-removed iKras-1 and iKras-2 cells. (B) Genes from the list shown in (A) in which high mRNA transcript levels (top vs. bottom quartiles) show a significant correlation with poor patient survival in pancreatic adenocarcinoma (PDAC). Ranks in columns 2 and 3 derive from transcriptomics data of iKras-1 and -2, while p-values in column 4 are from patient data. (C) Kaplan-Meier plots for patients with PDAC tumors that show high expression (red curves) and low expression (blue curves) of Kras (left) or GALNT7 (right) (top vs. bottom quartiles, respectively). The inset shows the overlay of the curves for high expression of Kras and GALNT7. (D) Dox-treated iKras-1 and -2 cells were subjected to siRNA-mediated knockdown (KD) of GALNT7. Control cells were transfected with a control pool of siRNA not targeting any mouse or human genes. Sia-labeling and subsequent measurement was performed as in Figure 4A. (E) Lipid-determined tubule widths for dox-treated iKras-1 and -2 cells with and without siRNA-mediated KD. (F) Upon EMT and oncogenic Ras expression, the height of the glycocalyx increases, and the resulting bulky glycocalyx contributes to tumor progression.

References

    1. Altschuler Y, Kinlough CL, Poland PA, Bruns JB, Apodaca G, Weisz OA, and Hughey RP (2000). Clathrin-mediated Endocytosis of MUC1 Is Modulated by Its Glycosylation State. Mol. Biol. Cell 11, 819–831. - PMC - PubMed
    1. Anaya J (2016). OncoLnc: linking TCGA survival data to mRNAs, miRNAs, and lncRNAs. PeerJ Comput. Sci 2, e67.
    1. Bennett EP, Hassan H, Hollingsworth MA, and Clausen H (1999). A novel human UDP-N-acetyl-D-galactosamine:polypeptide N-acetylgalactosaminyltransferase, GalNAc-T7, with specificity for partial GalNAc-glycosylated acceptor substrates. FEBS Letters 460, 226–230. - PubMed
    1. Betzig E, Patterson GH, Sougrat R, Lindwasser OW, Olenych S, Bonifacino JS, Davidson MW, Lippincott-Schwartz J, and Hess HF (2006). Imaging Intracellular Fluorescent Proteins at Nanometer Resolution. Science 313, 1642–1645. - PubMed
    1. Burchell JM, Beatson R, Graham R, Taylor-Papadimitriou J, and Tajadura-Ortega V (2018). O-linked mucin-type glycosylation in breast cancer. Biochemical Society Transactions BST20170483. - PMC - PubMed

Publication types

Substances

LinkOut - more resources