. 2019 Jul 2;30(1):190-200.e6.
doi: 10.1016/j.cmet.2019.04.013. Epub 2019 May 16.

An Evolutionarily Conserved uORF Regulates PGC1α and Oxidative Metabolism in Mice, Flies, and Bluefin Tuna

Affiliations

An Evolutionarily Conserved uORF Regulates PGC1α and Oxidative Metabolism in Mice, Flies, and Bluefin Tuna

Phillip A Dumesic et al. Cell Metab. .

Abstract

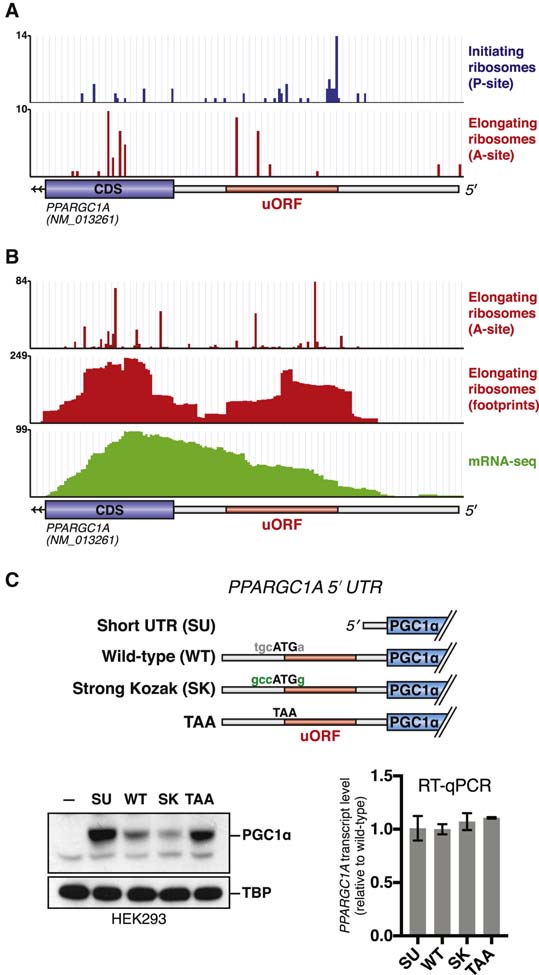
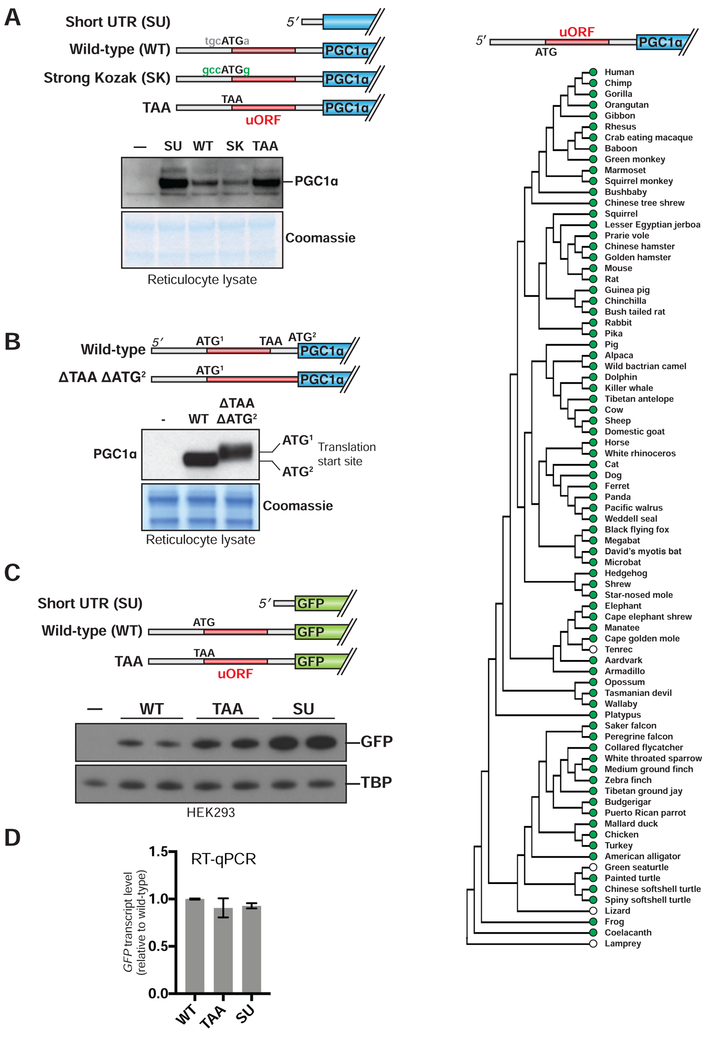
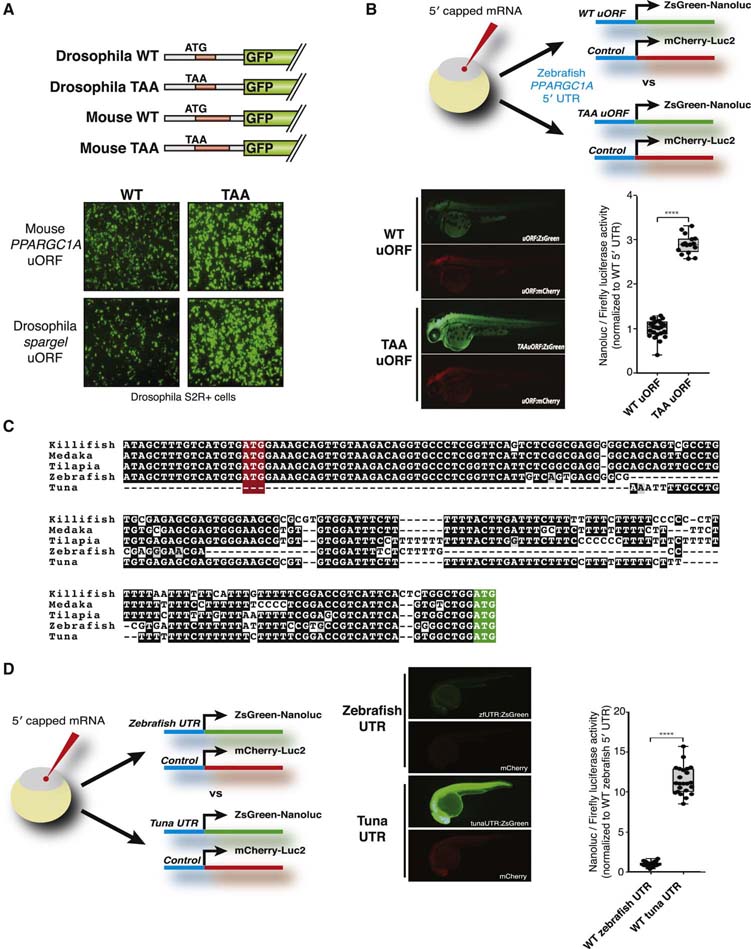
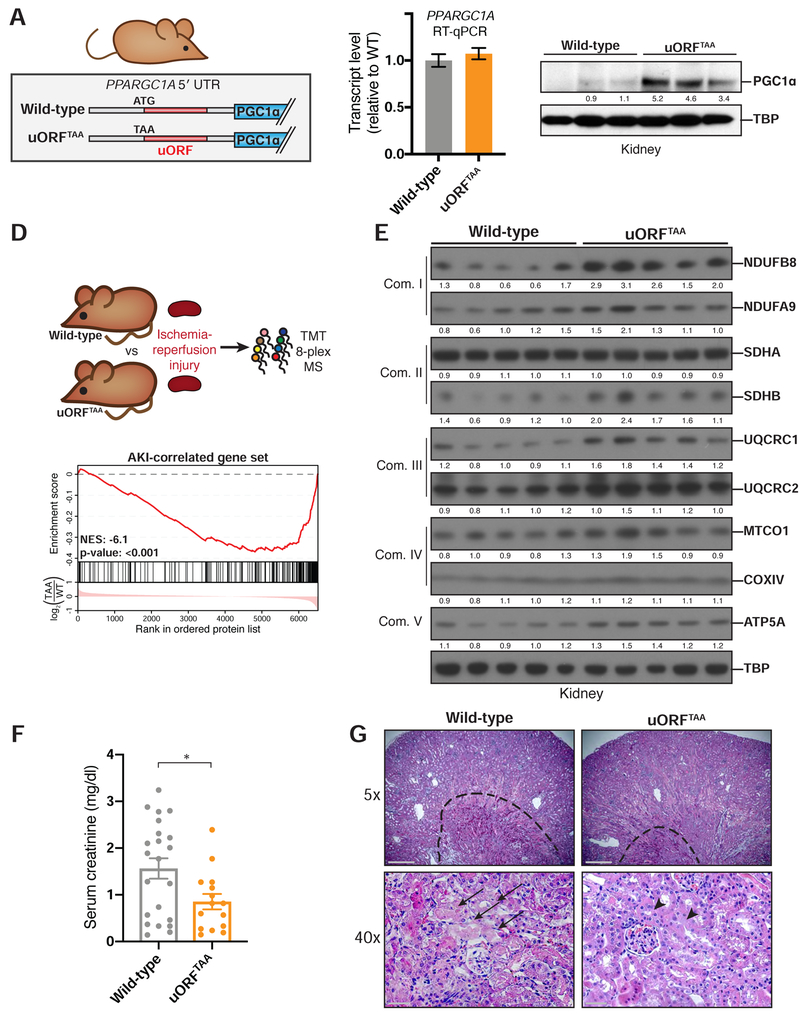
Mitochondrial abundance and function are tightly controlled during metabolic adaptation but dysregulated in pathological states such as diabetes, neurodegeneration, cancer, and kidney disease. We show here that translation of PGC1α, a key governor of mitochondrial biogenesis and oxidative metabolism, is negatively regulated by an upstream open reading frame (uORF) in the 5' untranslated region of its gene (PPARGC1A). We find that uORF-mediated translational repression is a feature of PPARGC1A orthologs from human to fly. Strikingly, whereas multiple inhibitory uORFs are broadly present in fish PPARGC1A orthologs, they are completely absent in the Atlantic bluefin tuna, an animal with exceptionally high mitochondrial content. In mice, an engineered mutation disrupting the PPARGC1A uORF increases PGC1α protein levels and oxidative metabolism and confers protection from acute kidney injury. These studies identify a translational regulatory element governing oxidative metabolism and highlight its potential contribution to the evolution of organismal mitochondrial function.

Keywords: 5’ untranslated region; PGC1α; bluefin tuna; evolution; ischemic kidney injury; metabolism; mitochondria; oxidative phosphorylation; translational regulation; upstream open reading frame.


Conflict of interest statement

DECLARATION OF INTERESTS

BMS is a consultant for Calico, Inc.

Figures

Figure 1.
Figure 1.. The PPARGC1A 5′ UTR encodes an inhibitory uORF
(A) Ribosome profiling data indicating location of initiating (blue) or elongating (red) ribosomes on the PPARGC1A transcript in Jurkat cells. Initiating or elongating ribosomes were stalled using lactimidomycin or cycloheximide, respectively. Data adapted from (Gawron et al., 2016). (B) Ribosome profiling data indicating location of elongating ribosomes on the PPARGC1A transcript in HeLa cells. Data adapted from (Park et al., 2016; Wang et al., 2014; Zur et al., 2016). (C) Immunoblot (left) or RT– qPCR (right) of PGC1α protein or mRNA following transfection of each indicated expression vector in 293E cells (n=3). Dash indicates untransfected sample.
Figure 2.
Figure 2.. The PPARGC1A uORF engages ribosomes to negatively regulate translation of PGC1α
(A) Immunoblot of PGC1α following translation of each expression construct in reticulocyte lysate. Dash indicates no vector added. (B) Top: schematic of expression constructs. The uORF stop codon and the PGC1α start codon are deleted in the ΔTAA ΔATG2 construct. Bottom: immunoblot of PGC1α following translation of each indicated construct in reticulocyte lysate. (C) Immunoblot of PGC1α following transfection of each indicated expression vector in 293E cells. (D) GFP mRNA level in 293 cells transfected with expression vectors indicated in (C). n=3. (E) Vertebrate phylogeny in which green dots indicate conservation of the human PPARGC1A uORF start codon. White dots indicate species that do not encode an ATG at the genomic position corresponding to the human uORF start codon, but do not rule out the presence of an unrelated upstream ATG.
Figure 3.
Figure 3.. Inhibitory PPARGC1A uORFs are functionally conserved in fly and zebrafish but not in Atlantic bluefin tuna
(A) Top: schematic of GFP expression constructs that contain the mouse or fly PPARGC1A/spargel 5′ UTR. Bottom: Constructs were transfected into Drosophila SR2+ cells and GFP was monitored by microscopy. (B) Expression construct mRNA was injected into zebrafish zygotes and analyzed by fluorescence (images) or bioluminescence (graph). mCherry-Luc2 served as control for injection efficiency. N=20; p<0.01. (C) Alignment of conserved uORF within fish ppargc1a 5′ UTRs. The uORF start codon is highlighted in red, whereas the PGC1α start codon is highlighted in green. (D) Expression construct mRNA was injected into zebrafish zygotes and analyzed by fluorescence (images) or bioluminescence (graph). mCherry-Luc2 served as control for injection efficiency. N=20; p<0.01.
Figure 4.
Figure 4.. uORFTAA mice exhibit elevated PGC1α protein levels and are protected from ischemic kidney injury
(A) Design of PPARGC1A uORFTAA mouse, in which uORF start codon is mutated. (B) RT–qPCR assessing PPARGC1A mRNA in injured uORFTAA mouse kidney. (C) Immunoblot for PGC1α in injured kidney after immunoprecipitation from kidney lysates. TBP immunoblot of input. (D) Top: Protein lysates of uninjured kidneys were labeled with isobaric tags and subjected to tandem mass spectrometry (n=4). Bottom: Gene set enrichment plot. Proteins detected in MS were ranked based on relative amount in uORFTAA kidney vs wild-type kidney. The first ranked protein is the most up-regulated in uORFTAA kidney (log2 scale). Hash marks represent positions in the ranked list corresponding to members of a given gene set. Normalized enrichment score (NES) indicates whether these members are enriched towards the up-regulated end of this list (positive NES) or down-regulated end of this list (negative NES) as compared to chance expectation. (E) Injured kidney protein lysates blotted for protein components (right) of mitochondrial oxidative phosphorylation complexes I–V (left). (F) LC/MS measurements of serum creatinine from mice 24 hr after bilateral renal ischemia-reperfusion injury (WT n=22; uORFTAA n=15) *p=0.02. (G) Hematoxylin and eosin stain from kidneys in (E). Top: Dotted line surrounds medullary vascular congestion in kidney medulla. Scale bar: 500 μ m. Bottom: Arrows indicate necrotic tubular epithelium (left), whereas arrowheads indicate preserved tubular epithelium (right) in kidney cortex of uORFTAA mice. Scale bar: 50 μ m.

References

    1. Andreev DE, O’Connor PBF, Fahey C, Kenny EM, Terenin IM, Dmitriev SE, Cormican P, Morris DW, Shatsky IN, and Baranov PV (2015). Translation of 5’ leaders is pervasive in genes resistant to eIF2 repression. Elife 4, e03971. - PMC - PubMed
    1. Barbosa C, Peixeiro I, and Romão L (2013). Gene expression regulation by upstream open reading frames and human disease. PLoS Genet 9, e1003529. - PMC - PubMed
    1. Blanchette M, Kent WJ, Riemer C, Elnitski L, Smit AFA, Roskin KM, Baertsch R, Rosenbloom K, Clawson H, Green ED, et al. (2004). Aligning multiple genomic sequences with the threaded blockset aligner. Genome Research 14, 708–715. - PMC - PubMed
    1. Block BA, Teo SLH, Walli A, Boustany A, Stokesbury MJW, Farwell CJ, Weng KC, Dewar H, and Williams TD (2005). Electronic tagging and population structure of Atlantic bluefin tuna. Nature 434, 1121–1127. - PubMed
    1. Brar GA, Yassour M, Friedman N, Regev A, Ingolia NT, and Weissman JS (2012). High-resolution view of the yeast meiotic program revealed by ribosome profiling. Science 335, 552–557. - PMC - PubMed

Publication types

Substances