. 2019 Jul 18;26(7):913-925.e4.
doi: 10.1016/j.chembiol.2019.04.001. Epub 2019 May 16.

Quantitative Interactome Proteomics Reveals a Molecular Basis for ATF6-Dependent Regulation of a Destabilized Amyloidogenic Protein

Affiliations

Quantitative Interactome Proteomics Reveals a Molecular Basis for ATF6-Dependent Regulation of a Destabilized Amyloidogenic Protein

Lars Plate et al. Cell Chem Biol. .

Abstract

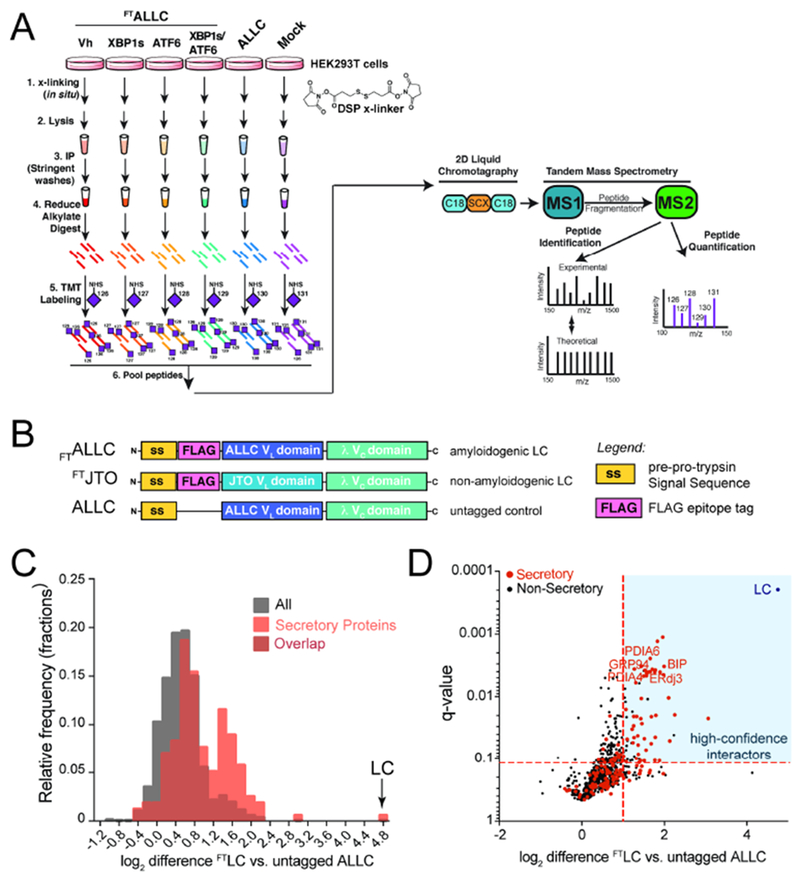
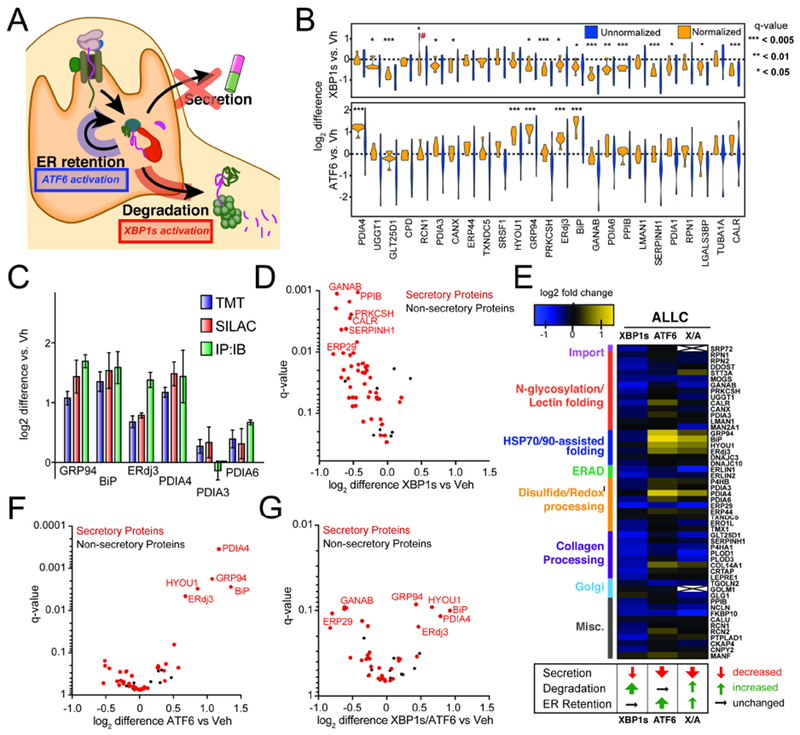
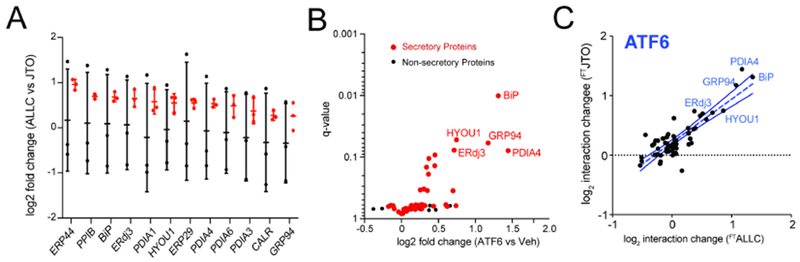
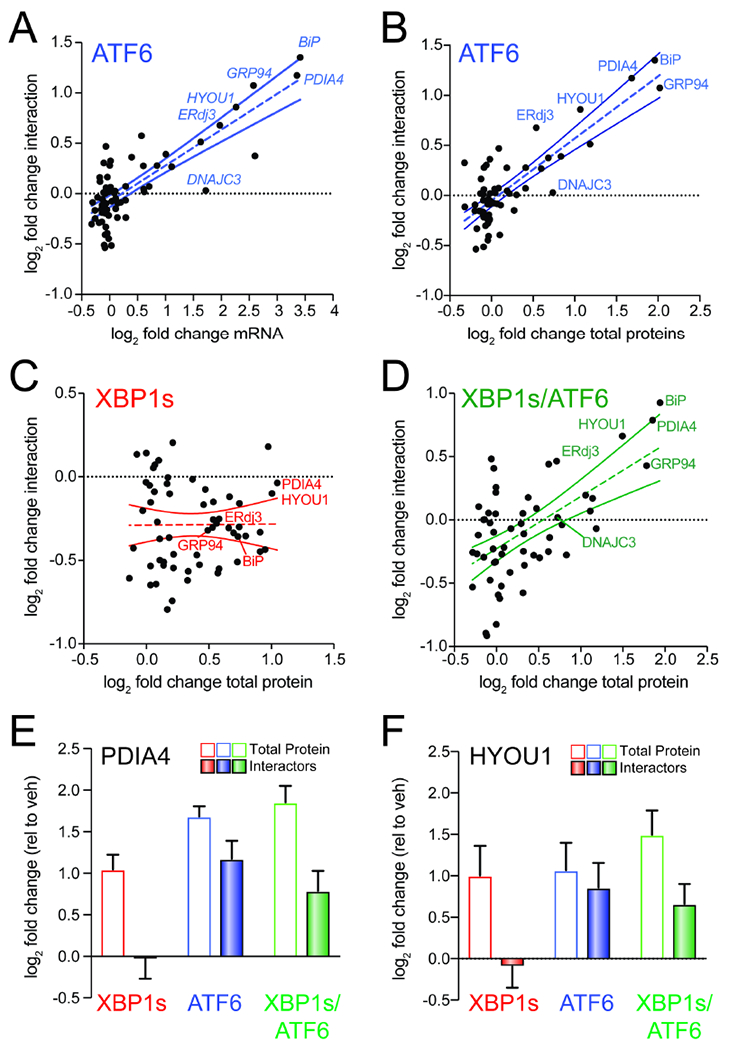
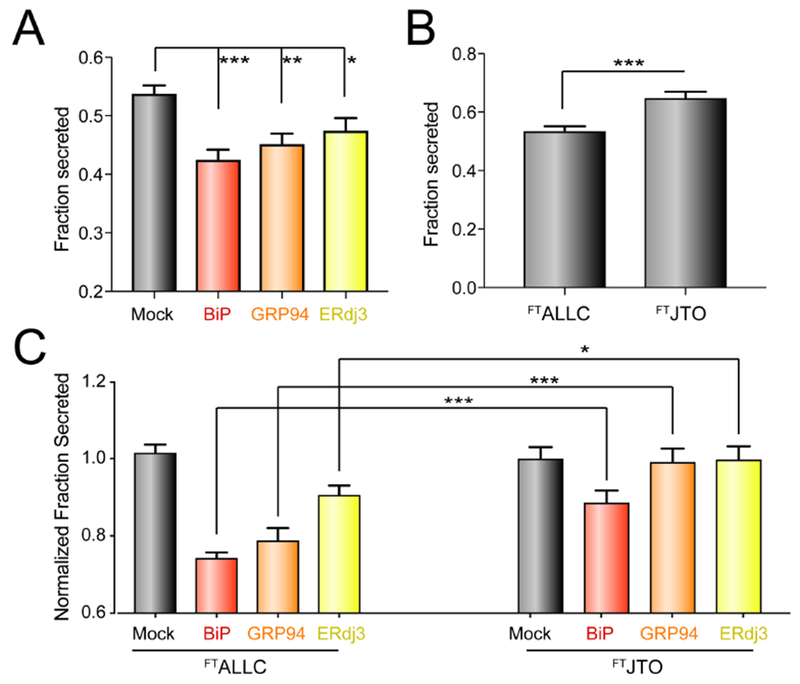
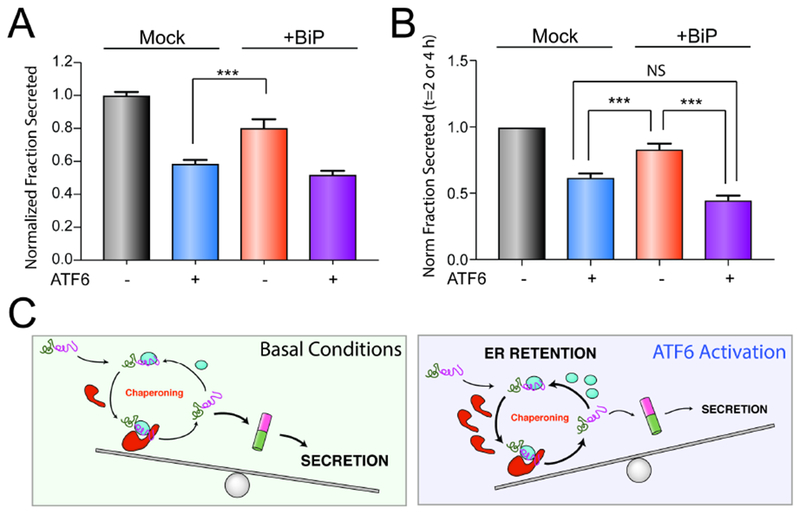
Activation of the unfolded protein response (UPR)-associated transcription factor ATF6 has emerged as a promising strategy to reduce the secretion and subsequent toxic aggregation of destabilized, amyloidogenic proteins implicated in systemic amyloid diseases. However, the molecular mechanism by which ATF6 activation reduces the secretion of amyloidogenic proteins remains poorly defined. We employ a quantitative interactomics platform to define how ATF6 activation reduces secretion of a destabilized, amyloidogenic immunoglobulin light chain (LC) associated with light-chain amyloidosis (AL). Using this platform, we show that ATF6 activation increases the targeting of this destabilized LC to a subset of pro-folding ER proteostasis factors that retains the amyloidogenic LC within the ER, preventing its secretion. Our results define a molecular basis for the ATF6-dependent reduction in destabilized LC secretion and highlight the advantage for targeting this UPR-associated transcription factor to reduce secretion of destabilized, amyloidogenic proteins implicated in AL and related systemic amyloid diseases.

Keywords: ATF6; ER chaperones; ER proteostasis; ER quality control; Unfolded Protein Response (UPR); XBP1s; quantitative proteomics.


Conflict of interest statement

DECLARATION OF INTEREST

The authors declare that they have no competing interest.

Figures

Figure 1.
Figure 1.. Establishing an AP-MS platform to identify ER proteostasis factors that interact with destabilized, amyloidogenic ALLC.
A. Schematic of the multiplexed quantitative interactomics methodology, which combines affinity purification mass-spectroscopy (AP-MS) with in situ DSP cross-linking to capture transient, low affinity interactions with proteostasis network components. Sixplex tandem mass tags (TMT) are used for relative quantification of proteins in individual AP samples, followed by MuDPIT (2D LC coupled to Tandem mass spectrometry). B. Illustration showing the domain organization for the flag-tagged destabilized, amyloidogenic LC ALLC (FTALLC), the flag-tagged energetically normal LC JTO (FTJTO), and untagged ALLC. A sequence alignment of ALLC and JTO showing the differences in amino acid sequence is shown in Fig. S1A. C. Histogram displaying TMT ratios of FTLC (combined n=4 FTALLC and n=6 FTJTO replicates) vs. untagged ALLC (mock) channels for all protein (grey) and filtered secretory protein (red). D. Plot showing TMT ratio (log2 difference FTLC vs. untagged ALLC) vs. q-value (Storey) for proteins that co-purify with FTLC (either FTALLC or FTJTO) compared to untagged ALLC in anti-FLAG IPs (n=10 biological replicates; n = 4 for FTALLC and n = 6 for FTJTO). High confidence interactors are identified in the blue quadrant showing TMT ratio >2 and a q-value < 0.11. Secretory proteins are shown in red. Full data included in Supplemental Table 1.
Figure 2.
Figure 2.. Stress-independent XBP1s or ATF6 activation differentially influence interactions between FTALLC and ER proteostasis factors.
A. Illustration summarizing previous data showing how stress-independent activation of XBP1s (red) or ATF6 (blue) leads to reduced secretion of destabilized, amyloidogenic ALLC (Cooley et al., 2014). XBP1s activation modestly reduces ALLC secretion through increased targeting to degradation, while ATF6 activation significantly reduces ALLC secretion through its increased ER retention. B. Plot showing the distribution of unnormalized (blue) and FTALLC-bait-normalized (orange) TMT interaction ratios for n = 7 biological replicates comparing the recovery of high confidence ALLC interacting proteins in anti-FLAG IPs from cells following XBP1s activation (top) or ATF6 activation (bottom). A simple normalization procedure of the protein TMT signal against the FTALLC bait protein signal across each TMT channel greatly diminishes the variance in interaction ratios. *q-value (Storey) < 0.15, **p < 0.05, ***p < 0.01; # denotes excluded outlier C. Comparison of interaction fold changes between FTALLC and selected proteostasis factors in response to XBP1s or ATF6 activation as quantified by three independent methods: TMT-based q-AP-MS (n=7 biological replicates), SILAC-based q-AP-MS (n= 4 or 5 biological replicates), or Co-immunoprecipitation followed by quantitative immunoblotting (IP:IB; n=3–6 biological replicates). D. Plot showing TMT interaction ratio vs. q-value (Storey) for high confidence FTALLC interacting proteins that co-purify with FTALLC in HEK293DAX cells following stress-independent XBP1s activation from n=7 biological replicates. Full data included in Supplemental Table 2. E. Heatmap displaying the observed interactions changes between FTALLC and high confidence ER proteostasis network components following stress-independent XBP1s or ATF6 activation (data from n=7 biological replicates for ATF6 or XBP1s activation, and n = 4 for XBP1s/ATF6 co-activation). Interactors are organized by pathway or function. The previously defined impact of activating these pathways on ALLC secretion, degradation, and ER retention is shown below (Cooley et al., 2014). F. Plot showing TMT interaction ratio vs. q-value (Storey) for high confidence FTALLC interacting proteins that co-purify with FTALLC in HEK293DAX cells following stress-independent ATF6 activation from n=7 biological replicates. Full data included in Supplemental Table 2. G. Plot showing TMT interaction ratio vs. q-value (Storey) for high confidence FTALLC interacting proteins that co-purify with FTALLC in HEK293DAX cells following stress-independent XBP1s and ATF6 co-activation from n=4 biological replicates. Full data included in Supplemental Table 2.
Figure 3.
Figure 3.. ATF6 Activation Increases Interactions between Non-amyloidogenic FTJTO and ER Proteostasis factors
A. Distribution of unnormalized (black) and normalized (red) TMT ratios of FTALLC vs. FTJTO for proteins with significant interaction changes (n=3 biological replicates). Peptides of the λ Vc domain, which is identical for ALLC and JTO (Fig. S1A), were used to normalize the TMT signal of each individual protein against the λ Vc domain peptide signal across each TMT channel. B. Plot showing TMT interaction ratio vs. q-value for high confidence ALLC interacting proteins that copurify with FTJTO from HEK293DAX cells following treatment with vehicle or TMP (to activate ATF6) for 16 h (n=6 biological replicates). Secretory proteins are shown in red. Full data available in Supplemental Table 3. C. Plot comparing the interaction changes of high confidence ALLC interacting proteins with either FTALLC (n=7 biological replicates) or FTJTO (n=6 biological replicates) following stress-independent ATF6 activation. The dashed line represents least-squares linear regression. The solid lines show 95% confidence intervals
Figure 4.
Figure 4.. ATF6-dependent increases in ALLC interactions correlate with ER proteostasis factor expression
A. Plot comparing mRNA level for high confidence ALLC interacting proteins (measured by RNAseq in (Plate et al., 2016); n=3 biological replicates) vs. their increased interactions with FTALLC in HEK293DAX cells following stress-independent ATF6 activation (n=7 biological replicates). The dashed line shows least-squares linear regression. The solid lines show 95% confidence intervals. B. Plot comparing cellular protein level for high confidence ALLC interacting proteins (measured by whole cell quantitative proteomics in (Plate et al., 2016); n=3 biological replicates) vs. their increased interactions with FTALLC in HEK293DAX cells following stress-independent ATF6 activation (n=7 biological replicates). The dashed line shows least-squares linear regression. The solid lines show 95% confidence intervals. C. Plot comparing cellular protein level for high confidence ALLC interacting proteins (measured by whole cell quantitative proteomics in (Plate et al., 2016); n=3 biological replicates) vs. their increased interactions with FTALLC in HEK293DAX cells following stress-independent XBP1s activation (n=7 biological replicates). The dashed line shows least-squares linear regression. The solid lines show 95% confidence intervals. D. Plot comparing cellular protein level for high confidence ALLC interacting proteins (measured by whole cell quantitative proteomics in (Plate et al., 2016); n=3 biological replicates) vs. their increased interactions with FTALLC in HEK293DAX cells following stress-independent ATF6 and XBP1s co-activation (n=4 biological replicates). The dashed line shows least-squares linear regression. The solid lines show 95% confidence intervals. E. Graph showing changes in protein levels (open symbols; n=3) or FTALLC interactions (solid bars; n=4-7) for PDIA4 in HEK293DAX cells following stress-independent XBP1s (red), ATF6 (blue), or XBP1s and ATF6 (green) activation. Error bars show SEM for the individual replicates. F. Graph showing changes in protein levels (open symbols; n=3) or FTALLC interactions (solid bars; n=4-7) for HYOU1 in HEK293DAX cells following stress-independent XBP1s (red), ATF6 (blue), or XBP1s and ATF6 (green) activation. Error bars show SEM for the individual replicates.
Figure 5.
Figure 5.. Overexpression of ATF6-regulated pro-folding ER proteostasis factors preferentially reduces ALLC secretion.
A. Graph showing the fraction secreted of FTALLC from HEK293DAX cells overexpressing the indicated ER proteostasis factor and treated with cycloheximide (CHX) for 0 or 4 h, as measured by ELISA. Fraction secreted was quantified using the following equation: fraction secreted = [FTALLC in media at t=4 h] / [FTALLC in lysate at t = 0 h]. Error bars show SEM for n > 14 replicates across > 4 independent experiments. *p<0.05, **p<0.01, ***p<0.005 for unpaired t-tests are shown. B. Graph showing fraction secretion for FTALLC or FTJTO from HEK293DAX cells treated with CHX for 0 or 4 h, as measured by ELISA. Fraction secreted was calculated as described in Fig. 4A. Error bars show SEM for n>9 replicates across n>3 independent experiments. ***p<0.005 for unpaired t-test is shown C. Graph showing the normalized fraction secreted of FTALLC or FTJTO from HEK293DAX cells overexpressing the indicated ER chaperoning factor. Normalized fraction secreted was calculated by the following equation: fraction secretion in cells overexpressing a given chaperone / fraction secretion in mock-transfected cells. Fraction secreted was calculated as in Fig. 4A. Error bars show SEM for n > 9 replicates collected across > 3 independent experiments. *p<0.05, ***p<0.005 for unpaired t-tests are shown.
Figure 6.
Figure 6.. Overexpression of BiP partially recapitulates ATF6-dependent reductions in ALLC secretion.
A. Graph showing the normalized fraction secretion of FTALLC in HEK293DAX cells mock-transfected or overexpressing BiP subjected to a 16 h pretreatment with vehicle or ATF6 activation, as measured by ELISA. ATF6 was activated in these cells using trimethoprim (TMP; 10 μM), as previously described (Shoulders et al., 2013). Error bars show SEM for n=6 replicates across two independent experiments. ***p<0.005 for unpaired t-test. B. Graph showing the normalized fraction secretion of FTALLC at t = 2 or 4 h in HEK293DAX cells mock-transfected or overexpressing BiP subjected to 16 h pretreatment with vehicle or ATF6 activation, as measured by [35S] metabolic labeling. Representative autoradiograms are included in Fig. S6A. Error bars show SEM for n=4 separate measurements (2 measurements at t =2 h and 2 measurements at t=4 h) across two independent experiments. *p<0.05, ***p<0.005 for paired t-test. C. Illustration showing a molecular model that explains the selective, ATF6-dependent reduction in destabilized ALLC secretion. The increased chaperoning environment afforded by ATF6 activation promotes iterative rounds of ALLC chaperoning to reduce ALLC folding into a trafficking competent conformation. This leads to increased ER retention of destabilized ALLC in chaperone-bound complexes that prevent its secretion to downstream secretory environments.

Comment in

References

    1. Adachi Y, Yamamoto K, Okada T, Yoshida H, Harada A, and Mori K (2008). ATF6 is a transcription factor specializing in the regulation of quality control proteins in the endoplasmic reticulum. Cell Struct Funct 33, 75–89. - PubMed
    1. Arendt BK, Ramirez-Alvarado M, Sikkink LA, Keats JJ, Ahmann GJ, Dispenzieri A, Fonseca R, Ketterling RP, Knudson RA, Mulvihill EM, et al. (2008). Biologic and genetic characterization of the novel amyloidogenic lambda light chain-secreting human cell lines, ALMC-1 and ALMC-2. Blood 112, 1931–1941. - PMC - PubMed
    1. Balchin D, Hayer-Hartl M, and Hartl FU (2016). In vivo aspects of protein folding and quality control. Science 353, aac4354. - PubMed
    1. Behnke J, Feige MJ, and Hendershot LM (2015). BiP and its nucleotide exchange factors Grp170 and Sil1: mechanisms of action and biological functions. J Mol Biol 427, 1589–1608. - PMC - PubMed
    1. Behnke J, Mann MJ, Scruggs FL, Feige MJ, and Hendershot LM (2016). Members of the Hsp70 Family Recognize Distinct Types of Sequences to Execute ER Quality Control. Mol Cell 63, 739–752. - PMC - PubMed

Publication types

MeSH terms