

Sparse quadratic classification rules via linear dimension reduction
- PMID: 31105355
- PMCID: PMC6516858
- DOI: 10.1016/j.jmva.2018.09.011
Sparse quadratic classification rules via linear dimension reduction
Abstract
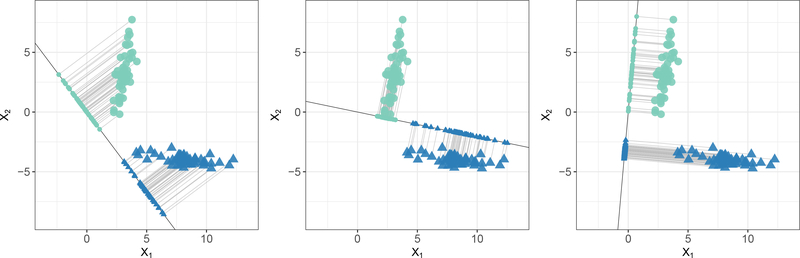
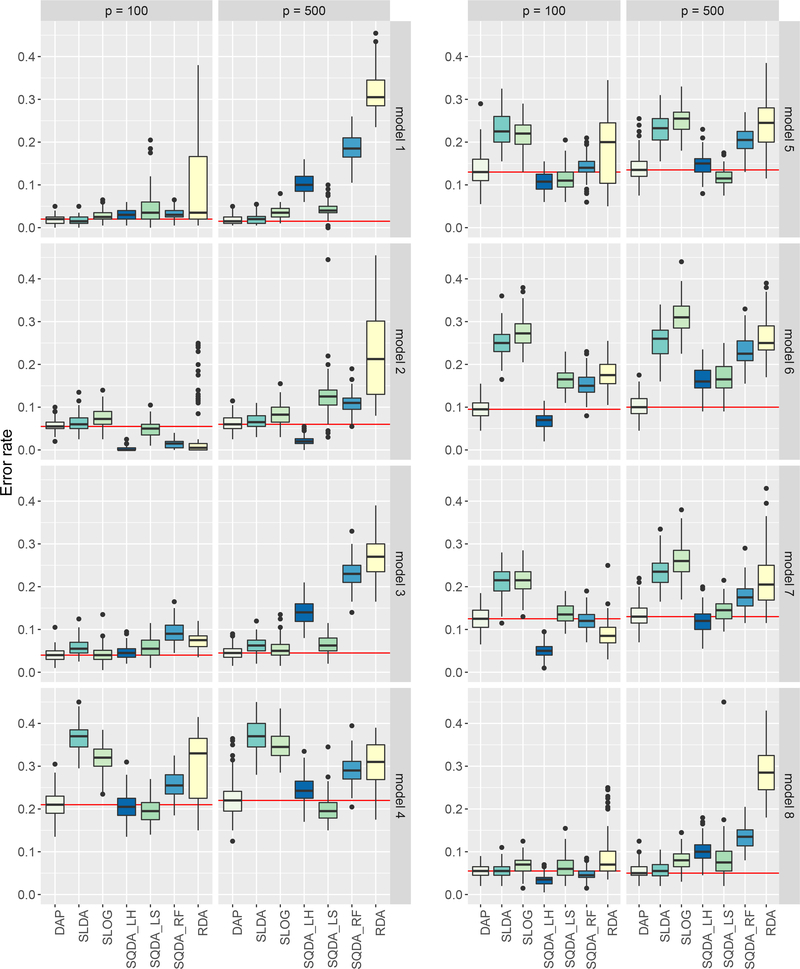
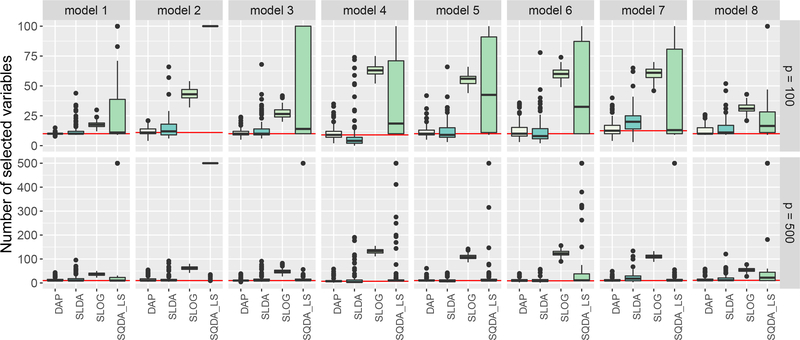
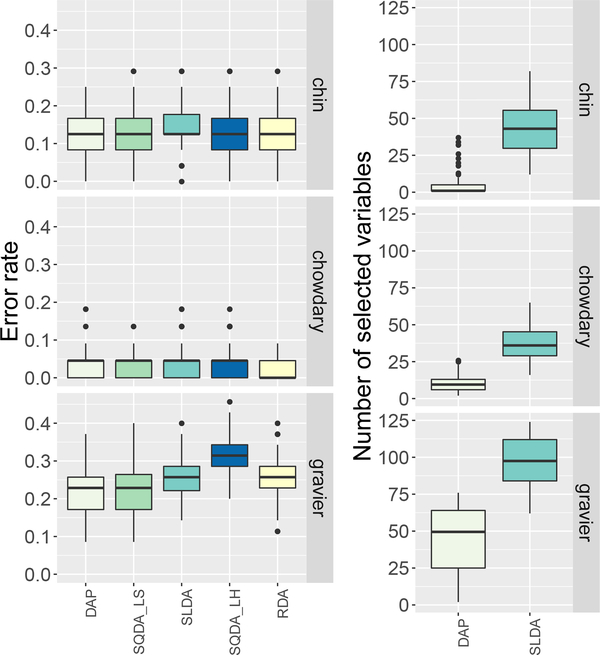
We consider the problem of high-dimensional classification between two groups with unequal covariance matrices. Rather than estimating the full quadratic discriminant rule, we propose to perform simultaneous variable selection and linear dimension reduction on the original data, with the subsequent application of quadratic discriminant analysis on the reduced space. In contrast to quadratic discriminant analysis, the proposed framework doesn't require the estimation of precision matrices; it scales linearly with the number of measurements, making it especially attractive for the use on high-dimensional datasets. We support the methodology with theoretical guarantees on variable selection consistency, and empirical comparisons with competing approaches. We apply the method to gene expression data of breast cancer patients, and confirm the crucial importance of the ESR1 gene in differentiating estrogen receptor status.
Keywords: Convex optimization; Discriminant analysis; High-dimensional statistics; Variable selection.
Figures
Similar articles
-
QUADRO: A SUPERVISED DIMENSION REDUCTION METHOD VIA RAYLEIGH QUOTIENT OPTIMIZATION.Ann Stat. 2015;43(4):1498-1534. doi: 10.1214/14-AOS1307. Ann Stat. 2015. PMID: 26778864 Free PMC article.
-
Sparse Linear Discriminant Analysis using the Prior-Knowledge-Guided Block Covariance Matrix.Chemometr Intell Lab Syst. 2020 Nov 15;206:104142. doi: 10.1016/j.chemolab.2020.104142. Epub 2020 Aug 27. Chemometr Intell Lab Syst. 2020. PMID: 32968333 Free PMC article.
-
The application of sparse estimation of covariance matrix to quadratic discriminant analysis.BMC Bioinformatics. 2015 Feb 18;16:48. doi: 10.1186/s12859-014-0443-6. BMC Bioinformatics. 2015. PMID: 25886892 Free PMC article.
-
Linear Versus Quadratic Multivariate Classification.Multivariate Behav Res. 1978 Apr 1;13(2):237-45. doi: 10.1207/s15327906mbr1302_8. Multivariate Behav Res. 1978. PMID: 26794021
-
An Efficient Greedy Search Algorithm for High-dimensional Linear Discriminant Analysis.Stat Sin. 2023 May;33(SI):1343-1364. doi: 10.5705/ss.202021.0028. Stat Sin. 2023. PMID: 37455685 Free PMC article.
Cited by
-
Interpretable discriminant analysis for functional data supported on random nonlinear domains with an application to Alzheimer's disease.J R Stat Soc Series B Stat Methodol. 2024 Mar 22;86(4):1013-1044. doi: 10.1093/jrsssb/qkae023. eCollection 2024 Sep. J R Stat Soc Series B Stat Methodol. 2024. PMID: 39279915 Free PMC article.
-
Simultaneous differential network analysis and classification for matrix-variate data with application to brain connectivity.Biostatistics. 2022 Jul 18;23(3):967-989. doi: 10.1093/biostatistics/kxab007. Biostatistics. 2022. PMID: 33769450 Free PMC article.
-
Identification of resistance in Escherichia coli and Klebsiella pneumoniae using excitation-emission matrix fluorescence spectroscopy and multivariate analysis.Sci Rep. 2020 Aug 3;10(1):12994. doi: 10.1038/s41598-020-70033-x. Sci Rep. 2020. PMID: 32747745 Free PMC article.
-
Deep learning-based immunohistochemical estimation of breast cancer via ultrasound image applications.Front Oncol. 2024 Jan 9;13:1263685. doi: 10.3389/fonc.2023.1263685. eCollection 2023. Front Oncol. 2024. PMID: 38264739 Free PMC article.
References
-
- Bach FR, Consistency of the group Lasso and multiple kernel learning, J. Mach. Learn. Res 9 (2008) 1179–1225.
-
- Barber RF, Drton M, Exact block-wise optimization in group lasso and sparse group lasso for linear regression, arXiv.org (2010).
-
- Boyd SP, Vandenberghe L, Convex Optimization, Cambridge Univ Press, Cambridge, 2004.
-
- Cai TT, Liu W, A direct estimation approach to sparse linear discriminant analysis, J. Amer. Statist. Assoc. 106 (2011) 1566–1577.
Grants and funding
LinkOut - more resources
Full Text Sources
Other Literature Sources
Miscellaneous