. 2018 Nov:145:250-267.
doi: 10.1016/j.isprsjprs.2018.08.016. Epub 2018 Sep 26.

Satellite-based view of the aerosol spatial and temporal variability in the Córdoba region (Argentina) using over ten years of high-resolution data

Affiliations

Satellite-based view of the aerosol spatial and temporal variability in the Córdoba region (Argentina) using over ten years of high-resolution data

Lara Sofía Della Ceca et al. ISPRS J Photogramm Remote Sens. 2018 Nov.

Abstract

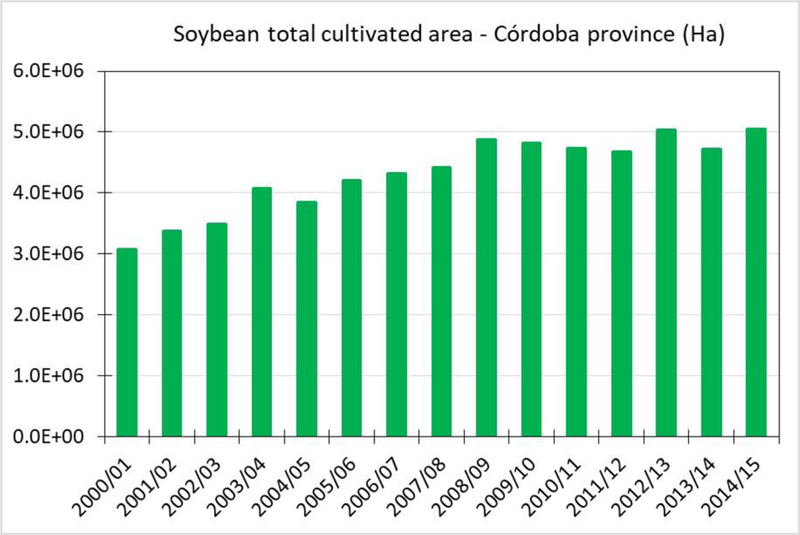
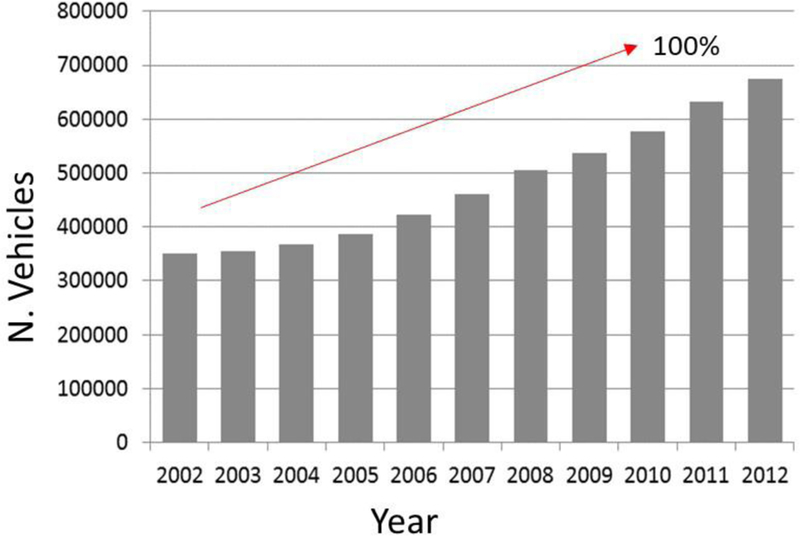
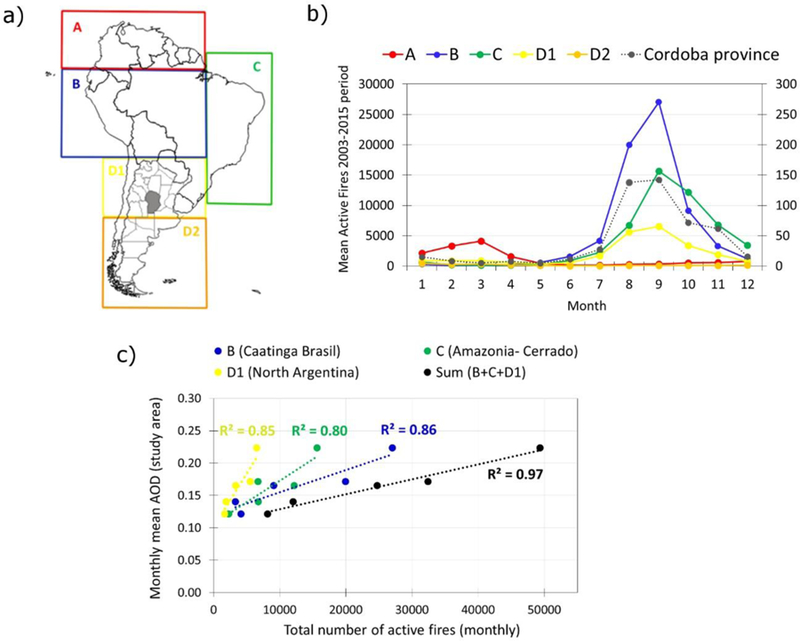
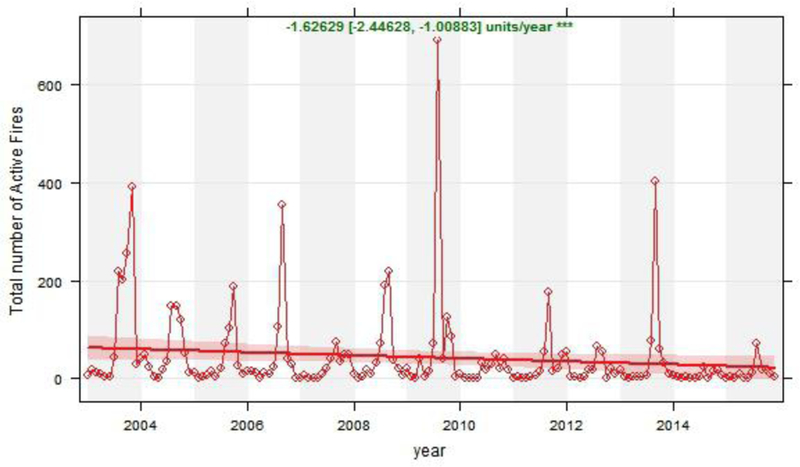
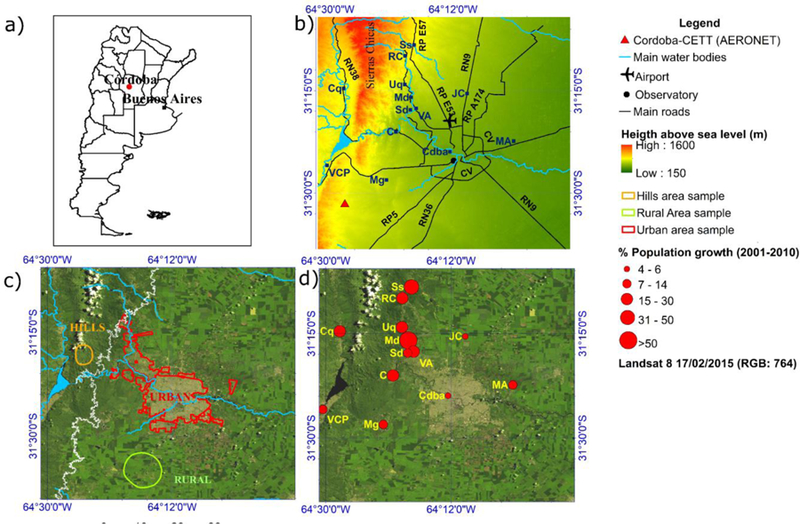
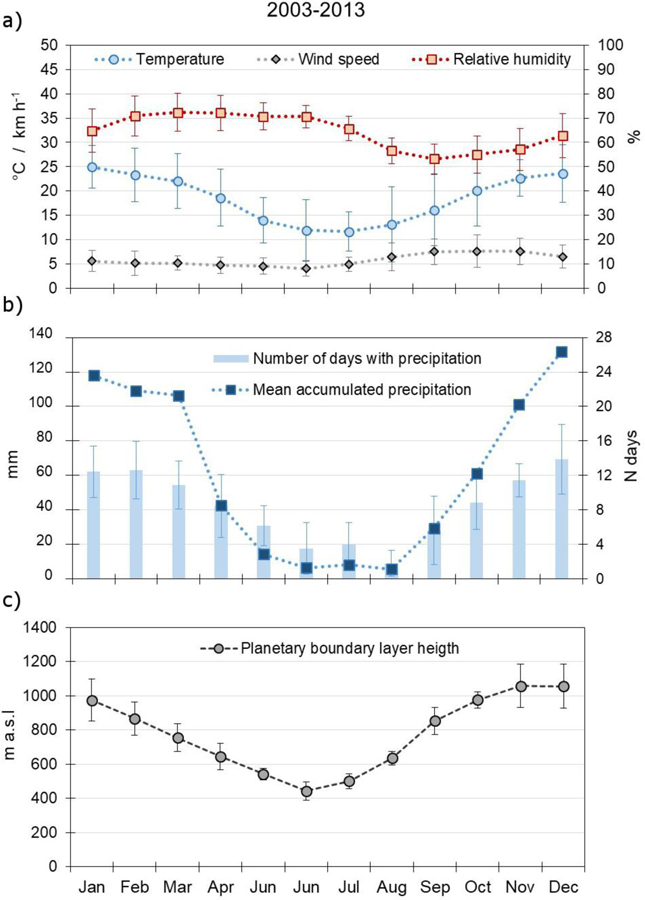
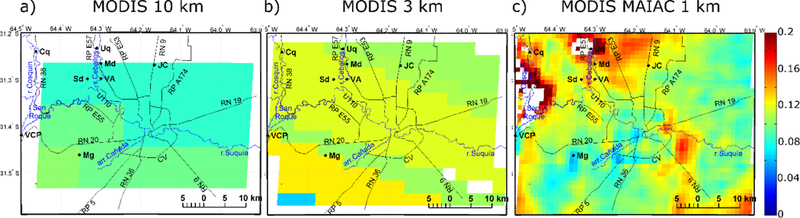
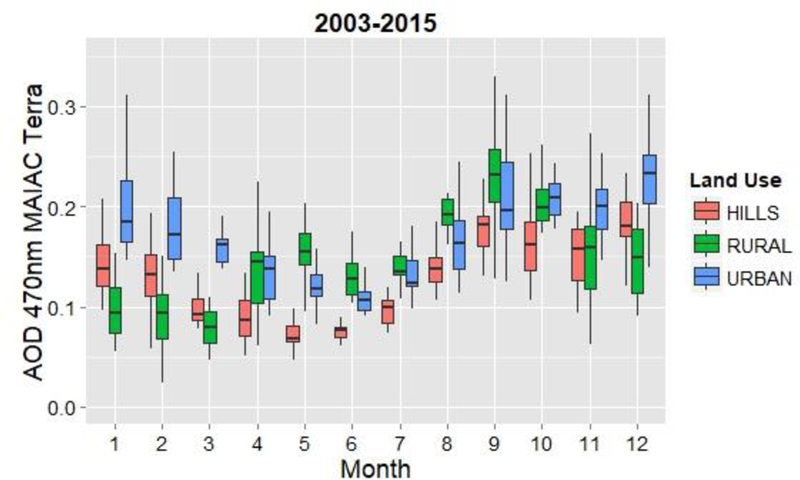
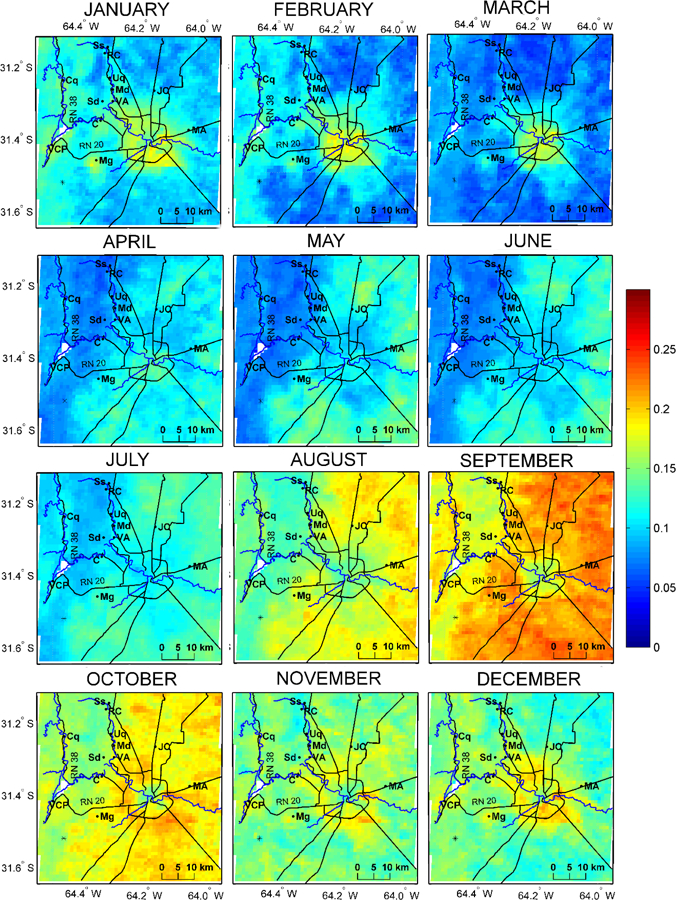
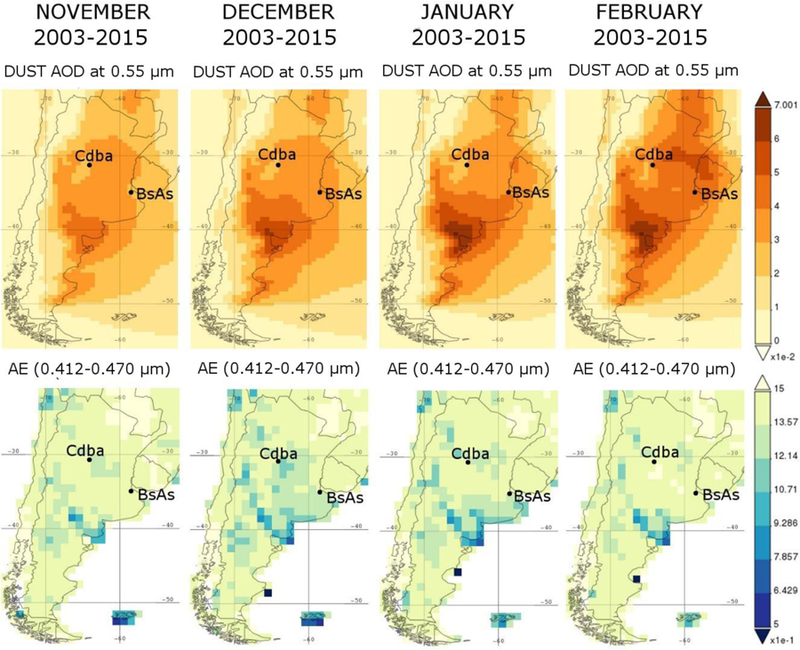
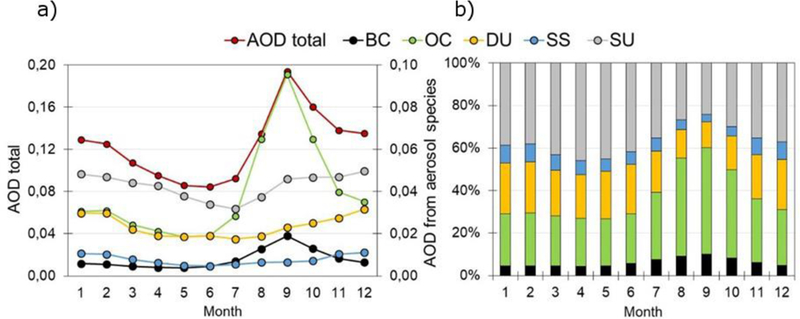
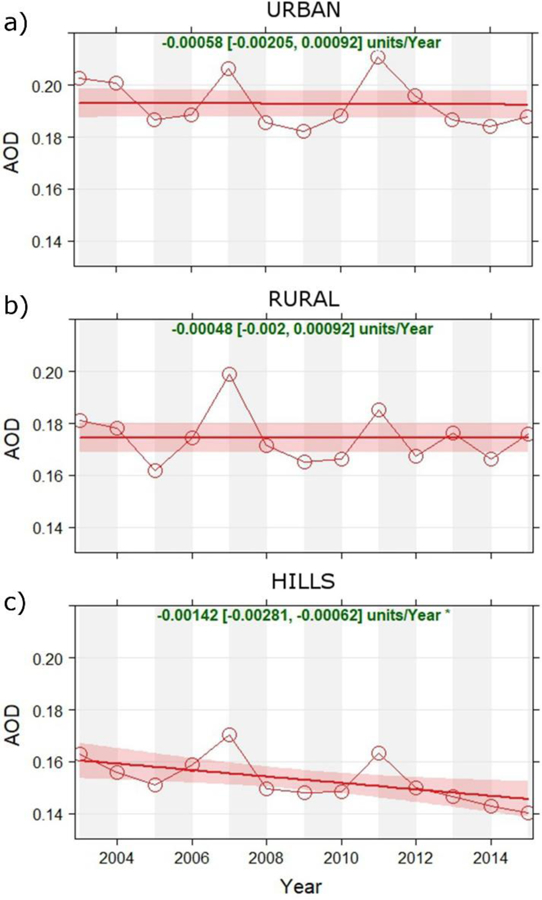
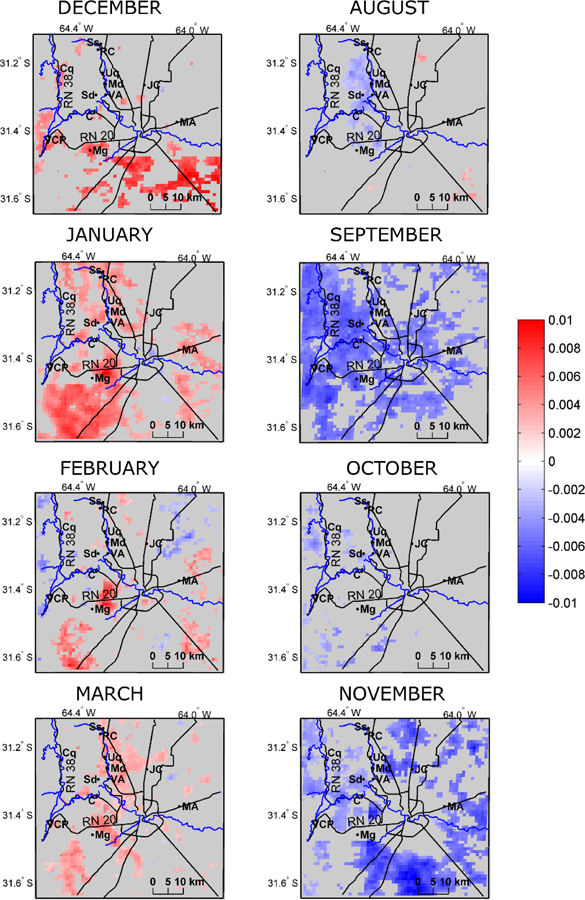
Space-based observations offer a unique opportunity to investigate the atmosphere and its changes over decadal time scales, particularly in regions lacking in situ and/or ground based observations. In this study, we investigate temporal and spatial variability of atmospheric particulate matter (aerosol) over the urban area of Córdoba (central Argentina) using over ten years (2003-2015) of high-resolution (1 km) satellite-based retrievals of aerosol optical depth (AOD). This fine resolution is achieved exploiting the capabilities of a recently developed inversion algorithm (Multiangle implementation of atmospheric correction, MAIAC) applied to the MODIS sensor datasets of the NASA-Terra and -Aqua platforms. Results of this investigation show a clear seasonality of AOD over the investigated area. This is found to be shaped by an intricate superposition of aerosol sources, acting over different spatial scales and affecting the region with different yearly cycles. During late winter and spring (August-October), local as well as near- and long-range transported biomass burning (BB) aerosols enhance the Córdoba aerosol load, and AOD levels reach their maximum values (> 0.35 at 0.47μm). The fine AOD spatial resolution allowed to disclose that, in this period, AOD maxima are found in the rural/agricultural area around the city, reaching up to the city boundaries pinpointing that fires of local and near-range origin play a major role in the AOD enhancement. A reverse spatial AOD gradient is found from December to March, the urban area showing AODs 40 to 80% higher than in the city surroundings. In fact, during summer, the columnar aerosol load over the Córdoba region is dominated by local (urban and industrial) sources, likely coupled to secondary processes driven by enhanced radiation and mixing effects within a deeper planetary boundary layer (PBL). With the support of modelled AOD data from the Modern-Era Retrospective Analysis for Research and Application (MERRA), we further investigated into the chemical nature of AOD. The results suggest that mineral dust is also an important aerosol component in Córdoba, with maximum impact from November to February. The use of a long-term dataset finally allowed a preliminary assessment of AOD trends over the Córdoba region. For those months in which local sources and secondary processes were found to dominate the AOD (December to March), we found a positive AOD trend in the Córdoba outskirts, mainly in the areas with maximum urbanization/population growth over the investigated decade. Conversely, a negative AOD trend (up to -0.1 per decade) is observed all over the rural area of Córdoba during the BB season, this being attributed to a decrease of fires both at the local and the continental scale.

Keywords: Argentina; Córdoba; MAIAC; MODIS; South America; aerosol; air pollution; particulate matter.


Figures

Figure A1
Figure A1
Total area of Córdoba province cultivated with soybean in the 2000 – 2014 period (Source: National Ministry of Agricultural Industry).
Figure A2
Figure A2
Number of vehicles per year in Córdoba city (Source: Municipalidad de Córdoba, http://gobiernoabierto.Córdoba.gob.ar)
Figure A3
Figure A3
Monthly wind roses for the Airport meteorological station. Data provided by the National Weather Service and cover the period 2003–2013.
Figure A4
Figure A4
Five regions of South America (A, B, C, D1, D2, colored boxes, chosen for homogeneity with Videla et al., (2013)), and the Córdoba province region within D1 (grey area); b) Mean number of active fires within the 5 regions (left Y-axis) and within the Córdoba province only (right Y-axis) during the 2003–2015 period; c) correlation between the monthly mean AOD in the study area and total number of active fires in the regions B, C and D1, and their sum (number of active fires is from the MODIS product MCD14DL, Giglio et al., 2003).
Figure A5
Figure A5
Total vehicle transit recorded at the toll stations in National route 20 (see Figure 1b) during the 24 hours of the day in both directions of circulation (Source: National Directorate of Roads of Argentina, data available for the years 2013, 2014, 2015, 2016)
Figure A6
Figure A6
Yearly values of Forest Land Area (unit = 1000 ha) as derived for Argentina (red bars, left y axis) and Brazil (green empty bars, right y axis) over the period 2003–2015 (Source: FAO Statistics Division, Forest Resource Assessment - FRA). Years with darker colour bars are those with official data, light colour bars are FAO estimates (data available at http://faostat.fao.org/)
Figure A7
Figure A7
Monthly mean trend of the total number of active fires (from MODIS product MCD14DL) in Córdoba province for the 2003–2015 period and data fit curve (red line). Red area show the 95 % confidence intervals of the fit, determined using Generalized Additive Modelling. The overall slope of the trend [and relevant 95% confidence intervals] are shown at the top of each panel. The *** symbol indicates that the trend is significant to the 0.001 level.
Figure 1
Figure 1
a) Location of the Córdoba City (red dot) within Argentina and relative position of its capital, Buenos Aires (black square); b) The Córdoba area investigated in this study and relevant topography (color code), with indication of main water bodies (cyan), main roads (RP, RN and CV as black lines) and location of the smaller cities in the area: Malagueño (Mg), Villa Carlos Paz (VCP), Cosquín (Cq), Unquillo (Uq), Mendiolaza (Md), Villa Allende (VA), Juárez Celman (JC), Saldán (Sd), La Calera (C), Salsipuedes (Ss), Río Ceballos (RC), Malvinas Argentinas (MA). Position of the Córdoba AERONET site (red triangle) and of the National Weather Service Observatory (black circle) station is also reported); c) Landsat image of the area, and contours of three main zones of different land use (‘rural’, ‘hills’ and ‘urban’) used in this study; d) Population growth (%) in Córdoba and surrounding cities between 2001 and 2010 (source: National Institute of Statistics and Census).
Figure 2
Figure 2
a) Monthly mean temperature (blue), relative humidity (red), wind speed (gray), and b) accumulated precipitation (blue squares) and number of days of precipitation (bars) at the Observatory station in the Córdoba city center (see Figure 1b). Data are from the National Weather Service and cover the period 2003–2013. c) Planetary boundary layer (PBL) height derived from the MERRA model over the Córdoba area for the same period.
Figure 3
Figure 3
Example of MODIS (Terra) AOD maps over Córdoba city and its surroundings for a single day (18/10/2013) at resolution of: a) 10 km (standard MOD04 product), b) 3 km (standard MOD04_3K product) and c) 1 km (MODIS-MAIAC product). Missing data (white pixels) in plots b) and c) were filtered out as associated to high uncertainty (UNC > 0.1), see text for details.
Figure 4
Figure 4
Scatter plot of MAIAC AOD (0.47 μm) retrievals (25 × 25 km2 area, Aqua & Terra combined) vs Córdoba-CETT AERONET AOD at 0.44 μm (within ±60 min from the satellite overpass) over the period 2003–2010. The continuous black line corresponds to the data linear fit (y= a x + b, see Table 1) while dashed lines to the AOD Expected Error [EE = ± (0.05 + 0.05 × AOD)]. Histograms on each axis show the relative frequency distribution of the data within different AOD bins.
Figure 5
Figure 5
Box plots of AOD (2003–2010 period) obtained using the Córdoba-CETT AERONET AOD at 0.44 μm (red bars) (only data within ±60 minutes from the MODIS overpass average) and MAIAC AOD470 retrievals (25×25 km average, blue bars) from Aqua (left panel) and Terra (right panel). The bold line in each box is the median AOD, upper and lower hinges correspond to the first and third quartiles (the 25th and 75th percentiles, respectively), while whiskers extend from the hinge to the value that is within ±1.5*IQR (interquartile range) of the hinge.
Figure 6
Figure 6
Box plot of MAIAC AOD at 0.470 μm for the 2003–2015 period for the selected ‘urban’, ‘rural’ and ‘hills’ areas (see Figure 1c). Meaning of each box element is the same of Figure 5.
Figure 7
Figure 7
AOD-MAIAC (470 nm) monthly median for the 2003–2015 period over Córdoba city and its surroundings (Mg: Malagueño, VCP: Villa Carlos Paz, Cq: Cosquín, Uq: Unquillo, Md: Mendiolaza, VA: Villa Allende, JC: Juárez Celman, Sd: Saldán, C: La Calera, Ss: Salsipuedes, RC: Río ceballos, MA: Malvinas Argentinas, see also Figure 1).
Figure 8
Figure 8
Top: Monthly mean (2003–2015) MERRA-model Dust-AOD at 0.550 μm at 0.5 × 0.625° for the months from November-to-February (from left to right). Bottom: Monthly mean (2003–2015) Angstrom Exponent as derived over land using the Deep Blue Algorithm applied to MODIS-Aqua data, see text for details). The position of Córdoba (Cdba) and Buenos Aires (BsAs) is reported in both panels.
Figure 9
Figure 9
a) Monthly median (2003–2015) total (red) and component-resolved (Black Carbon, BC, Organic Carbon, OC, Dust, DU, Sea Salt, SS and Sulfate, SU, see color legend) AOD at 0.550 μm as reproduced by the MERRA model over the Córdoba region. Note the different scale for the total AOD (left Y-axis) and the component-resolved ones (right Y-axis). b) Monthly-resolved relative contribution (%) of the different aerosol species to the total AOD.
Figure 10
Figure 10
Annual median AOD MAIAC and data fit curve (red line). Red area show the 95 % confidence intervals of the fit, determined using Generalized Additive Modelling. The overall slope of the trend [and relevant 95% confidence intervals] are shown at the top of each panel. The ∗ symbol indicates that the trend is significant to the 0.05 level.
Figure 11
Figure 11
Monthly and 1km-resolved maps of the slope of the AOD linear fit (units/year) over the 13-year period 2003–2015. Gray areas are those in which the trend is not significant, p < 0.05.

References

    1. Amato F, Schaap M, van der Gon H, Pandolfi M, Alastuey A, Keuken M, Querol X, 2013. Short-term variability of mineral dust, metals and carbon emission from road dust resuspension. Atmospheric Environment, 74, 134–140. doi: 10.1016/j.atmosenv.2013.03.037 - DOI
    1. Ancellet G, Pelon J, Totems J Chazette P, Bazureau A, Sicard M, Di Iorio T, Dulac F, Mallet M, 2016. Long-range transport and mixing of aerosol sources during the 2013 North American biomass burning episode: analysis of multiple lidar observations in the western Mediterranean basin. Atmospheric Chemistry and Physics, 16, 4725–4742. doi: 10.5194/acp-16-4725-2016 - DOI
    1. Andela N, Morton DC, Giglio L, Chen Y, van der Werf GR, Kasibhatla PS, DeFries RS, Collatz GJ, Hantson S, Kloster S, Bachelet D, Forrest M, Lasslop G, Li F, Mangen S, Melton JR, Yue C, Randerson JT, 2017. A human-driven decline in global burned area. Science, 356 (6345), 1356–1362. doi: 10.1126/science.aal4108 - DOI - PMC - PubMed
    1. Anderson T, Charlson R, 2003. Mesoscale variations of tropospheric aerosols. Journal of the Atmospheric Sciences, 60, 119–136. doi: 10.1175/1520-0469(2003)060<0119:MVOTA>2.0.CO;2 - DOI
    1. Andrade Filho VS, Artaxo P, Hacon S, Carmo CN, Cirino G, 2013. Aerosols from biomass burning and respiratory diseases in children, Manaus, Northern Brazil. Revista de Saúde Pública, 47(2), 239–247. doi: 10.1590/S0034-8910.2013047004011 - DOI - PubMed

LinkOut - more resources